According to customs statistics, in the first five months of 2025, the total value of China's import and export of goods trade was 17.94 trillion yuan, up 2.5% YoY (the same hereinafter). Of this total, exports amounted to 10.67 trillion yuan, up 7.2%, while imports reached 7.27 trillion yuan, down 3.8%.
In May, the total value of China's import and export of goods trade was 3.81 trillion yuan, up 2.7%. Of this total, exports amounted to 2.28 trillion yuan, up 6.3%, while imports reached 1.53 trillion yuan, down 2.1%.
The main characteristics of China's import and export in the first five months are as follows:
1. Growth in import and export of Ordinary Trade and processing trade
In the first five months, China's import and export of Ordinary Trade reached 11.51 trillion yuan, up 0.8%, accounting for 64.2% of China's total foreign trade value. Of this total, exports amounted to 7.04 trillion yuan, up 7%, while imports reached 4.47 trillion yuan, down 7.8%. During the same period, the import and export of processing trade reached 3.21 trillion yuan, up 6.2%, accounting for 17.9%. Of this total, exports amounted to 1.99 trillion yuan, up 4.5%, while imports reached 1.22 trillion yuan, up 9.3%. In addition, China's import and export through bonded logistics amounted to 2.54 trillion yuan, up 5.9%. Of this total, exports amounted to 1.05 trillion yuan, up 15.8%, while imports reached 1.49 trillion yuan, down 0.2%.
2. Growth in import and export with ASEAN and the EU
In the first five months, ASEAN was China's largest trading partner, with the total trade value between China and ASEAN reaching 3.02 trillion yuan, up 9.1%, accounting for 16.8% of China's total foreign trade value. Of this total, exports to ASEAN amounted to 1.9 trillion yuan, up 13.5%, while imports from ASEAN reached 1.12 trillion yuan, up 2.3%. The EU was China's second-largest trading partner, with the total trade value between China and the EU reaching 2.3 trillion yuan, up 2.9%, accounting for 12.8%. Of this total, exports to the EU amounted to 1.57 trillion yuan, up 7.7%, while imports from the EU reached 728.33 billion yuan, down 6.1%. The US was China's third-largest trading partner, with the total trade value between China and the US reaching 1.72 trillion yuan, down 8.1%, accounting for 9.6%. Of this total, exports to the US amounted to 1.27 trillion yuan, down 8.7%, while imports from the US reached 447.51 billion yuan, down 6.3%.
During the same period, China's total import and export with countries participating in the Belt and Road Initiative reached 9.24 trillion yuan, up 4.2%. Of this total, exports amounted to 5.34 trillion yuan, up 10.4%, while imports reached 3.9 trillion yuan, down 3.2%.
3. Growth in import and export of private enterprises and foreign-invested enterprises
In the first five months, the import and export of private enterprises reached 10.25 trillion yuan, up 7%, accounting for 57.1% of China's total foreign trade value, an increase of 2.4 percentage points compared with the same period last year. Of this total, exports amounted to RMB 6.97 trillion, up 8%, accounting for 65.4% of China's total export value. Imports reached RMB 3.28 trillion, up 4.9%, accounting for 45.1% of China's total import value. During the same period, the import and export volume of foreign-invested enterprises was RMB 5.21 trillion, up 2.3%, accounting for 29% of China's total foreign trade value. Of this, exports were RMB 2.88 trillion, up 6%, and imports were RMB 2.33 trillion, down 1.9%. The import and export volume of state-owned enterprises was RMB 2.44 trillion, down 12.7%, accounting for 13.6% of China's total foreign trade value. Of this, exports were RMB 799.4 billion, up 4.3%, and imports were RMB 1.64 trillion, down 19.1%.
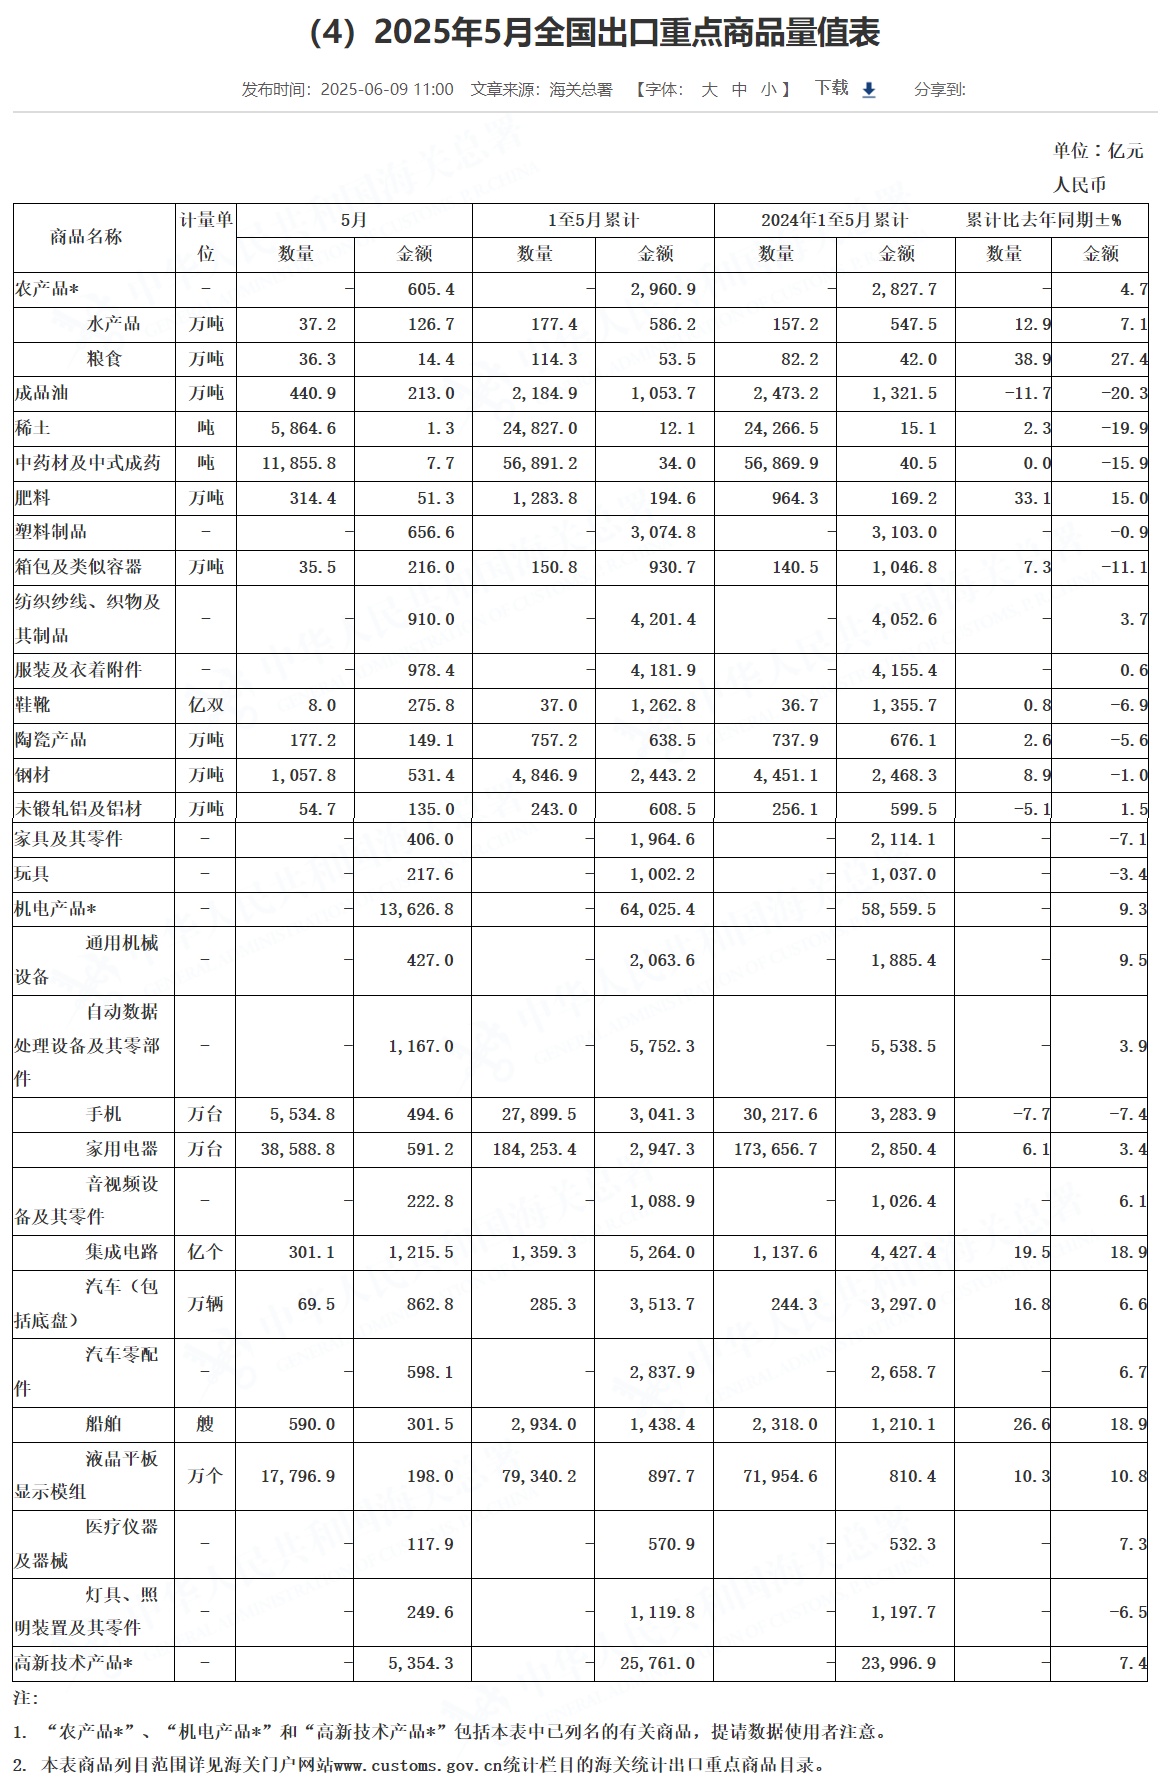
IV. Mechanical and electrical products accounted for 60% of exports, with growth in exports of automatic data processing equipment and its parts, integrated circuits, and automobiles.
In the first five months, China exported RMB 6.4 trillion worth of mechanical and electrical products, up 9.3%, accounting for 60% of China's total export value. Of this, automatic data processing equipment and its parts were worth RMB 575.23 billion, up 3.9%; integrated circuits were worth RMB 526.4 billion, up 18.9%; and automobiles were worth RMB 351.37 billion, up 6.6%. During the same period, exports of labor-intensive products were RMB 1.66 trillion, down 1.5%, accounting for 15.6%. Of this, textiles were worth RMB 420.14 billion, up 3.7%. Exports of agricultural products were RMB 296.09 billion, up 4.7%.
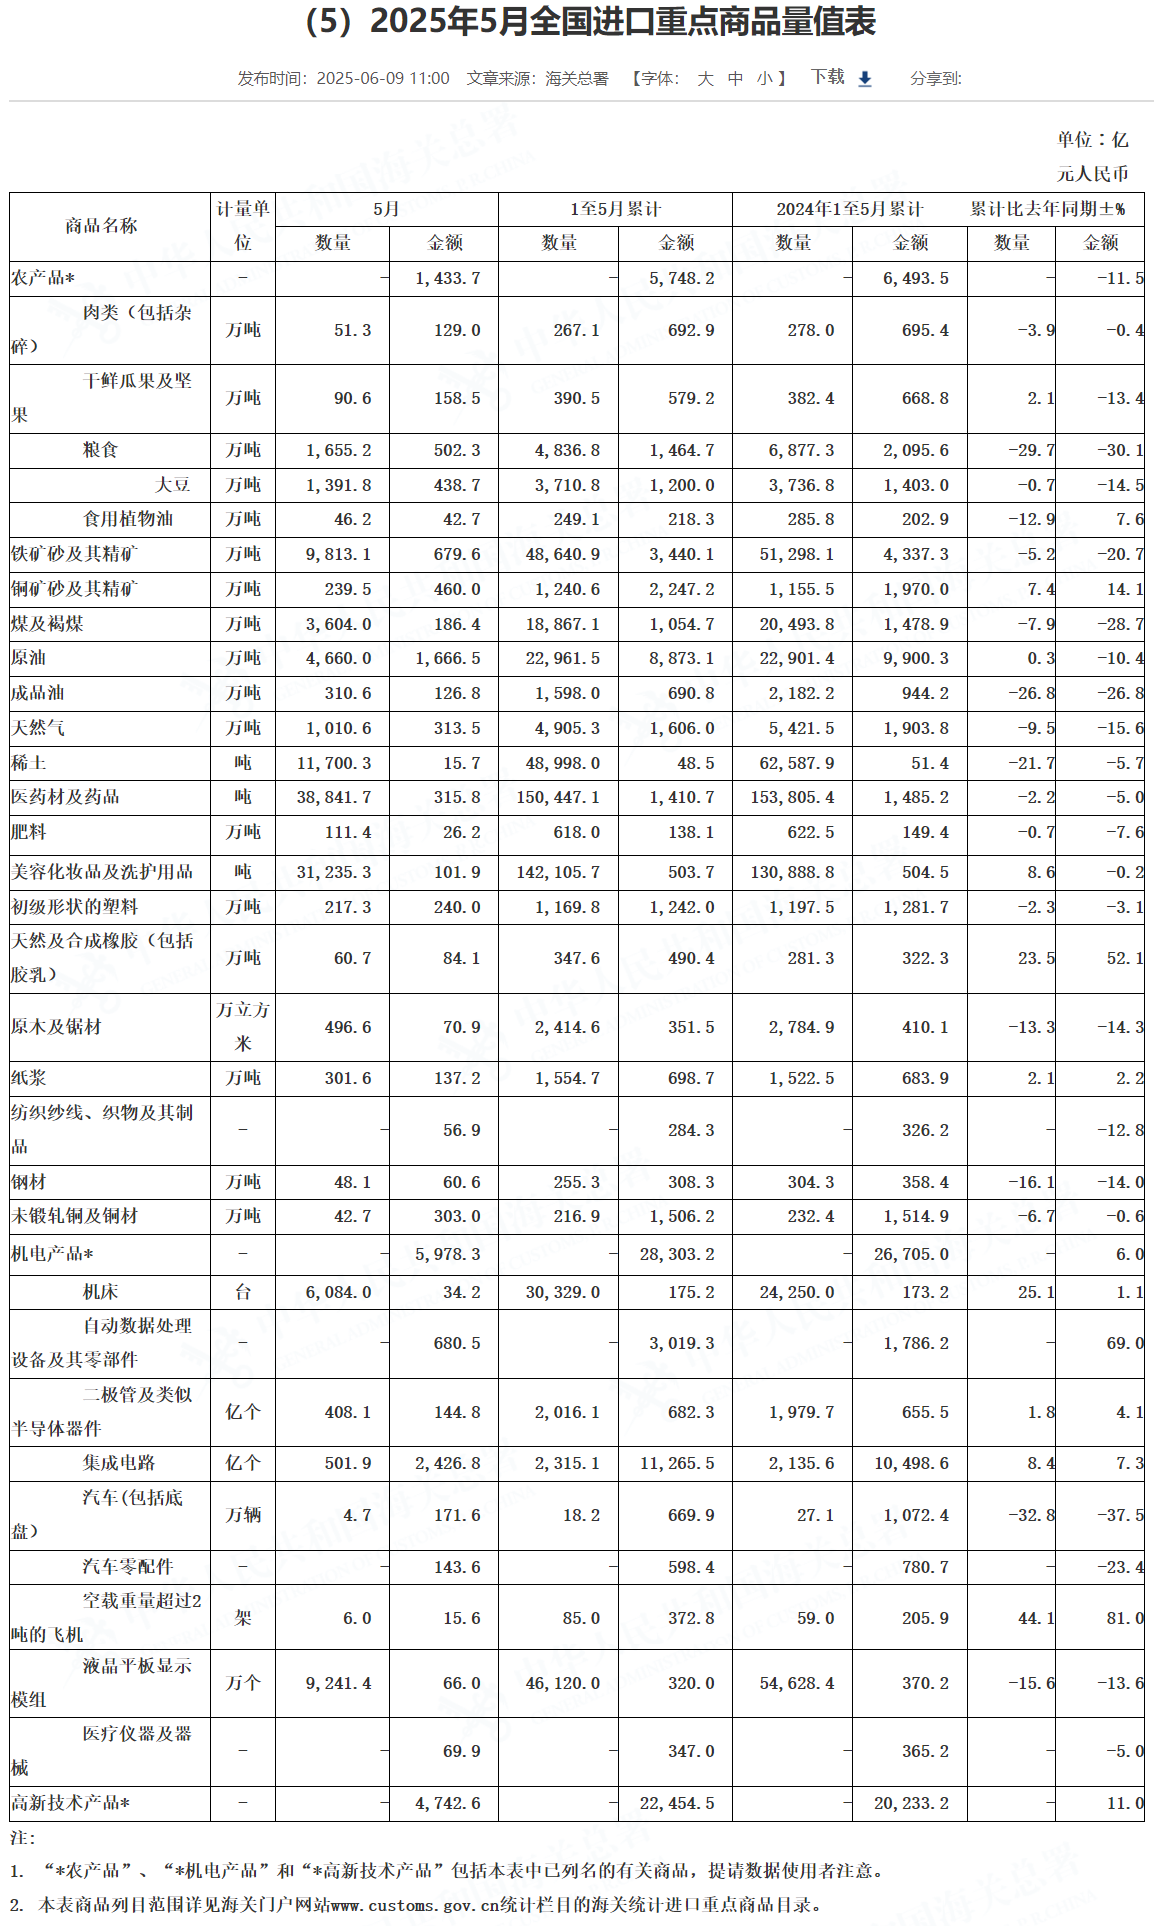
V. Import prices of major bulk commodities such as iron ore, crude oil, and coal fell, while the import value of mechanical and electrical products increased.
In the first five months, China imported 486 million mt of iron ore, down 5.2%, with an average import price (the same hereinafter) of RMB 707.2 per mt, down 16.4%; 230 million mt of crude oil, up 0.3%, at RMB 3,864.3 per mt, down 10.6%; 189 million mt of coal, down 7.9%, at RMB 559 per mt, down 22.5%; 49.053 million mt of natural gas, down 9.5%, at RMB 3,274 per mt, down 6.8%; 37.108 million mt of soybeans, down 0.7%, at RMB 3,233.9 per mt, down 13.9%; and 15.98 million mt of refined oil products, down 26.8%, at RMB 4,323.2 per mt, down 0.1%. In addition, China imported 11.698 million mt of primary-shaped plastics, down 2.3%, at RMB 10,600 per mt, down 0.8%; and 2.169 million mt of unwrought copper and copper semis, down 6.7%, at RMB 69,400 per mt, up 6.6%. During the same period, imports of mechanical and electrical products were RMB 2.83 trillion, up 6%.
SMM has compiled the import and export situation of some products in the metal industry based on data released by the General Administration of Customs, as follows:
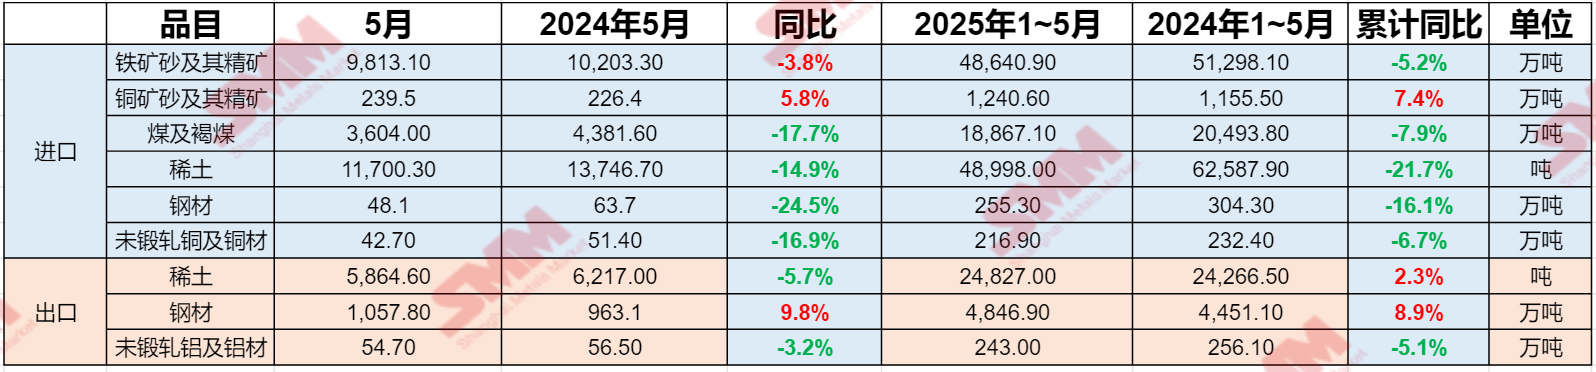
Exports:
Rare earth exports in May 20255,864.6mt, down 5.7% YoY from May 2024. From January to May 2025, cumulative exports reached 248,270 mt, up 2.3% YoY compared to January-May 2024.
In May 2025, steel exports totaled 10.578 million mt, up 9.8% YoY compared to May 2024. From January to May 2025, cumulative exports reached 484,690 mt, up 8.9% YoY compared to January-May 2024.
In May 2025, exports of unwrought aluminum and aluminum semis totaled 5.47 million mt, down 3.2% YoY compared to May 2024. From January to May 2025, cumulative exports reached 2.43 million mt, down 5.1% YoY compared to January-May 2024.
Imports:
In May 2025, imports of iron ore and concentrates totaled 98.131 million mt, down 3.8% YoY compared to May 2024. From January to May 2025, cumulative imports reached 486.409 million mt, down 5.2% YoY compared to January-May 2024.
In May 2025, imports of copper ore and concentrates totaled 2.395 million mt, up 5.8% YoY compared to May 2024. From January to May 2025, cumulative imports reached 12.406 million mt, up 7.4% YoY compared to January-May 2024.
In May 2025, imports of coal and lignite totaled 36.04 million mt, down 17.7% YoY compared to May 2024. From January to May 2025, cumulative imports reached 188.671 million mt, down 7.9% YoY compared to January-May 2024.
In May 2025, imports of rare earths reached 11,700.3 mt, down 14.9% YoY compared to May 2024. From January to May 2025, cumulative imports reached 48,998.0 mt, down 21.7% YoY compared to January-May 2024.
In May 2025, steel imports reached 481,000 mt, down 24.5% YoY compared to May 2024. From January to May 2025, cumulative imports reached 2.553 million mt, down 16.1% YoY compared to January-May 2024.
In May 2025, imports of unwrought copper and copper semis totaled 4.27 million mt, down 16.9% YoY compared to May 2024. From January to May 2025, cumulative imports reached 2.169 million mt, down 6.7% YoY compared to January-May 2024.
》Click to view the SMM Metal Industry Chain Database
Related readings:General Administration of Customs: China's import and export of goods trade increased by 2.5% in the first five months, with exports up 6.3% YoY in May