At the 2025 Indonesia Mining Conference & Critical Metals Conference - Tin Session, Chen Peng, Senior Tin Analyst at SMM, discussed the theme of changes in the global tin industry chain landscape and future development trends.
1. Global Tin Resource Distribution and Supply Landscape
Intensified Resource Scarcity: Static Mining Lifespan Less Than 15 Years
China accounts for 22% of global tin ore reserves but contributes 45% of global production, with resource development intensity exceeding critical thresholds.
• Global tin resources are highly concentrated, with China, Indonesia, and Myanmar collectively accounting for over 50%. China, as the largest producer (45% of production), and Indonesia form a dual-core driving force, yet with significant differences in resource endowments.
Tin Ore Segment: Global tin ore production is also primarily concentrated in countries with high reserves
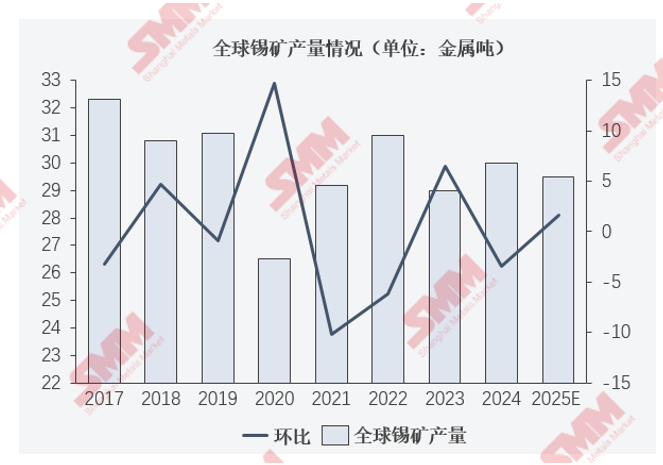
• Global tin ore production is mainly concentrated in countries such as China, Indonesia, Myanmar, and the DRC.
• Except during the COVID-19 pandemic period, global tin ore production has consistently remained at the level of 300,000 mt in metal content annually.
Tin Ore Segment: Tin ore imports continued to decline in 2025, with cumulative YoY imports for January-April 2025 at -47.98%. The contraction of tin ore supply from Myanmar has become a long-term trend.
• The market generally expects that Wa State may resume production by mid-2025, but the initial increase will not exceed 10,000 mt in metal content, and it will require a 2-3 month transmission period. The progress of production resumption will be constrained by Sino-Myanmar mining trade negotiations and the centralization process in Wa State.
Tin Ore Segment: Myanmar's Dominance Weakens, Diversified Landscape Accelerates
• Before 2023: Myanmar once accounted for 72%-85% of China's tin ore imports. However, after the implementation of the mining ban policy in Wa State in August 2023, its supply volume plummeted. By 2024, Myanmar's import share dropped to 48.1%, and further declined to 24%-30% in 2025. The core mining area, Mansang (accounting for 80% of Myanmar's supply), remains in a state of suspension.
• Emergence of Alternative Sources: Imports from Africa (DRC, Nigeria), South America (Peru, Bolivia), and Australia have increased significantly. For example, in 2025, the import share from the DRC rose to 28%, Nigeria's import share reached 11%, and Australia's imports surged by 101% YoY. The 20-day moving average of recent tin ore import profit margins has remained stable.
►Risk Point Reminder:
African Supply Chain Stability to Be Verified: Operational risks at Alphamin mine in the DRC (short-term suspension in April 2025).
Global Refined Tin Landscape Features "Asia-Dominated, South America-Supported, Africa-Supplemented"
• In the global tin industry chain, most smelting and refining activities are concentrated near tin ore production sites. Countries such as China, Indonesia, Malaysia, Peru, Thailand, the DRC, Bolivia, and Brazil all have smelters of a certain scale, with China and Indonesia accounting for a relatively high proportion.
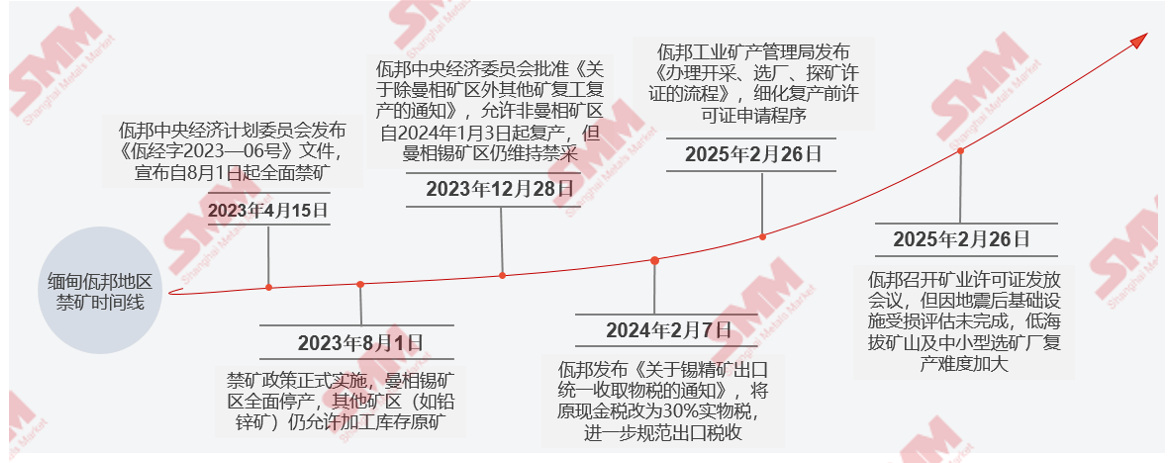
The production resumption process in the Wa region of Myanmar has commenced, but due to the impact of earthquakes and rising policy implementation costs, the actual increase may fall short of expectations.
The core contradiction in the tin ore event chain in the DRC lies in the game between geopolitical conflicts and resource dependence.
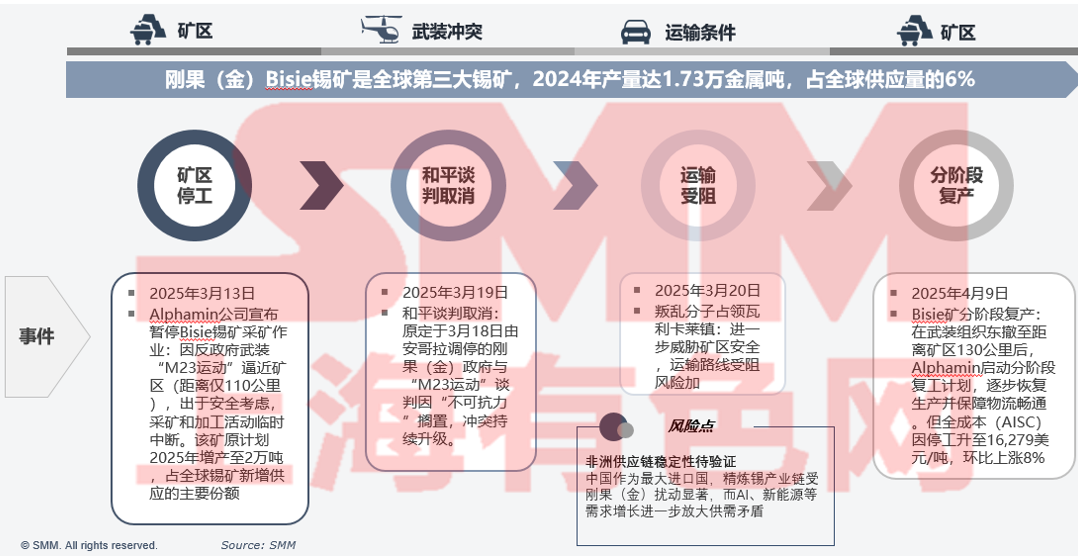
Risk Points:
Stability of the African supply chain to be verified: As the largest importer, China's refined tin industry chain is significantly affected by disruptions in the DRC, while the growth in demand for AI, new energy, etc., further exacerbates the supply-demand imbalance.
2. Global Tin Consumption Structure and Demand Evolution
Terminal Segment: Tin Consumption Structure
• In the global tin consumption structure, tin solder accounts for 48%, tin chemicals 16%, lead-acid batteries 7%, and tin alloys 7%.
• In China's tin consumption structure, tin solder accounts for 67%, tin chemicals 12%, lead-acid batteries 7%, and tinplate 6%.
Terminal Segment: The Philadelphia Semiconductor Index (SOX) shows a significant negative correlation with the real yield of 10-year US Treasuries. AI demand has driven the capacity utilisation rate of semiconductor companies to record highs.
• In the past two years, the SOX has shown a significant negative correlation with the real yield of 10-year US Treasuries, primarily driven by liquidity expectations and valuation pressures.
• In 2024, the capacity utilisation rate of the US computer and semiconductor industry remained stable at 76.53%-78.44%, close to the average over the past 10 years (76.72%). In specific segments, the semiconductor capacity utilisation rate reached 95% in Q1 2025, a record high, reflecting the supply-demand tension driven by AI demand.
Terminal Segment: The cumulative YoY growth rate of PVC resin production has dropped back slightly, while key enterprises producing tinplate have operated smoothly throughout the year.
• The construction of commercial housing is not an isolated process; it is usually accompanied by an increase in demand for building materials. Despite two consecutive years of decline in the sales area of commercial housing, completion demand and policy support (such as ensuring timely delivery of housing projects and infrastructure investment) have driven PVC consumption growth, with a "weak positive correlation" maintained between the two in the past two years.
• In the past two years, the tinplate industry has exhibited a differentiated pattern of "shortage in the high-end segment and surplus in the low-end segment". Leading enterprises have consolidated their advantages through technological upgrades and export markets, while small and medium-sized enterprises face integration pressures. However, overall production has remained at a relatively stable level and is expected to maintain its current magnitude in the future.
3. Inventory Cycle and Supply Chain Resilience Building
Inventory Link: China's tin ingot social inventory exhibits significant cyclical characteristics
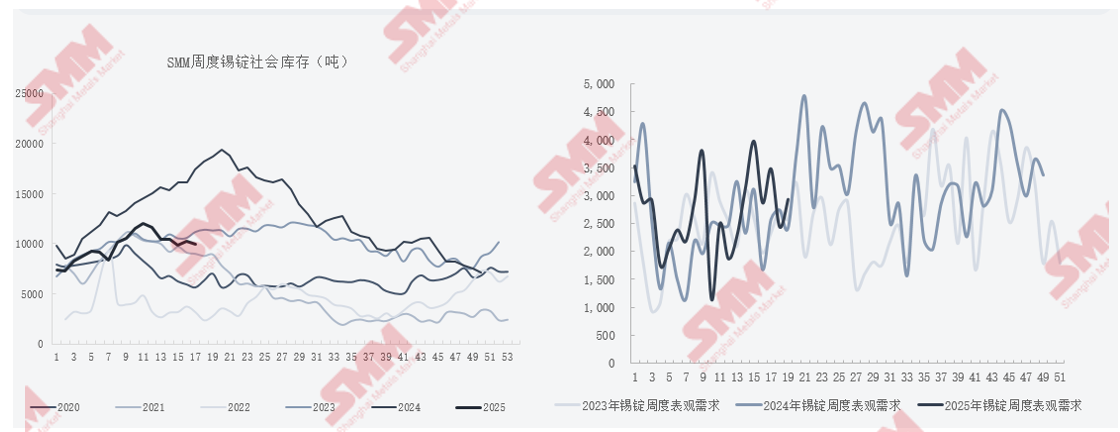
•From February to March 2025, inventory showed an alternating pattern of "increase-decrease", mainly due to the release of downstream restocking demand coupled with fluctuations in SHFE tin prices.
•Inventory changes in tin ingots are highly correlated with prices, seasonal demand (e.g., the "September-October peak season"), and policy adjustments (e.g., production restrictions in smelting), exhibiting a cyclical pattern of "inventory buildup in H1 and destocking in H2".
It also elaborated on the inventory levels within China's tin industry chain.
4. Changes in the Global Tin Industry Chain Landscape and Future Development Trends
In 2024, the global tin market was characterized by "regional shortages and a slight global deficit"
The tin market achieved a tight balance amid supply disruptions and demand differentiation in 2024, and is expected to shift towards a slight surplus in 2025. However, structural contradictions (uneven regional supply recovery, emerging demand growth) will dominate price fluctuations. The market should closely monitor the pace of production resumptions in Myanmar, Indonesia's exports, and the semiconductor industry's recovery, while guarding against unexpected shocks from macro policies and geopolitical risks.
►SMM Outlook
•In 2024, the global tin ingot market was characterized by concurrent supply contraction and weak demand recovery. Affected by factors such as the suspension of mining operations in Myanmar's Wa region and delayed approval of Indonesia's export quotas, global tin ore production declined YoY. However, the release of unreported inventory and the supplementation of recycled tin alleviated supply pressures, leading to a slight increase in annual refined tin production to approximately 374,000 mt. On the demand side, weak recovery in the semiconductor industry and a slowdown in PV growth dragged down global consumption to around 373,000 mt, resulting in a supply-demand gap of approximately 11,000 mt.
•In 2025, expectations for production resumptions in Myanmar (with potential output increases in H2) and full production at new projects in the DRC and China will drive supply growth. On the demand side, the upward trend in the semiconductor cycle, coupled with the application of AI technology and growth in NEVs, may increase global consumption to 375,000 mt. However, growth in traditional sectors (e.g., tinplate, home appliance exports) will slow down to 2.1%-3.5% due to trade frictions. The annual supply-demand gap may narrow to 5,100 mt, but geopolitical risks (Myanmar's political situation, Indonesia's exports) may exacerbate volatility.
》Click to view the special report on the 2025 Indonesia Mining Conference & Critical Metals Conference

![[South Korea's July ICT Exports Grew 140%, Setting a Record High for July]](https://imgqn.smm.cn/usercenter/LLUUJ20251217171751.jpeg)
![[LG Partners with Nvidia to Launch Next-Generation Humanoid Robot in Q1 Next Year]](https://imgqn.smm.cn/usercenter/pLauM20251217171751.jpg)