
》Check SMM silicon product quotes
》Order to view historical price trends of SMM metal spot cargo
SMM News on May 25, 2025:
In April 2025, China's PV glass exports reached 319,900 mt, up 16.7% YoY and down 2.8% MoM. From January to April 2025, exports totaled 1.3232 million mt, up 10.1% YoY. India was the largest trading partner in April, with exports of 87,200 mt, down 5.93% MoM. Despite the high module scheduled production overseas in April and impressive glass export data from China, exports are expected to decline due to weakening installation demand.
Figure 1: China's PV Glass Exports in April 2025
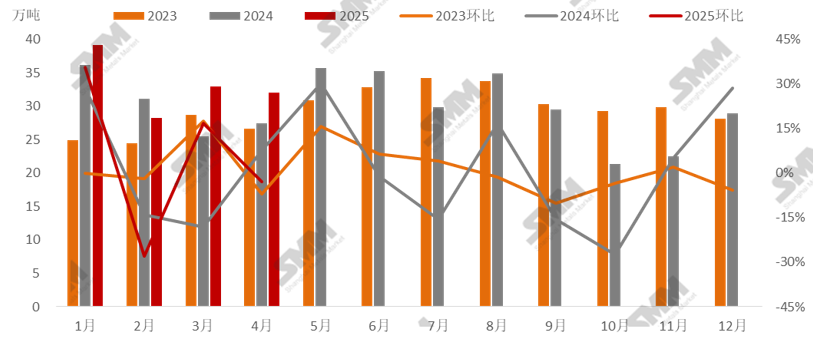
Source: General Administration of Customs, SMM
The top five trading partners in April were India, the US, Vietnam, Indonesia, and Thailand. The US demand rose to the second position, up 2.19% MoM from March. The top five trading partners accounted for 72.44% of total exports, showing a further decline from March. In recent years, the end-use demand for PV products in various countries has continued to grow, and the concentration of trade has decreased.
Figure 2: Statistics on China's PV Glass Exports by Trading Partner in April 2025
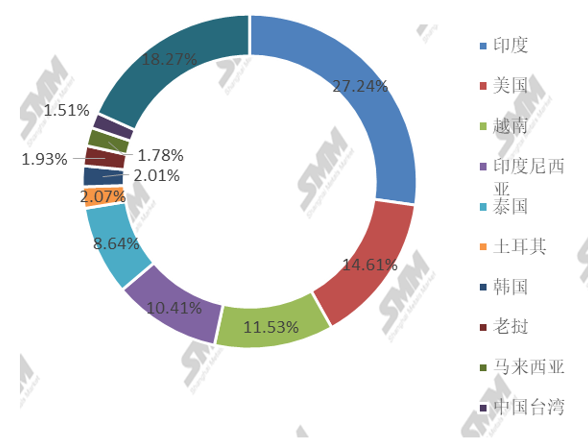
Source: General Administration of Customs, SMM
Compared with March data, China's exports to India were 87,200 mt, down 5.93% MoM, accounting for 27.24% of total exports, with the export share continuing to decline. This is due to the development of localized glass production in India and resistance to Chinese PV glass. It is expected that India's overall exports will show a weakening trend. China's exports to the US were 39,400 mt, up 2.19% MoM, accounting for 14.61% of total exports, with the trade volume rising to the second position. China's exports to Vietnam were 36,900 mt, down 13.58% MoM, accounting for 11.53% of total exports, with the trade volume dropping to the third position. China's exports to Indonesia were 33,300 mt, up 14.04% MoM from March, with the trade volume rising to the fourth position. China's exports to Thailand were 27,600 mt, up 29.05% MoM, accounting for 8.64% of total exports, with the trade volume dropping to the fifth position.
![[SMM PV News] Armenia Hits 1.1 GW Solar Capacity,](https://imgqn.smm.cn/usercenter/qQwIB20251217171741.jpg)
![Spot Market and Domestic Inventory Brief Review (February 5, 2026) [SMM Silver Market Weekly Review]](https://imgqn.smm.cn/usercenter/tSwaX20251217171735.jpg)