China Copper Foil Customs Details for January-February 2025, Imports and Exports Both Decline YoY [SMM Analysis]

Published: Mar 24, 2025 11:37 (GMT+8)
Source: SMM
SMM Analysis: According to data from the General Administration of Customs, China's copper foil imports in January 2025 were approximately 6,917.61 mt, down 1.66% YoY and 16.60% MoM; in February, imports were about 6,901.16 mt, down 3.26% YoY and 0.24% MoM...

SMM March 24 news:

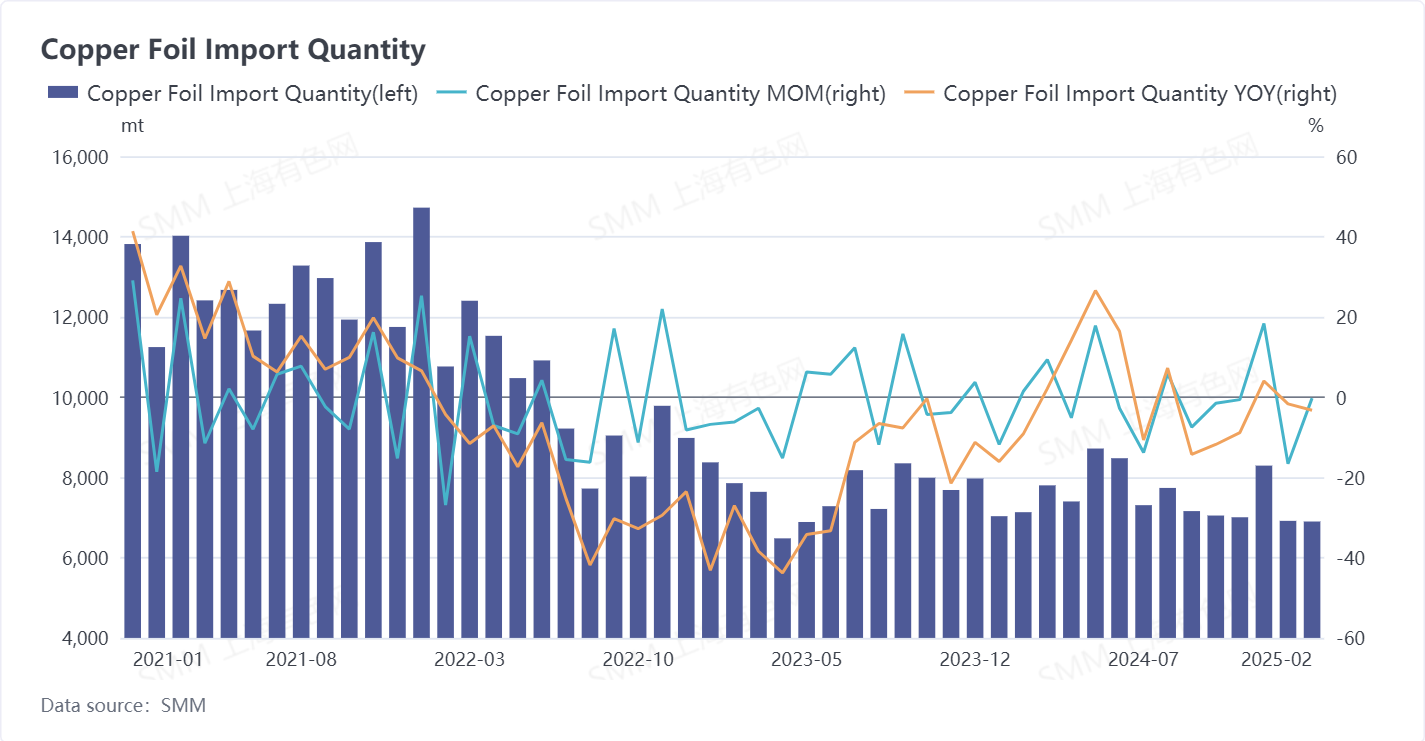
According to data from the General Administration of Customs, China's copper foil imports in January 2025 were approximately 6,917.61 mt, down 1.66% YoY and 16.60% MoM; in February, imports were about 6,901.16 mt, down 3.26% YoY and 0.24% MoM; cumulative imports for January-February 2025 were around 13,818.77 mt, down 2.46% YoY.
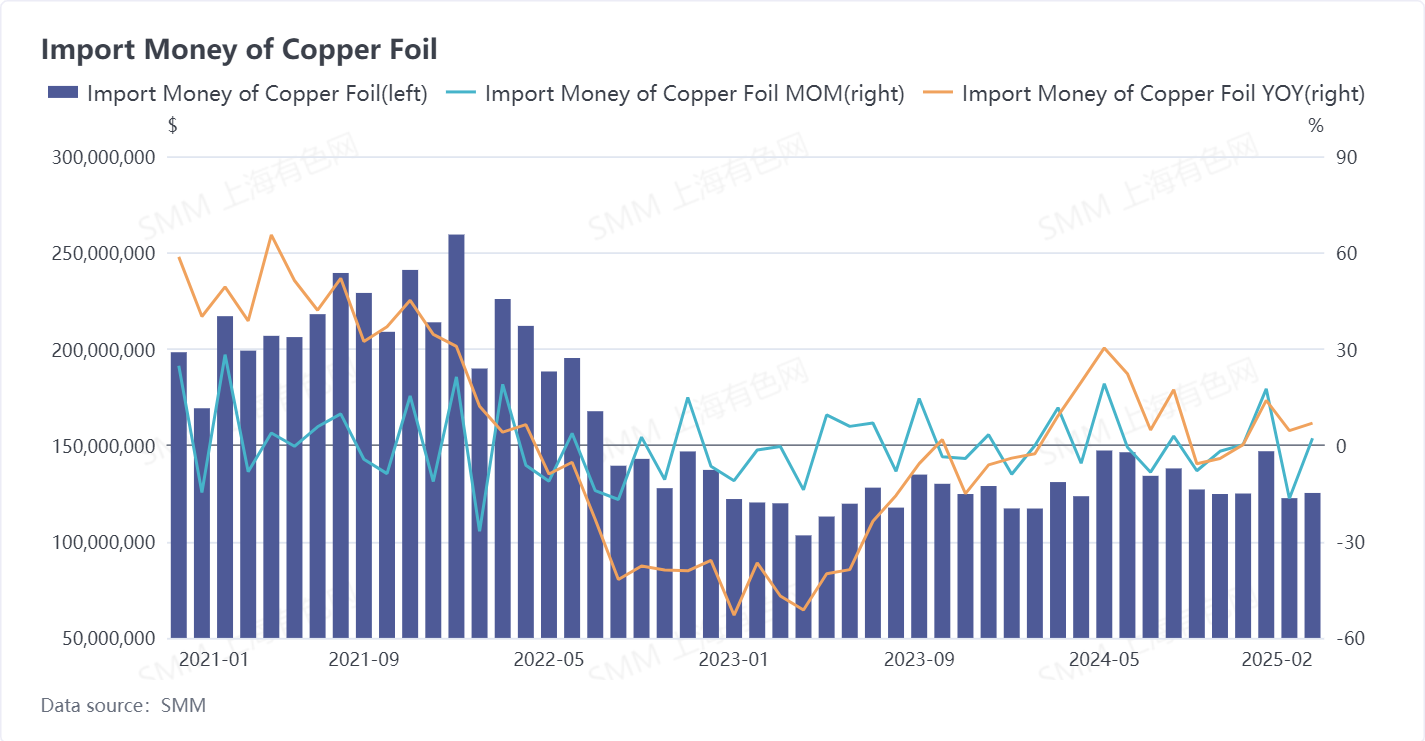
China's copper foil import value in January 2025 was $122.5725 million, up 4.56% YoY and down 16.58% MoM; in February, the import value was $125.2719 million, up 6.90% YoY and 2.20% MoM; cumulative import value for January-February 2025 was $247.8444 million, up 5.73% YoY.
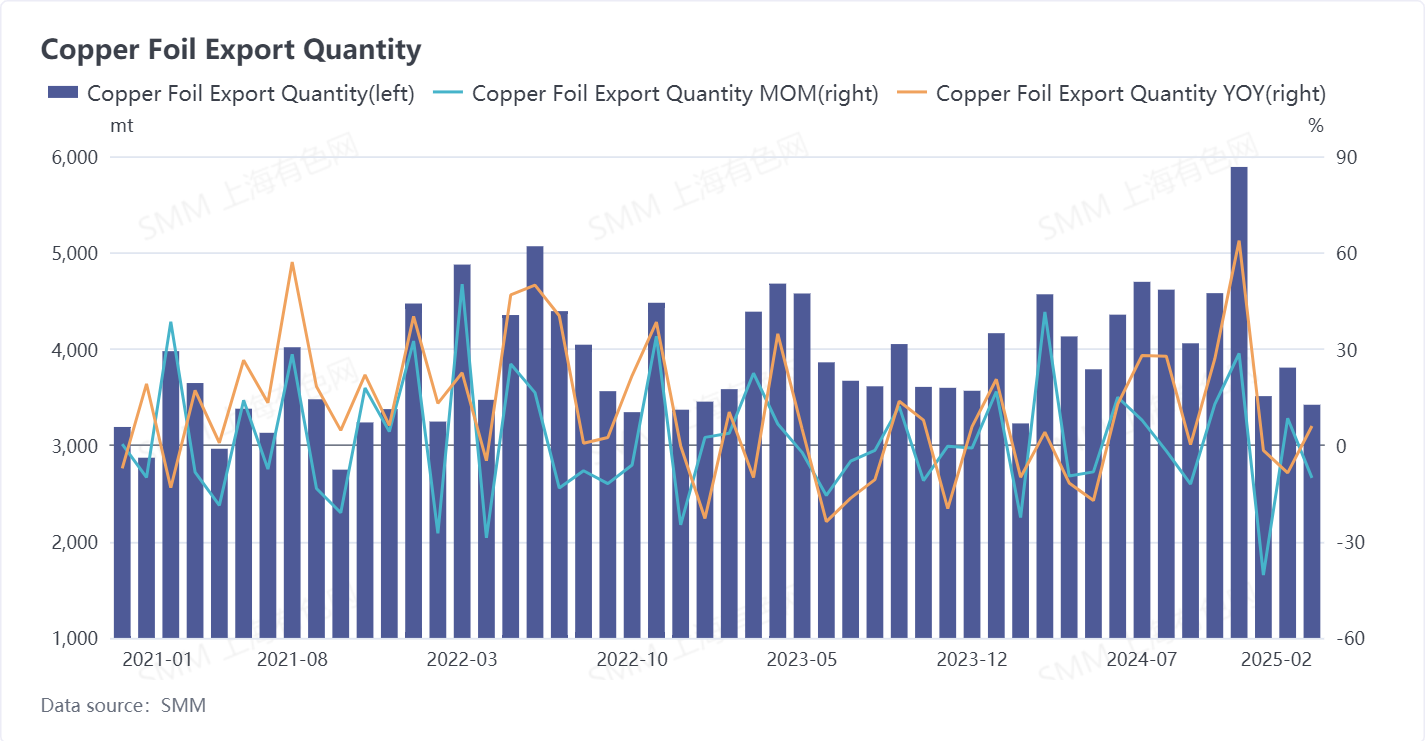
China's copper foil exports in January 2025 were approximately 3,806.89 mt, down 8.58% YoY and up 8.43% MoM; in February, exports were about 3,421.31 mt, up 6.00% YoY and down 10.13% MoM; cumulative exports for January-February 2025 were around 7,228.2 mt, down 2.21% YoY.
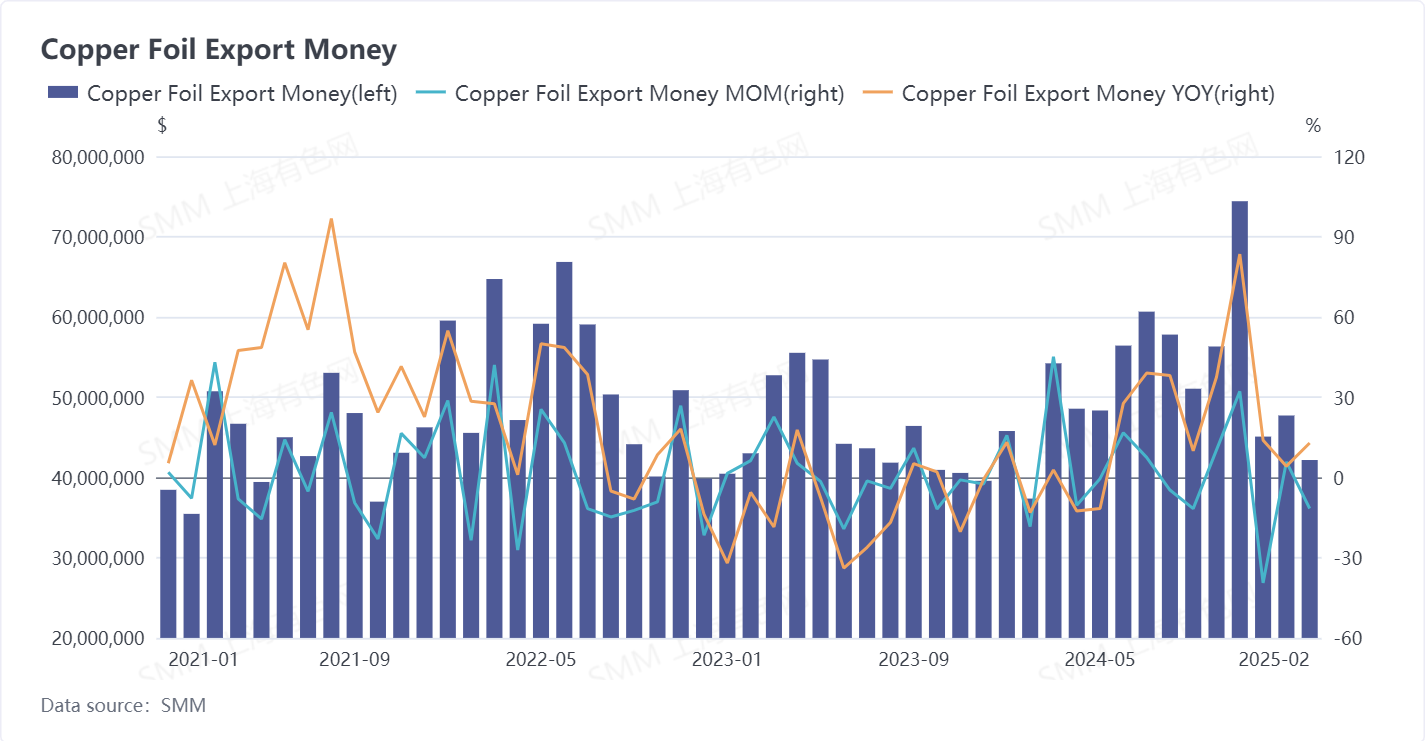
China's copper foil export value in January 2025 was $47.7158 million, up 4.22% YoY and 5.83% MoM; in February, the export value was $42.1694 million, up 12.87% YoY and down 11.62% MoM; cumulative export value for January-February 2025 was $89.8851 million, up 8.11% YoY.
In January 2025, China's trade deficit in copper foil was about $74.86 million, and in February, it was about $83.1 million, an increase of $8.24 million MoM.

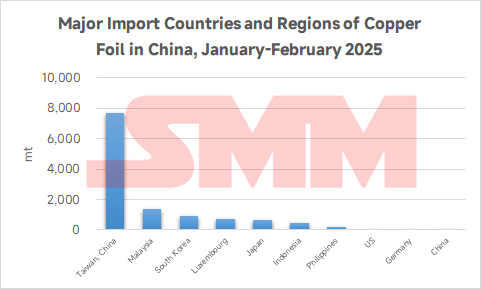
By country, the main sources of China's copper foil (excluding copper alloy foils) imports in January-February 2025 were Taiwan, China, Malaysia, and South Korea, with import volumes of 7,687.42 mt, 1,391.33 mt, and 893.67 mt, respectively.
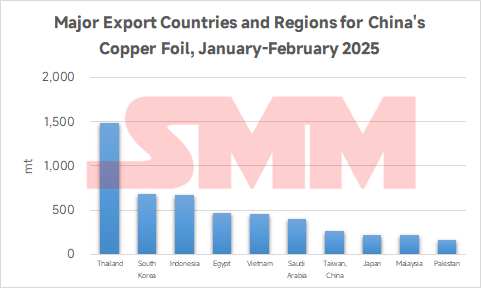
The main destinations for China's copper foil (excluding copper alloy foils) exports in January-February 2025 were Thailand, South Korea, and Indonesia, with export volumes of 1,486.97 mt, 686.8 mt, and 674.48 mt, respectively.
In January-February 2025, China's copper foil imports were at a low level in recent years. With the upgrade of domestic copper foil technology, expansion of capacity, and localisation of high-end copper foil, China's dependence on imported copper foil gradually decreased. Copper foil exports also saw a slight decline YoY. The implementation of the policy to cancel export tax rebates increased the cost of exporting copper foil, leading to competitive pressure in overseas markets due to capacity expansion, and a shift in the trade mode of exports.
Data Source Statement: Except for publicly available information, all other data are processed by SMM based on publicly available information, market communication, and relying on SMM's internal database model. They are for reference only and do not constitute decision-making recommendations.

For any inquiries or for more information, please contact: lemonzhao@smm.cn
For more information on how to access our research reports, please contact:service.en@smm.cn
Related News
KGHM and South32 launch US$725m Sierra Gorda expansion, lifting copper capacity 26%
Oct 02, 2026 16:31 (GMT+8)
KGHM and South32 launch US$725m Sierra Gorda expansion, lifting copper capacity 26%
Read More
KGHM and South32 launch US$725m Sierra Gorda expansion, lifting copper capacity 26%
KGHM and South32 have broken ground on a fourth grinding line at the Sierra Gorda copper-molybdenum mine in Chile's Atacama region. The US$725 million expansion runs for three years from January 2027, with completion by late 2029 and full output in H2 2030. Ore processing capacity rises 26%, from 131,000 tonnes per day to 165,000 tpd. Annual copper output is projected to climb from 165,000 tonnes in 2025 to 195,000 tonnes, with 6,000 tonnes of molybdenum, 58,000 ounces of gold and 1.7 million ounces of silver as by-products. The project creates over 900 direct jobs and is funded from operating cash flow and debt. Unit operating costs are expected to fall about 10%.
Oct 02, 2026 16:31 (GMT+8)
Emerita Extends Final Review of Iberian Belt West PFS, Release Expected in Coming Weeks
Oct 02, 2026 15:31 (GMT+8)
Emerita Extends Final Review of Iberian Belt West PFS, Release Expected in Coming Weeks
Read More
Emerita Extends Final Review of Iberian Belt West PFS, Release Expected in Coming Weeks
Emerita Resources has provided an update on the Preliminary Feasibility Study (PFS) for its Iberian Belt West polymetallic project in Spain, saying the study is well advanced but remains under final technical review.​ The company said the review process has been expanded to include additional technical and quality-assurance oversight before publication. As a result, Emerita now expects the PFS to be released in the coming weeks rather than within the previously indicated timeframe.​ Iberian Belt West hosts copper, zinc, lead, gold and silver mineralization and is one of Emerita’s principal development-stage assets in Spain. The PFS is expected to provide updated detail on the proposed mine plan, processing configuration, capital requirements, operating costs and project economics.​ Emerita said the additional review work is intended to ensure consistency and completeness across the technical disciplines contributing to the study before it is finalized.​ The company did not announce a revised specific publication date, and no new production, capital or economic figures were disclosed in the latest update.​ The extended review delays the next major technical milestone for Iberian Belt West, but the company continues to indicate that the PFS is nearing completion. For the copper market, the significance of the study will depend on the production profile and project economics ultimately disclosed, particularly the contribution of copper relative to the project’s other payable metals. Attention will therefore remain on the timing of the PFS release and whether the final study materially changes the project’s development outlook.
Oct 02, 2026 15:31 (GMT+8)
Cascadia Intersects 75.55 m at 1.19% Cu at Carmacks Copper-Gold Project
Oct 02, 2026 15:27 (GMT+8)
Cascadia Intersects 75.55 m at 1.19% Cu at Carmacks Copper-Gold Project
Read More
Cascadia Intersects 75.55 m at 1.19% Cu at Carmacks Copper-Gold Project
Cascadia Minerals has reported additional drill results from its 2026 exploration programme at the Carmacks copper-gold project in Yukon, Canada, with new step-out drilling extending mineralization at Zone 2000S beyond the boundaries of the existing Mineral Resource.​ Drill hole CD-26-058 returned 75.55 metres grading 1.19% copper, 0.97 g/t gold, 10.4 g/t silver and 335 ppm molybdenum, equivalent to 2.18% copper-equivalent. The interval included 48.66 metres grading 1.61% copper, 1.39 g/t gold, 15.1 g/t silver and 475 ppm molybdenum, equivalent to 3.03% CuEq.​ Within the same hole, a higher-grade interval of 14.50 metres returned 2.30% copper, 2.68 g/t gold, 29.5 g/t silver and 1,015 ppm molybdenum, equivalent to 5.08% CuEq.​ A second hole, CD-26-059, intersected 93.99 metres grading 0.96% copper, 0.70 g/t gold, 4.6 g/t silver and 919 ppm molybdenum, equivalent to 1.94% CuEq. This included 63.97 metres at 1.26% copper, 0.96 g/t gold, 6.3 g/t silver and 1,049 ppm molybdenum, equivalent to 2.52% CuEq.​ Cascadia said the latest results continue to expand mineralization at Zone 2000S beyond the limits of the current Mineral Resource and highlight the higher-grade nature of the extension. The reported drill intervals represent drilled thicknesses, with true widths estimated at approximately 60–70%.​ The latest step-out results indicate that copper-gold mineralization at Zone 2000S extends beyond the boundaries of the current Carmacks Mineral Resource. The broad intervals and higher-grade internal zones could support future resource expansion if additional drilling confirms continuity. However, the new intersections have not yet been incorporated into an updated Mineral Resource Estimate, meaning their ultimate impact on project scale and mine planning remains to be determined.
Oct 02, 2026 15:27 (GMT+8)