In May 2024, China imported a total of 531,200 mt of steel plates, down 2.51% WoW and 2.33% YoY. From January to May 2024, China imported a total of 2.5436 million mt of steel plates, down 4.69% YoY.
In May, China exported a total of 6.4962 million mt of steel plates, up 4.80% WoW and 18.67% YoY. From January to May 2024, China exported a total of 30.6324 million mt of steel, up 30.04% YoY, with significant YoY growth in the export of HRC, CRC, medium and thick plates, and strip steel.
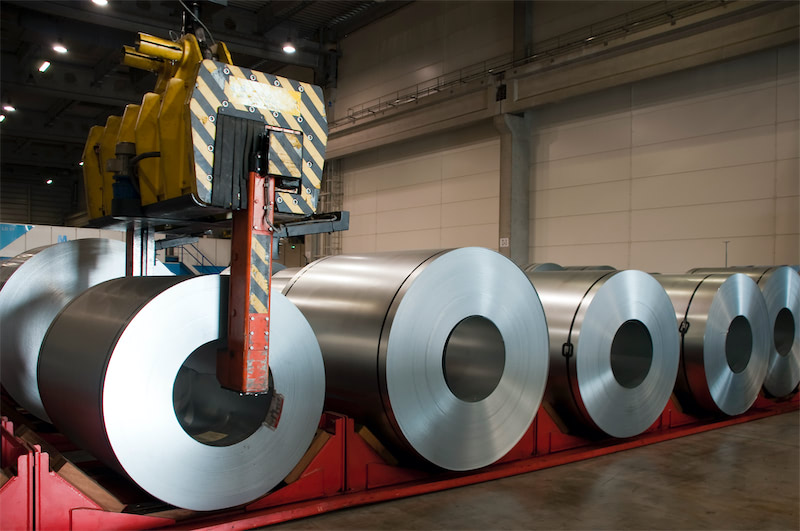
![Before the holiday, the black chain is unlikely to see a trend-driven market [SMM Steel Industry Chain Weekly Report].](https://imgqn.smm.cn/usercenter/zUFfM20251217171748.jpg)
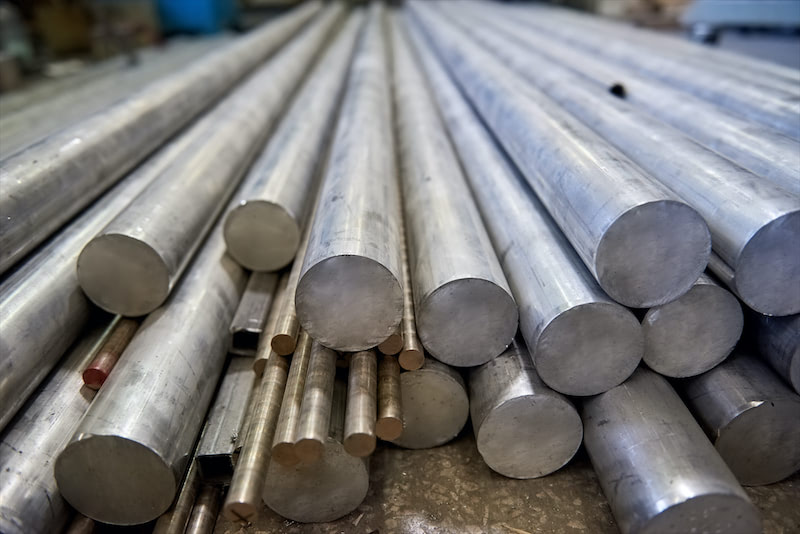
![[SMM Chromium Daily Review] Inquiries and Transactions Weakened, Chromium Market Showed Mediocre Performance Before the Holiday](https://imgqn.smm.cn/usercenter/ENDOs20251217171718.jpg)