Social Inventory of Lead Ingots Declines amid Downstream Restocking Demand

Published: Feb 3, 2023 14:58
Source: SMM
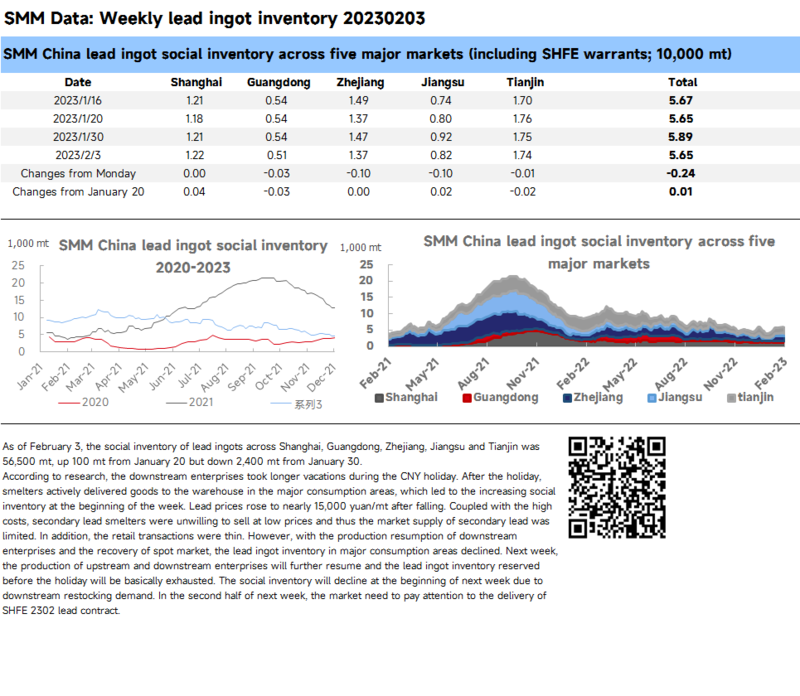
As of February 3, the social inventory of lead ingots across Shanghai, Guangdong, Zhejiang, Jiangsu and Tianjin was 56,500 mt, up 100 mt from January 20 but down 2,400 mt from January 30.

SHANGHAI, Feb 3 (SMM) - As of February 3, the social inventory of lead ingots across Shanghai, Guangdong, Zhejiang, Jiangsu and Tianjin was 56,500 mt, up 100 mt from January 20 but down 2,400 mt from January 30.

According to research, the downstream enterprises took longer vacations during the CNY holiday. After the holiday, smelters actively delivered goods to the warehouse in the major consumption areas, which led to the increasing social inventory at the beginning of the week. Lead prices rose to nearly 15,000 yuan/mt after falling. Coupled with the high costs, secondary lead smelters were unwilling to sell at low prices and thus the market supply of secondary lead was limited. In addition, the retail transactions were thin. However, with the production resumption of downstream enterprises and the recovery of spot market, the lead ingot inventory in major consumption areas declined. Next week, the production of upstream and downstream enterprises will further resume and the lead ingot inventory reserved before the holiday will be basically exhausted. The social inventory will decline at the beginning of next week due to downstream restocking demand. In the second half of next week, the market need to pay attention to the delivery of SHFE 2302 lead contract.
Data Source Statement: Except for publicly available information, all other data are processed by SMM based on publicly available information, market communication, and relying on SMM's internal database model. They are for reference only and do not constitute decision-making recommendations.

For any inquiries or for more information, please contact: lemonzhao@smm.cn
For more information on how to access our research reports, please contact:service.en@smm.cn
Related News
[SMM Flash] Sulphuric acid prices in some regions dropping below 1,000 yuan/mt
41 mins ago
[SMM Flash] Sulphuric acid prices in some regions dropping below 1,000 yuan/mt
Read More
[SMM Flash] Sulphuric acid prices in some regions dropping below 1,000 yuan/mt
[SMM Flash] Sulphuric acid prices in some regions dropping below 1,000 yuan/mt
Since 10 July, SMM Chinese sulfuric acid price index from Copper smelters has declined for 11 consecutive weeks on a weekly basis. This weekend, sulphuric acid prices were further reduced in some regions, with the ex-works price of 98% smelting acid falling below 1,000 yuan/mt. However, demand from the fertiliser industry has yet to show any clear improvement, and there are no signs that exports of sulphuric acid and phosphate fertiliser can be restarted, leaving the market dominated by a strong wait-and-see sentiment.
41 mins ago
[SMM Flash] China's Sulphuric Acid Production Data for August
58 mins ago
[SMM Flash] China's Sulphuric Acid Production Data for August
Read More
[SMM Flash] China's Sulphuric Acid Production Data for August
[SMM Flash] China's Sulphuric Acid Production Data for August
NBS data shows that China's sulphuric acid (100% equivalent) production in August was 7.984 million mt, down 308,000 mt from 7.676 million mt in July, a YoY decrease of 15.5%. The cumulative production of sulphuric acid (100% equivalent) in 2026 was 68.141 million mt, a cumulative YoY decrease of 4.6%. The top five regions by production were Yunnan province (1.1927 million mt), Anhui province (698,700 mt), Shandong province (680,600 mt), Henan province (570,200 mt), and Guangxi Zhuang Autonomous Region (568,800 mt). For detailed data, please refer to SMM Data.
58 mins ago
[SMM Analysis] China Sulphur and Sulphuric Acid Import and Export Data for August
1 hour ago
[SMM Analysis] China Sulphur and Sulphuric Acid Import and Export Data for August
Read More
[SMM Analysis] China Sulphur and Sulphuric Acid Import and Export Data for August
[SMM Analysis] China Sulphur and Sulphuric Acid Import and Export Data for August
In August 2026, China's total monthly sulphur imports were 272,323.414 mt in physical content, down 29.34% MoM and down 65.03% YoY, with the main import sources being the UAE, South Korea, Canada, Japan, Kazakhstan, Vietnam, Singapore, and the Philippines. China's total monthly sulphur exports were 48 mt in physical content, down 96.34% MoM and up 26.32% YoY, with the main export destinations being Indonesia and South Korea. China's total monthly sulphuric acid imports were 9,938.436 mt in physical content, up 831.85% MoM and up 1,051.37% YoY, with the main import sources being South Korea, Taiwan, China, Germany, and the US. China's total monthly sulphuric acid exports were 2,474.46 mt in physical content, up 153.47% MoM and down 99.43% YoY, with the main export destinations being Angola, Ghana, Cambodia, Hong Kong, China, Vietnam, Singapore, Malaysia, and Tanzania.
1 hour ago