The General Administration of Customs announced on August 7 that in the first seven months of this year, the total value of China's foreign trade imports and exports was 23.6 trillion yuan, a year-on-year increase of 10.4%. Among them, the export amount was 13.37 trillion yuan, an increase of 14.7% YoY, and the import 10.23 trillion yuan, a growth of 5.3% YoY.
The total import and export value stood at 3.81 trillion yuan in July, an increase of 16.6%. Among them, the export was 2.25 trillion yuan, an increase of 23.9%; the import was 1.56 trillion yuan, an increase of 7.4%; the trade surplus recorded 682.69 billion yuan, an increase of 90.9%. In dollar terms, China's total import and export value in July was $564.66 billion, an increase of 11%. Among them, the export was $332.96 billion, an increase of 18%; the import was $231.7 billion, an increase of 2.3%; the trade surplus totalled $101.26 billion, an increase of 81.5%.
Customs statistics show that China's foreign trade structure continued to optimise in the first seven months, with imports and exports under general trade reaching 15.17 trillion yuan, a year-on-year increase of 14.5%. China imports and exports to and from ASEAN, the European Union and the United States were 3.53 trillion yuan, 3.23 trillion yuan and 2.93 trillion yuan respectively, up 13.2%, 8.9% and 11.8% year-on-year. The ASEAN continues to be China's largest trading partner, accounting for 15% of the total foreign trade value.
According to the customs, in the first seven months of this year, the combined import and export value of Jiangsu, Zhejiang, Anhui and Shanghai in the Yangtze River Delta region was 8.58 trillion yuan. The value recorded a year-on-year increase of 11.7%, 2.5 percentage points faster than the growth rate in the first half of the year.
Export:
In July, China exported 3,637.1 mt of rare earths, a decrease of 14.73% from June and a decrease of 8.04% from July last year. The cumulative export from January to July was 29,865.9 mt, an increase of 7.5% from January to July last year.
In July, China exported 6.671 million mt of steel, down 11.72% from June and an increase of 17.65% year-on-year. The cumulative export from January to July was 40.073 million mt, down 6.87% from January to July last year.
In July, China exported 652,200 mt of unwrought aluminium and aluminium products, a month-on-month increase of 7.38% and a year-on-year increase of 39.06%. The cumulative exports stood at 4.1606 million mt from January to July, an increase of 34.87% from January to July last year.
Import:
In July, China imported 91.244 million mt of iron ore and concentrates, an increase of 2.56% from June and an increase of 3.09% from July last year. A total of 626.823 million mt of iron ore and concentrated were imported from January to July, a decrease of 3.4% from January to July last year.
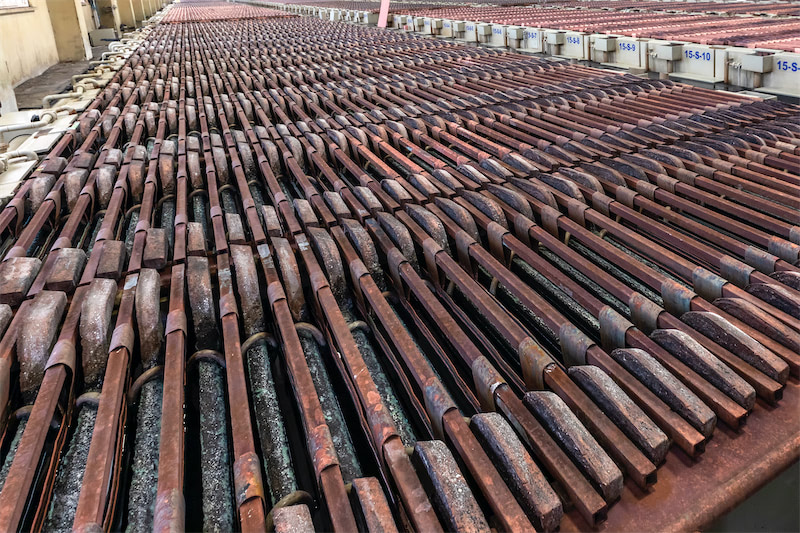
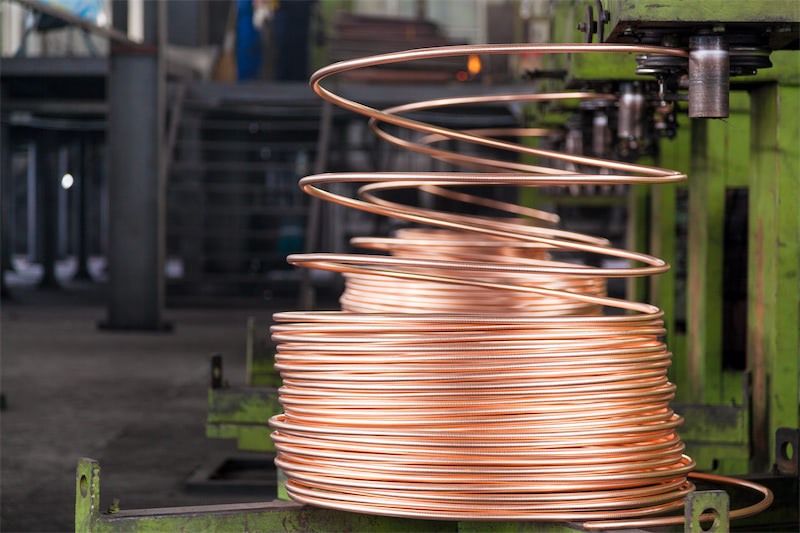
In July, China imported 1.899 million mt of copper ore and concentrate, down 7.82% from June and an increase of 0.48% year-on-year. The cumulative import from January to July was 14.368 million mt, up 7.4% from January to July last year.
In July, China imported 23.523 million mt of coal and lignite, a month-on-month increase of 23.92% and a year-on-year decrease of 22.06%. The cumulative imports from January to July were 138.522 million mt, a year-on-year decrease of 18.2% from January to July last year.
In July, China imported 9,351.4 mt of rare earths, a decrease of 10.89% from June. The cumulative imports from January to July were 69,492.1 mt, a drop of 8% from January to July last year.
In July, China imported 0.789 million mt of steel, down 0.25% from June and a drop of 24.86% year-on-year. The cumulative imports from January to July was 6.559 million mt, down 21.9% from January to July last year.
In July, China imported 463,700 mt of unwrought copper and copper semis, a month-on-month drop of 13.76% and a year-on-year increase of 9.29%. The cumulative imports stood at 3.4053 million mt from January to July, an increase of 5.8% from January to July last year.
![Copper Inventories in Major Regions of China Continued Destocking During the Week [SMM Weekly Data]](https://imgqn.smm.cn/usercenter/gCNEi20251217171715.jpeg)