SHANGHAI, Jul 29 (SMM) -
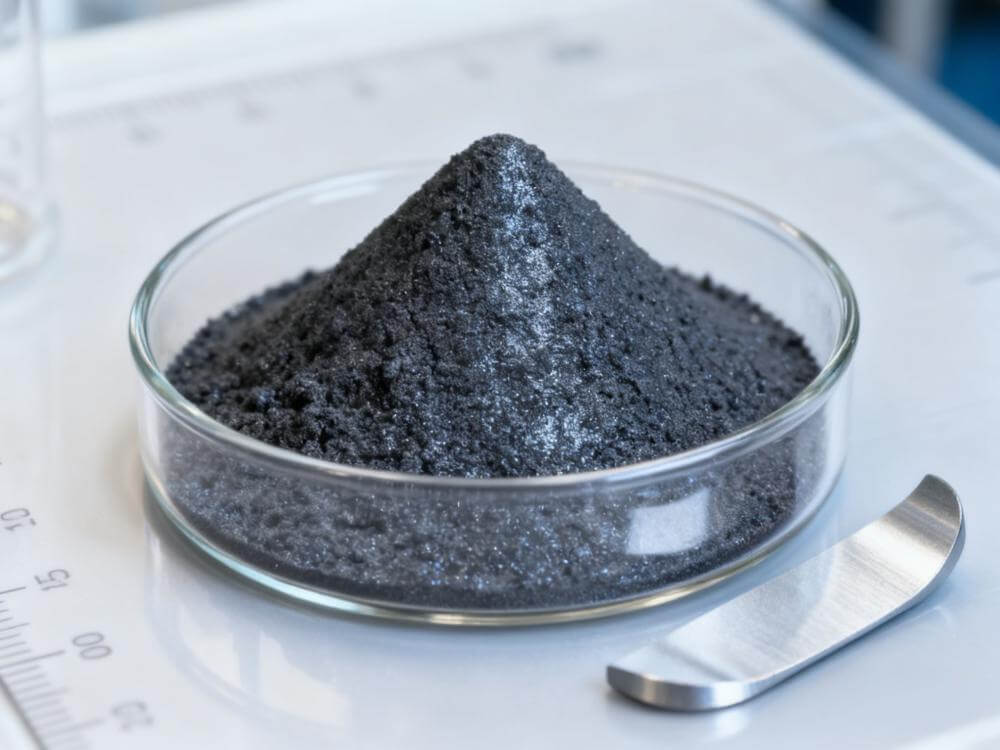
Polysilicon: Polysilicon prices were flat compared with last week, with prices of recharging polysilicon moving between 292-310 yuan/kg. The mainstream transaction prices dense polysilicon stood at 289-308 yuan/kg, flat week-on-week. Big orders for early August have already been placed two week ago when the market players scrambled for polysilicon, hence the transactions were muted as a whole this week, keeping the prices stable. In addition, retail sales were hindered by rising polysilicon prices earlier. And with the absence of large orders, the retail sales market became even quieter. Nonetheless, polysilicon is still still in short supply, which remains the problem of stranglehold. Polysilicon prices are likely to rise in the near future.
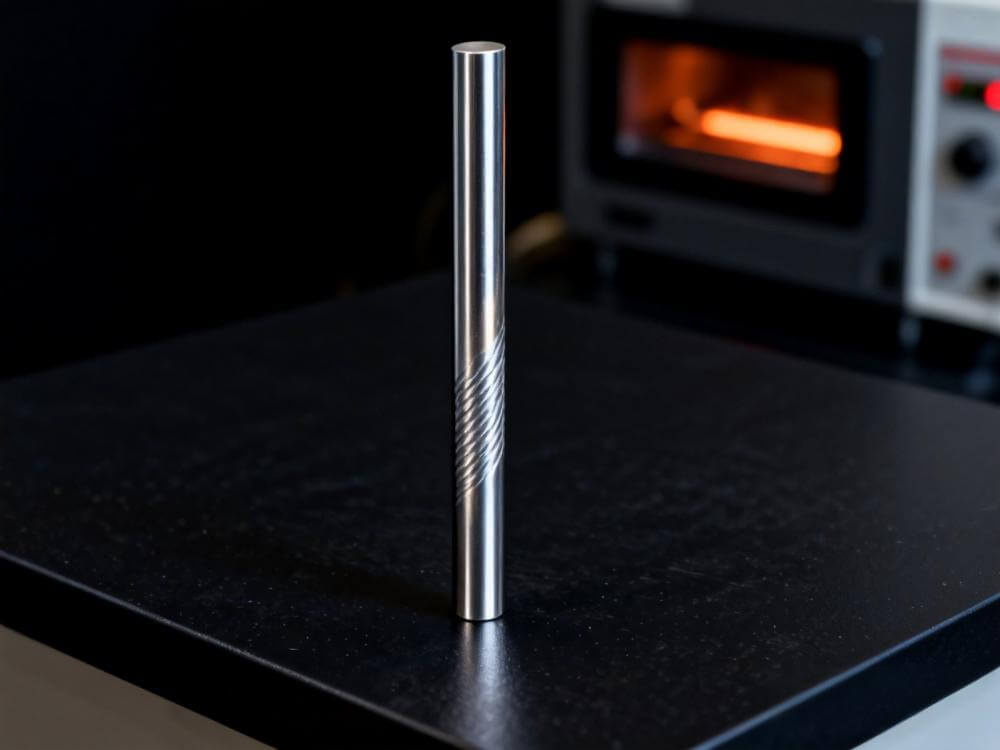
Silicon wafer: Silicon wafers prices continued to rise this week under the support of costs. The mainstream transaction prices of monocrystalline silicon wafer M10 stood at 7.38-7.54 yuan/piece, an increase of 0.12 yuan/piece compared with last week. The prices of monocrystalline silicon wafer G12 were 9.60-9.65 yuan/piece, up 0.19 yuan/piece week-on-week. Earlier this week, many leading silicon wafer companies such as Zhonghuan successively raised their silicon wafer prices, and the current round of wafer price hike officially kicked off. The price hike is mainly due to the continuous rise in polysilicon prices, which offered some cost support. On the other hand, the insufficient supply of polysilicon has contained the operating rates of silicon wafer companies, leading to the supply and demand imbalance.
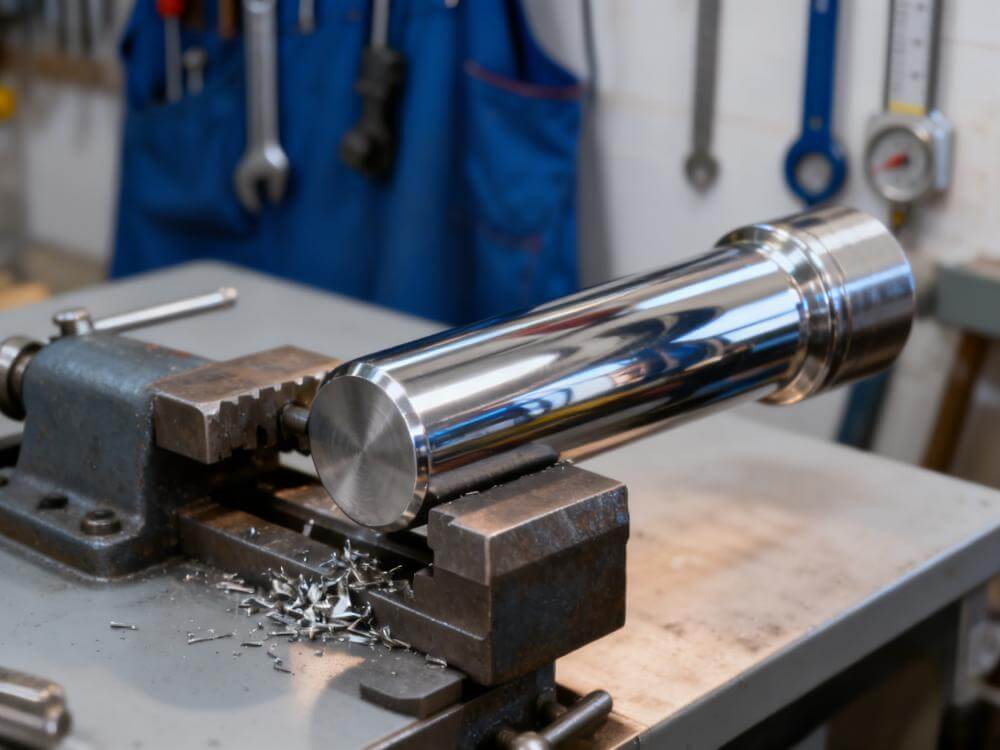
Cells: The cell prices continued to rise this week due to the impact of heightening upstream costs. The price of M10 mono PERC cells stabilised at 1.26-1.3 yuan/watt, and that of G12 mono PERC cells was 1.23-1.28 yuan/watt. Rising silicon wafer prices have put more pressure on the cost of cells. As Tongwei took the lead in raising the price of its battery cells, a number companies followed suit. Although the prices of battery cells rose as a whole, module companies boycotted such price hike and were strongly wait-and-see. The follow-up order performance of some second and third-tier cell companies are not optimistic, and it is expected that cell price growth may be limited next week.
Modules: The prices of modules climbed further due to the increasing pressure from the cost side. The mainstream transaction prices of single-sided-182mm mono-Si PERC modules was 1.91-2.07 yuan/watt, and that of 210mm Mono-Si PERC modules was 1.92-2.05 yuan/watt. Although the quotations of module manufacturers inflated, the market was in a stalemate amid the tug-of-war between module manufacturers and terminal enterprises. Many terminal power station projects have been suspended in response to the rising module prices. Meanwhile, due to the double impact of rising cost pressure and reduced demand, many second and third-tier module companies have halted the production. SMM believes that the reducing operating rates of terminal and module companies may affect the upstream market to a certain extent.
Photovoltaic glass: The prices of photovoltaic glass were stable this week, with smooth market transactions. As August is approaching, the market players are increasingly wait-and-see. Glass manufacturers insist setting the prices after downstream module factories finalise their production scheduling, and the buyer-seller game is intensive. In the short term, the demand from downstream module factories is moderate, and the PV glass prices will remain stable amid few changes on the production and supply side.