SMM7: on the morning of July 27, the National Bureau of Statistics showed that in the first half of the year, the total profits of industrial enterprises above the national scale totaled 3.38821 trillion yuan, an increase of 17.2 percent over the same period last year, an increase of 0.7 percentage points over the January-May period. The total profit realized by the mining industry was 285.39 billion yuan, up 47.9 percent over the same period last year, and the total profit realized by the manufacturing industry was 2.88005 trillion yuan, up 14.3 percent. The electricity, heat, gas and water production and supply industries realized a total profit of 222.77 billion yuan, an increase of 25.3 percent.
From January to June, among the industrial enterprises above the scale, the state-owned holding enterprises realized a total profit of 1.02487 trillion yuan, up 31.5 percent over the same period last year, and the collective enterprises realized a total profit of 10.97 billion yuan, an increase of 4.6 percent. The profits of joint-stock enterprises totaled 2.40599 trillion yuan, up 21 percent; those invested by foreign businessmen and Hong Kong, Macao and Taiwan enterprises totaled 819.76 billion yuan, up 8.7 percent; and those of private enterprises totaled 888.91 billion yuan, up 10 percent.
From January to June, the total profit of the mining industry was 285.39 billion yuan, up 47.9 percent over the same period last year, and the total profit of the manufacturing industry was 2.88005 trillion yuan, up 14.3 percent. The electricity, heat, gas and water production and supply industries realized a total profit of 222.77 billion yuan, an increase of 25.3 percent.
From January to June, total profits in 29 of the 41 major industrial sectors increased compared with the same period last year, while 1 industry was flat and 11 industries decreased. The profits of the main industries are as follows: the total profits of the coal mining and washing industry increased by 18.4 percent over the same period last year, the oil and gas mining industry increased 3.1 times, and the agricultural and non-staple food processing industry increased by 2.2 percent. The oil, coal and other fuel processing industries increased by 34.3 percent, the chemical raw materials and chemical products manufacturing industry by 29.4 percent, the non-metallic mineral products industry by 44.1 percent, and the ferrous metal smelting and calender processing industry by 1.1 times. The general equipment manufacturing industry increased by 7.3 percent, the special equipment manufacturing industry by 19.4 percent, the automobile manufacturing industry by 4.9 percent, the electrical machinery and equipment manufacturing industry by 2.3 percent, and the electricity, thermal production and supply industry by 27.4 percent. The textile industry declined by 1.1 per cent, the non-ferrous metal smelting and calender processing industry by 8.3 per cent and the computer, communications and other electronic equipment manufacturing industry by 2.3 per cent.
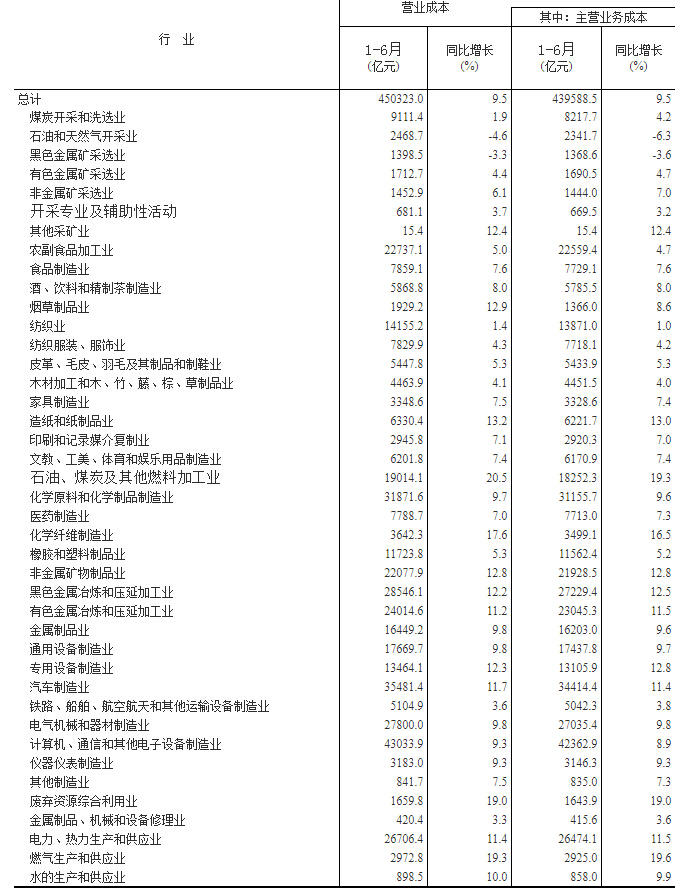
From January to June, the main business income of industrial enterprises above the scale was 52.1 trillion yuan, an increase of 9.9 percent over the same period last year, and the cost of the main business was 44 trillion yuan, an increase of 9.5 percent. The profit margin of the main business income was 6.51%, an increase of 0.41 percentage points over the same period last year.
At the end of June, the assets of industrial enterprises above the scale totaled 109.4 trillion yuan, up 7.4 percent over the same period last year, the total debt was 61.9 trillion yuan, up 6.6 percent, and the owner's equity totaled 47.5 trillion yuan, up 8.6 percent. The asset-liability ratio was 56.6%, down 0.4 percentage points from a year earlier.
At the end of June, the accounts receivable of industrial enterprises above the scale were 13.7 trillion yuan, up 11.7 percent over the same period last year, and the inventory of finished products was 4.11876 trillion yuan, up 8.3 percent.
From January to June, the cost per 100 yuan of main business income of industrial enterprises above the scale was 84.42 yuan, down 0.37 yuan from the same period last year, and the cost per 100 yuan of main business income was 8.15 yuan, down 0.03 yuan from the same period last year. The main business income per 100 yuan of assets was 96.8 yuan, an increase of 2.2 yuan over the same period last year, the per capita main business income was 1.28 million yuan, an increase of 142000 yuan over the same period last year, and the number of days of inventory turnover of finished products was 16.4 days, a decrease of 0.1 days over the same period last year. The average payback period for accounts receivable was 45.5 days, an increase of 0.4 days over the same period last year.
In June, the profits of industrial enterprises above the scale totaled 658.29 billion yuan, up 20 percent from the same period last year, and the growth rate was 1.1 percentage points lower than that in May.
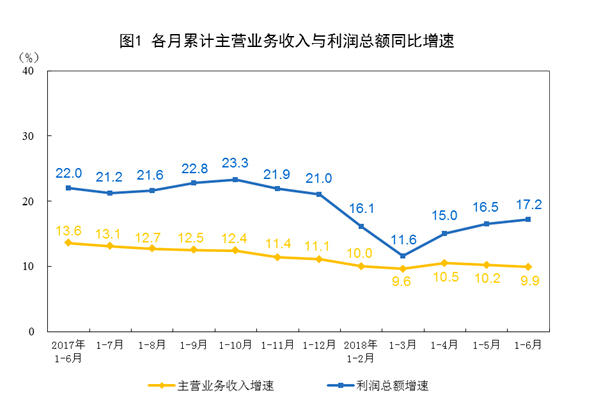
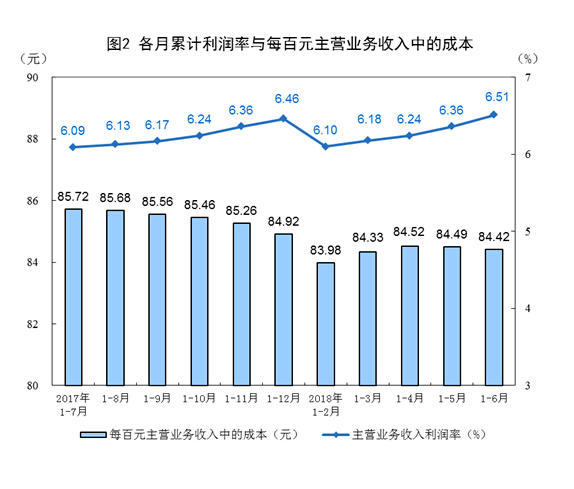
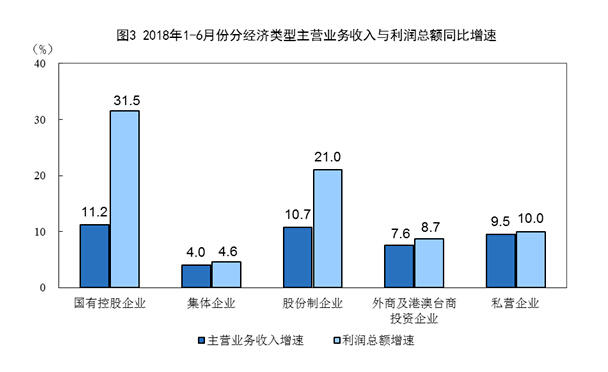
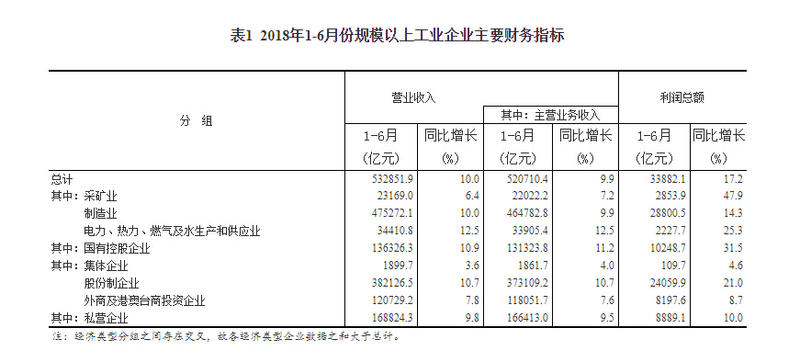
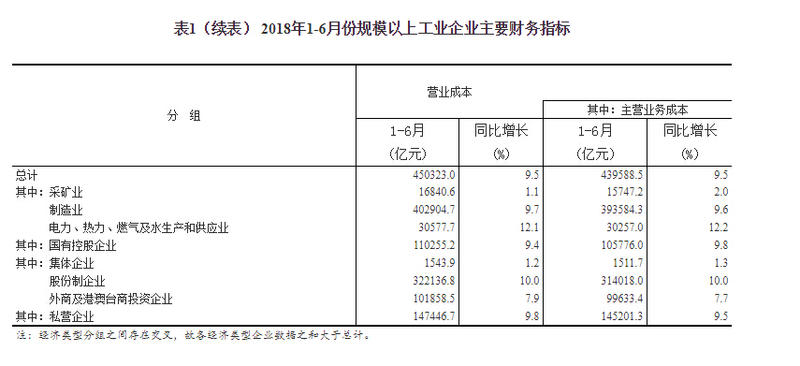
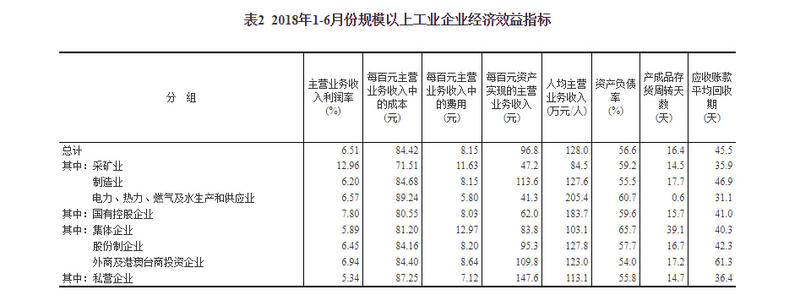
Table 3 main financial indicators for industrial enterprises above size, January-June 2018 (by sector)
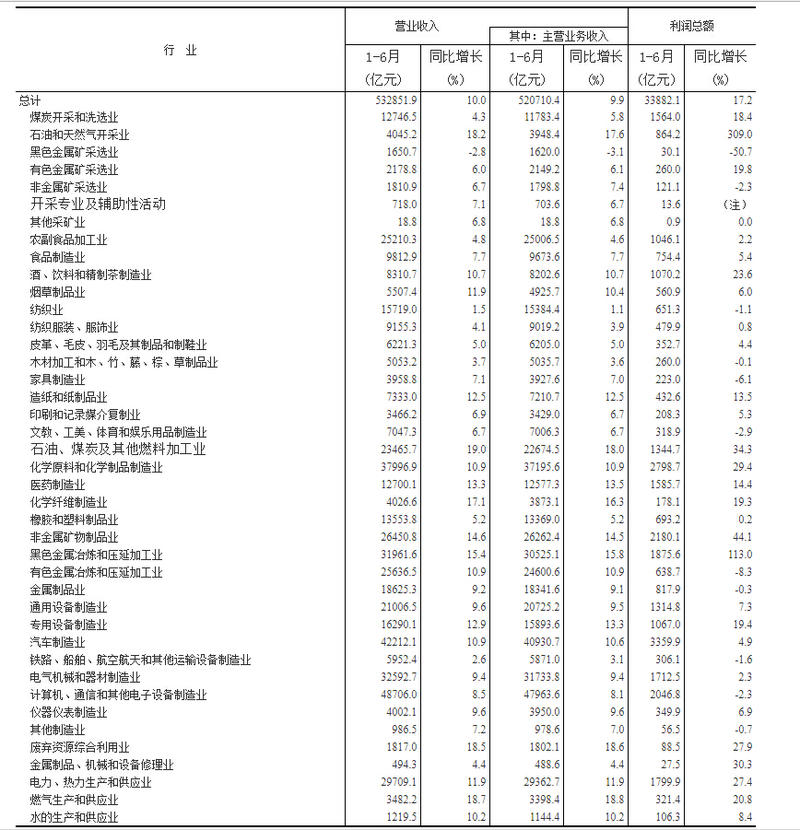
Table 3 (continued) main financial indicators for industrial enterprises above size, January-June 2018 (by sector)
Note:
I. interpretation of indicators and related notes
1. total profit: refers to the surplus after deducting all kinds of expenses from all kinds of income in the process of production and operation, which reflects the total profit and loss realized by the enterprise during the reporting period.
2. operating income: refers to the total income recognized by the enterprise in its main business and other businesses.
3. main business income: refers to the total income obtained by the enterprise from operating the main business.
4. operating cost: refers to the total cost incurred by the enterprise in carrying on the main business and other business.
5. main business cost: refers to the total cost incurred by the enterprise in operating the main business.
6. total assets: resources formed by past transactions or events of the enterprise, owned or controlled by the enterprise and expected to bring economic benefits to the enterprise.
7. total liabilities: refers to the formation of past transactions or events of the enterprise, which is expected to lead to the outflow of economic interests out of the current obligations of the enterprise.
8. total owner's equity: refers to the residual equity enjoyed by the owner after deducting liabilities from the assets of the enterprise.
9. accounts receivable: refers to the creditor's rights formed by the enterprise's business activities such as the sale of goods and the provision of services, including the payment of goods, value-added taxes and freight and miscellaneous expenses that should be collected from customers.
10. finished product inventory: refers to the finished products that have been processed and completed by the enterprise at the end of the reporting period and can be sold to the outside world.
11. profit margin of main business income = total profit / main business income × 100%, unit:%.
12. cost per 100 yuan of main business income = main business cost / main business income × 100, unit: yuan.
13. cost per 100 yuan of main business income = (sales cost + management cost + financial cost) / main business income × 100 yuan, unit: yuan.
14. the main business income realized per 100 yuan of assets = the main business income / average assets / cumulative months × 12 × 100, unit: yuan.
15. per capita main business income = main business income / average number of employees / cumulative months × 12, unit: 10,000 yuan / person.
16. asset-liability ratio = total liabilities / total assets x 100%, in%.
17. finished product inventory turnover days = 360 × average finished product inventory / main business cost × cumulative months / 12, unit: days.
18. average payback period of accounts receivable = 360 × average accounts receivable / main business income × cumulative months / 12, unit: days.
19. in the column of total profit growth in each statement, the "note" indicates that the total profit in the same period of last year was negative, that is, a loss, and that the value was positive indicating the increase in profit compared with the same period last year; A value of between 0 and-100 per cent (excluding 0) indicates a year-on-year decline in profits; a decline of more than 100 per cent indicates a shift from a profit in the same period last year to a current loss; and a value of 0 indicates that profits are flat from a year earlier.
2. the growth rate of the total profits and main business income of industrial enterprises above the scale shall be calculated according to a comparable caliber. There are incomparable factors between the data for the reporting period and the same indicators published in the previous year, and the calculated growth rate cannot be directly compared. The main reasons are as follows: (1) according to the statistical system, the scope of the survey of industrial enterprises above the scale is adjusted regularly every year. Every year, some enterprises reach the scale standard to be included in the scope of the survey, and some enterprises withdraw from the scope of the investigation because of their smaller size. there are also changes in newly built and put into production enterprises, bankruptcy, injection (hanging) sales enterprises, and so on. (2) strengthening statistical law enforcement, cleaning up enterprises found in the statistical law enforcement inspection that do not meet the requirements of industrial statistics above the scale, and revising the relevant base figure in accordance with the rules and regulations. (3) strengthen the management of data quality and eliminate duplication of statistical data across regions and industries. According to the latest survey of the organizational structure of enterprises carried out by the National Bureau of Statistics, double counting of enterprise groups (companies) across regions and industries has been carried out since the fourth quarter of last year. (4) after the implementation of the "camp to increase" policy, service enterprises have changed to value-added tax and the tax rate is relatively low. industrial enterprises have gradually spun off their internal non-industrial production and operation activities and turned to the service industry, thus reducing the financial data of industrial enterprises.
III. scope of statistics
Industrial enterprises above the scale, that is, industrial legal person units with annual main business income of 20 million yuan or more.
IV. methods of investigation
Financial statements of industrial enterprises above the size of the monthly comprehensive survey (January data exempted).
V. Industry classification standards
Implement the National Economic Industry Classification Standard (GB/T4754-2017), see http://www.stats.gov.cn/tjsj/tjbz/hyflbz/.
![Platinum Prices Fluctuated Within a Range, While Spot Premiums Remained Stable and Transactions Were Normal [SMM Daily Review]](https://imgqn.smm.cn/usercenter/gePcx20251217171735.jpg)
![Silver Prices Continued Their Downtrend, Suppliers Held Back on Selling and Waited to See, While Sluggish Market Transactions Remained Unchanged [SMM Daily Review]](https://imgqn.smm.cn/usercenter/yhuhG20251217171735.jpg)