Money Metals News Service April 25th, 2017
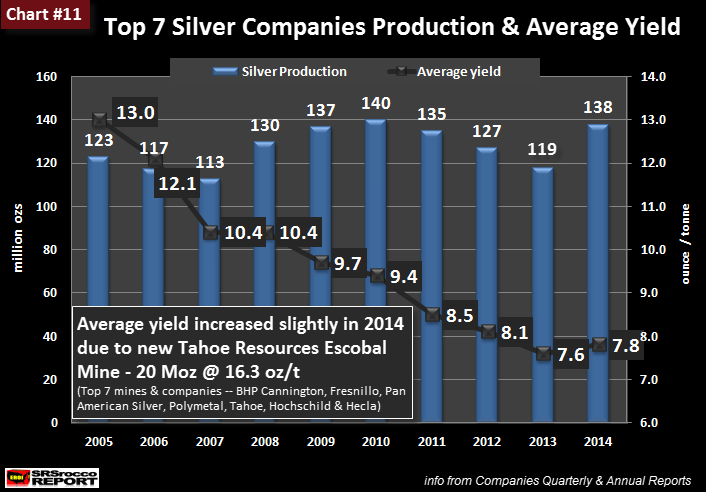
After the Primary Silver Mining Industry enjoyed a brief increase in productivity over the past two years, it fell to the lowest ever in 2016. The reason the primary silver mining industry’saverage yield increased in 2014 was due to the addition of Tahoe Resources high-grade Escobal Silver Mine.
Tahoe’s Escobal Silver Mine’s average yield in 2014 was an astonishing 16.3 ounce per ton (oz/t). Not only did Escobal Mine enjoy one the highest silver yields in the world, it produced over 20 million oz (Moz) in 2014. Thus, the addition of Tahoe to the Top Silver Miners pushed their average yield to 7.8 oz/t in 2014 versus 7.6 oz/t in 2013:
This Chart #11 was one of 48 Silver Charts in my THE SILVER CHART REPORT. If you have not yet looked at this report, I highly recommend it for those who are interested in the silver market and industry. THE SILVER CHART REPORT provides information and analysis on the silver market and industry not found found in any other single report on the internet.
The Silver Chart Report is a a collection of my top silver charts from articles published over the past six years, and includes in-depth, never-before-seen charts and content that indicate that silver is on the rise. There are 48 charts in the report, broken down in five sections:
Silver Production
Mining & Falling Ore Grades
Official Silver Coin Sales
Silver Price
The Silver Market
The charts in these five sections give the investor a broad background of the silver industry and market. Silver will likely be one of the most sought-after physical assets in the future. Why? There are several factors that will impact its price (value) in the future, and they are explained thoroughly in The Silver Chart Report.
Now, what is very interesting about adding Tahoe’s Escobal super high-grade mine to the group, it didn’t move the average yield up that much... only 0.2 0z/t to 7.8 oz/t.
I didn’t update this chart for 2015. However, I have now added the data for 2015 and 2016. As we can see in the updated chart below, the group’s silver production has increased over the past two years from 138 Moz in 2014 to 158 Moz last year. The majority of this increase was due to the ramp up of Fresnillo LLC’s Saucito Mine:
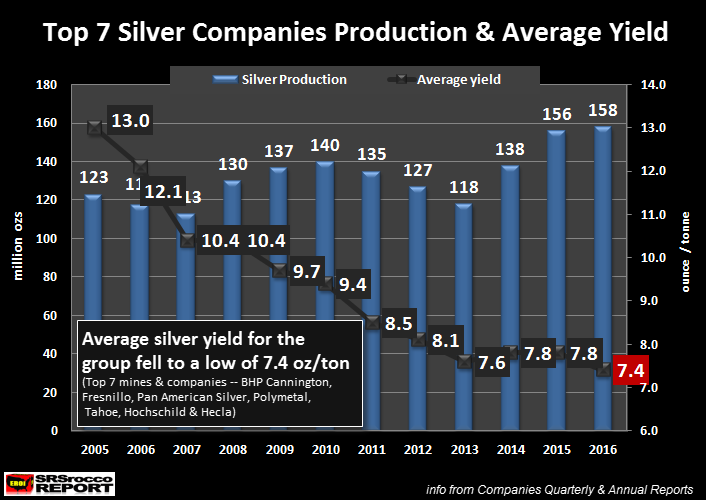
Even though the top 7 Primary Silver Mining Companies increased their production to 158 Moz in 2016, the amount of ore they processed also reached a record high. For example, these silver mining companies processed a record 21.3 million tons of ore in 2016 compared to 19.9 million tons in 2015. Furthermore, the top silver miners only processed 9.4 million tons of ore in 2005 to produce 123 Moz of silver… yielding 13 oz/t.
The falling average yield in the silver mining industry seems to be overlooked by the majority of analysts. As we can see in the chart above, the primary silver miner’s average yield has fallen from 13 oz/t in 2005 to 7.4 oz/t in 2016. This is a 43% decline in just 12 years.
Lastly, Tahoe Escobal Mine’s average silver yield will continue to fall over the next ten years. Thus, the global silver mining industry will continue to process more ore to produce the same or less silver in the future. While the cost of energy has declined over the past few years, falling ore grades will continue to put pressure on the silver mining industry going forward.
![This Week, Platinum and Palladium Experienced Significant Pullbacks, End-Use Demand Recovered, and Spot Market Trading Was Normal [SMM Platinum and Palladium Weekly Review]](https://imgqn.smm.cn/usercenter/obeMy20251217171735.jpg)
![Silver Prices Continue to Pull Back, Suppliers Remain Reluctant to Sell, Spot Market Premiums Hard to Decline [SMM Daily Review]](https://imgqn.smm.cn/usercenter/LVqfJ20251217171736.jpg)