[Ag Im&Ex] Slump in Silver bar imports extends to June

Publicado: Jul 22, 2015 10:08
The silver bar imports by India dropped sharply during the month of June this year.

By  Paul Ploumis 21 Jul 2015  Last updated at  07:48:07 GMT

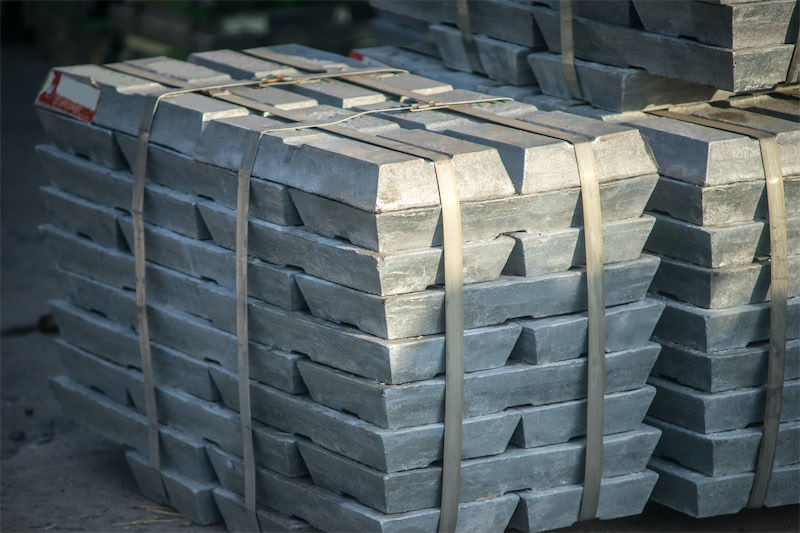
MUMBAI (Scrap Monster): The latest statistics released by the Gems and Jewellery Export Promotion Council (GJEPC) indicates considerable drop in Silver bar imports by the country during the month of June this year. The country’s Silver bar imports during the month plunged sharply by nearly 23% upon comparison with the imports during the same month the year before. This is in accordance with the latest trade data published by the apex trade body.

The GJEPC data indicates that the total Silver bar imports by the country in June 2015 amounted to INR 10.72 crores (USD 1.68 Million). In rupee terms, the Silver bar imports have dropped by 22.49%. The fall in dollar terms stood at 27.6%. It must be noted that the country’s Silver bar imports during June 2014 had totaled INR 13.83 crores (USD 2.32 Million).

The cumulative silver bar imports during the initial quarter of the current fiscal year totaled INR 51.41 crores (USD 8.14 Million), considerably higher when compared with the imports of INR 43.23 crores (USD 7.24 Million) during April-June ‘14.

However, silver bar imports by the country in June this year rose sharply when compared with the previous month. The imports were up by nearly 35% over the previous month. The country’s Silver bar imports had totaled INR 7.97 crores (USD 1.25 Million) during May 2015.

According to GJEPC, the Silver jewellery imports by the country during June this year witnessed huge decline when matched with the previous year. The country’s Silver jewellery imports during the month totaled INR 16.15 crores (USD 2.53 Million). During same month a year before, the country had imported Silver jewellery worth INR 43.90 crores (USD 7.35 Million).

The GJEPC, set up by the by the Ministry of Commerce, Government of India in 1966 is the apex body of the gems & jewellery industry. Headquartered in Mumbai, the industry body represents almost 6,000 exporters in the sector.
 

Declaración de Fuente de Datos: Excepto la información disponible públicamente, todos los demás datos son procesados por SMM basándose en información pública, comunicación de mercado y confiando en el modelo de base de datos interna de SMM. Son solo para referencia y no constituyen recomendaciones para la toma de decisiones.

Para cualquier consulta o para obtener más información, por favor contacte: lemonzhao@smm.cn
Para más información sobre cómo acceder a nuestros informes de investigación, contacte con:service.en@smm.cn
Noticias relacionadas
SHFE: El volumen de warrants de aleación de aluminio fundido sube 430 toneladas a 23.534 toneladas el 14 de septiembre
hace 3 horas
SHFE: El volumen de warrants de aleación de aluminio fundido sube 430 toneladas a 23.534 toneladas el 14 de septiembre
Leer más
SHFE: El volumen de warrants de aleación de aluminio fundido sube 430 toneladas a 23.534 toneladas el 14 de septiembre
[SMM Flash] Los datos de la SHFE muestran que, el 14 de septiembre, el volumen total de warrants registrados de aleación de aluminio fundido fue de 23.534 tm, un aumento de 430 tm respecto al día de negociación anterior. En concreto, el volumen total registrado en Shanghái fue de 1.625 tm, sin cambios respecto al día anterior; en Guangdong, fue de 1.403 tm, una disminución de 59 tm; en Jiangsu, fue de 8.150 tm, un aumento de 941 tm; en Zhejiang, fue de 10.012 tm, una disminución de 362 tm; en Chongqing, fue de 2.165 tm, sin cambios; y en Sichuan, fue de 179 tm, una disminución de 90 tm.
hace 3 horas
Datos: Movimiento del mercado SHFE, DCE (14 de septiembre)
hace 4 horas
Datos: Movimiento del mercado SHFE, DCE (14 de septiembre)
Leer más
Datos: Movimiento del mercado SHFE, DCE (14 de septiembre)
La siguiente tabla muestra el movimiento de metales ferrosos y no ferrosos en la SHFE y la DCE el 14 de septiembre de 2026.
hace 4 horas
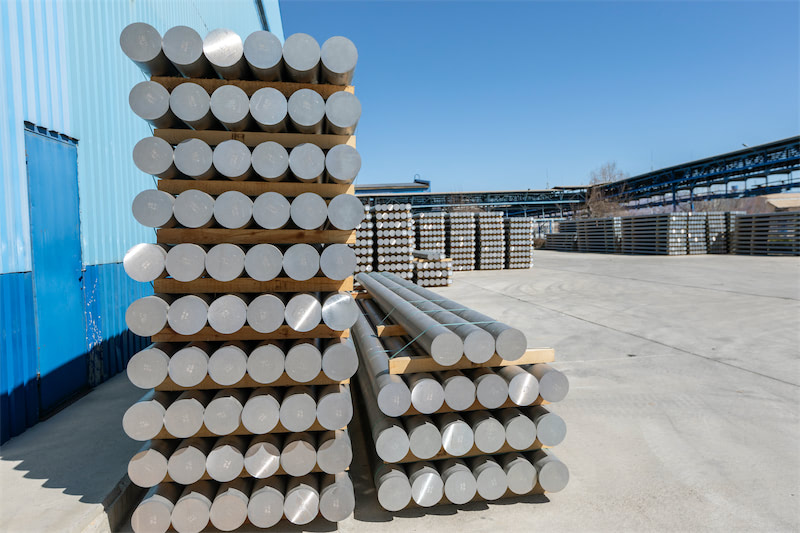
Los envíos salientes de palanquilla de aluminio aumentan a 38.900 toneladas en la semana del 7 al 13 de septiembre
hace 4 horas
Los envíos salientes de palanquilla de aluminio aumentan a 38.900 toneladas en la semana del 7 al 13 de septiembre
Leer más
Los envíos salientes de palanquilla de aluminio aumentan a 38.900 toneladas en la semana del 7 al 13 de septiembre
【Estadísticas semanales de SMM sobre envíos salientes de palanquilla de aluminio】Según las estadísticas de SMM, durante el 7–13 de septiembre, los envíos salientes nacionales de palanquilla de aluminio totalizaron 38.900 toneladas, un aumento de 2.800 toneladas con respecto a la semana anterior.
hace 4 horas