SHANGHAI,April.22 (SMM) - The General Administration of Customs on ,April.2 released China's imports and exports of primary aluminum,alumina,aluminum semis and bauxite in March 2015 (unit: mt):
| Mar. | YoY (%) | Jan.– Mar. | YoY (%) | |
| Imports: | ||||
| Primary Aluminum | 10,631 | -74.21 | 22,454 | -85.35 |
| Origins | ||||
| India | 2,687 | 37.82 | 6,597 | -65.40 |
| Australia | 2,405 | -76.23 | 7,379 | -84.34 |
| Oman | 2,280 | -62.93 | 3,989 | -76.27 |
| New Zealand | 2,003 | - | 2,003 | - |
| The United Arab Emirates | 847 | 187.66 | 1,057 | -52.01 |
| Russia | 200 | -97.01 | 724 | -97.52 |
| North Korea | 88 | -81.01 | 270 | -73.45 |
| Saudi Arabia | 41 | -99.17 | 41 | -99.17 |
| Germany | 36 | 14.47 | 96 | 19.10 |
| Hong Kong | 22 | -67.74 | 44 | -60.59 |
| Japan | 12 | 96.87 | 40 | 221.14 |
| the Republic of Kyrgyzstan | 6 | - | 6 | - |
| South Korea | 2 | - | 5 | -73.78 |
| The US | 0 | 3,100.00 | 1 | 3.94 |
| Brazil | - | - | 100 | - |
| South Africa | - | -100.00 | 100 | -99.21 |
| aluminum alloy | 3,553 | -43.75 | 11,951 | -46.35 |
| Origins | ||||
| Taiwan (China) | 909 | -53.00 | 3,075 | -41.93 |
| China | 616 | 61.45 | 1,229 | 43.50 |
| The United Arab Emirates | 437 | -77.55 | 3,148 | -45.73 |
| Germany | 403 | 3,976.72 | 546 | 28.23 |
| Japan | 335 | 25.75 | 765 | -10.79 |
| South Korea | 203 | -48.45 | 697 | -21.83 |
| Russia | 190 | -11.62 | 813 | 89.63 |
| Malaysia | 151 | -75.57 | 497 | -74.60 |
| North Korea | 130 | - | 201 | 163.02 |
| Australia | 127 | 206.19 | 304 | -67.28 |
| The US | 24 | -67.82 | 150 | -78.87 |
| Kazakhstan | 13 | -13.18 | 46 | 11.34 |
| The UK | 9 | -49.90 | 9 | -82.68 |
| France | 5 | 50.63 | 5 | -47.39 |
| South Africa | 2 | - | 2 | -99.09 |
| Ecuador | - | - | 2 | -91.35 |
| Nigeria | - | -100.00 | 277 | -67.32 |
| The Arab Republic of Egypt | - | -100.00 | 48 | -54.77 |
| Vietnam | - | - | 96 | -20.29 |
| Holland | - | -100.00 | 1 | -99.34 |
| Thailand | - | - | 40 | 100.36 |
| scrap aluminum | 170,474 | -13.97 | 472,759 | -16.51 |
| Origins | ||||
| The US | 47,738 | -26.52 | 134,248 | -30.14 |
| Australia | 33,548 | 50.44 | 87,012 | 43.74 |
| Hong Kong | 25,914 | -18.56 | 68,288 | -19.12 |
| Malaysia | 15,843 | -45.05 | 40,935 | -53.64 |
| France | 12,473 | 531.41 | 30,263 | 325.53 |
| The UK | 8,168 | -17.12 | 25,434 | 6.10 |
| Canada | 5,528 | 7.71 | 12,827 | 4.69 |
| Holland | 4,331 | -20.00 | 14,645 | 5.87 |
| Belgium | 3,045 | -18.86 | 11,256 | 24.80 |
| Germany | 2,673 | -75.67 | 9,803 | -70.15 |
| The Philippines | 1,666 | 253.24 | 7,271 | 1,441.28 |
| Norway | 1,038 | 907.94 | 2,220 | 24.88 |
| Italy | 1,015 | 126.78 | 3,625 | 33.71 |
| Spain | 973 | 52.69 | 2,899 | -20.13 |
| Japan | 972 | -68.19 | 2,713 | -51.88 |
| Sweden | 921 | 12.82 | 2,709 | 27.44 |
| Macao | 686 | 246.04 | 3,472 | 100.23 |
| Colombia | 542 | -42.32 | 1,611 | -36.79 |
| Denmark | 511 | 245.06 | 1,632 | 65.78 |
| Mexico | 354 | -9.84 | 707 | -56.03 |
| Ecuador | 335 | 125.61 | 397 | 9.95 |
| South Korea | 308 | -37.34 | 973 | -49.74 |
| New Zealand | 280 | -29.94 | 992 | 7.42 |
| Chile | 279 | 72.45 | 513 | 49.14 |
| Taiwan (China) | 218 | -68.15 | 1,008 | -22.41 |
| Peru | 153 | 63.60 | 432 | -2.58 |
| Finland | 129 | - | 1,697 | 112.38 |
| Bulgarian | 112 | 371.56 | 180 | 33.37 |
| The Republic of El Salvador | 88 | - | 155 | 81.82 |
| Mongolia | 82 | 4.05 | 134 | 69.87 |
| Greece | 81 | -9.67 | 197 | -50.92 |
| Indonesia | 74 | - | 197 | - |
| The Republic of Yemen | 69 | - | 69 | - |
| Dominican Republic | 63 | -78.17 | 244 | -59.87 |
| Brazil | 51 | 122.22 | 102 | 345.45 |
| Tanzania | 48 | - | 48 | 99.85 |
| The Republic of Guatemala | 41 | 106.18 | 120 | 94.58 |
| Saudi Arabia | 38 | - | 136 | 239.51 |
| Morocco | 22 | -69.07 | 125 | -21.42 |
| Costa Rica | 21 | -0.26 | 83 | 99.57 |
| The Republic of Panama | 20 | -78.46 | 157 | -15.77 |
| The Commonwealth of Puerto Rico | 20 | -46.68 | 138 | -26.75 |
| The Oriental Republic of Uruguay | - | -100.00 | 24 | -76.41 |
| Israel | - | - | 92 | 190.53 |
| The Netherlands Antilles | - | - | 38 | - |
| South Africa | - | - | 200 | 101.76 |
| Oth. Ocean. Nes | - | - | 111 | - |
| Lebanon | - | - | 50 | - |
| Honduras | - | -100.00 | 66 | 0.76 |
| Thailand | - | -100.00 | 153 | -98.18 |
| The United Arab Emirates | - | - | 15 | - |
| Slovenia | - | - | 43 | - |
| Ireland | - | - | 211 | - |
| Paraguay | - | -100.00 | 69 | -40.25 |
| The Republic of Nicaragua | - | -100.00 | 17 | -83.87 |
| alumina | 218,242 | -42.10 | 933,117 | -37.11 |
| Origins | ||||
| Australia | 112,058 | -61.00 | 455,426 | -61.52 |
| India | 56,139 | 55,483.17 | 168,761 | 85.60 |
| Vietnam | 30,794 | -12.09 | 124,082 | 7.15 |
| The US | 9,972 | 16,409.73 | 10,396 | -69.65 |
| Brazil | 5,948 | - | 131,407 | - |
| Japan | 1,421 | 55.66 | 3,277 | 21.74 |
| Germany | 1,175 | 1,522.22 | 3,842 | 646.73 |
| France | 636 | -49.08 | 1,750 | -46.06 |
| South Korea | 88 | -59.09 | 419 | -18.15 |
| Canada | 6 | - | 70 | - |
| China | 2 | - | 7 | 85.89 |
| Austria | 2 | - | 4 | 137.50 |
| Taiwan (China) | 0 | -98.56 | 33 | -32.18 |
| Indonesia | - | - | 40 | - |
| Suriname | - | - | 33,601 | - |
| Italy | - | -100.00 | 2 | - |
| Bauxite | 4,443,318 | 144.07 | 10,055,650 | -21.74 |
| Origins | ||||
| Australia | 1,850,949 | 140.75 | 4,935,961 | 60.21 |
| Malaysia | 1,456,488 | 2,874.49 | 2,489,704 | 4,984.55 |
| India | 770,001 | 1,471.93 | 2,056,053 | 923.18 |
| Brazil | 158,174 | -9.54 | 158,174 | -9.54 |
| Republic of Ghana | 104,375 | -10.70 | 217,965 | 6.86 |
| Fiji | 56,950 | - | 107,069 | - |
| Solomon Islands | 46,381 | - | 87,210 | - |
| Vietnam | - | -100.00 | 3,513 | 277.20 |
| aluminum semis | 41,683 | 15.10 | 115,501 | 1.90 |
| Including | ||||
| Aluminum bar, rod, and profile | 5,648 | 21.46 | 16,085 | 11.64 |
| Aluminum wire | 741 | -0.87 | 1,843 | -6.98 |
| Aluminum plate, sheet, and strip | 29,572 | 21.28 | 81,798 | 3.37 |
| aluminum foil | 4,657 | -3.81 | 12,692 | -3.88 |
| Aluminum tube (including accessories) | 962 | -30.06 | 2,791 | -31.76 |
| Aluminum structure and components | 397 | -8.00 | 1,165 | -16.50 |
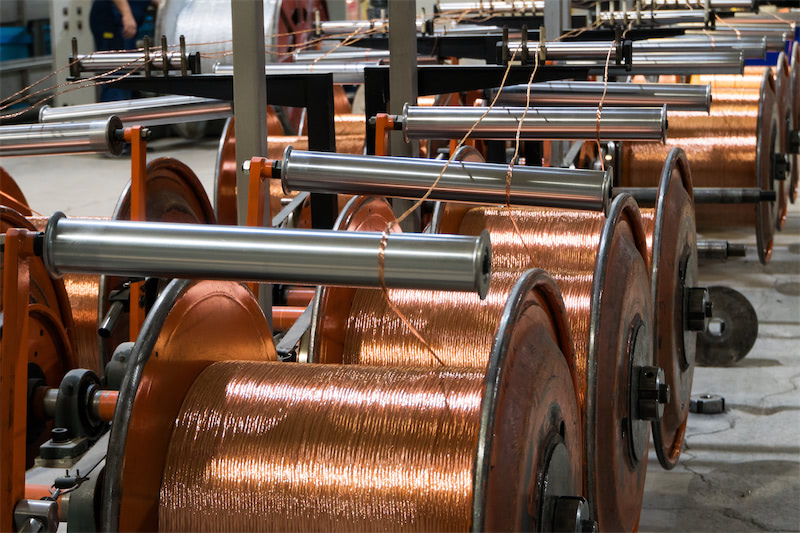
| Aluminum stranded wire, cable | 2 | -78.47 | 4 | -56.41 |
| Mar. | YoY (%) | Jan.– | YoY (%) | |
| Exports: | ||||
| Primary Aluminum | 15,620 | 75.17 | 17,300 | -26.42 |
| Destination | ||||
| Turkey | 13,783 | - | 13,783 | - |
| Taiwan (China) | 986 | - | 986 | - |
| Vietnam | 503 | - | 1,503 | - |
| Japan | 297 | -70.15 | 413 | -60.33 |
| The Kingdom of Bahrain | 27 | - | 27 | - |
| South Korea | 23 | -99.70 | 193 | -99.14 |
| Russia | - | - | 1 | - |
| North Korea | - | -100.00 | 108 | 150.87 |
| Hong Kong | - | - | 285 | - |
| aluminum alloy | 43,836 | 1.73 | 126,907 | 21.80 |
| Destination | ||||
| Japan | 16,821 | -14.86 | 44,706 | 1.47 |
| Hong Kong | 15,564 | 10.87 | 47,557 | 35.89 |
| South Korea | 2,398 | 93.96 | 5,061 | 64.25 |
| Vietnam | 2,017 | -8.08 | 6,801 | 9.99 |
| Taiwan (China) | 1,440 | 106.79 | 3,387 | 45.36 |
| Thailand | 1,264 | 73.64 | 3,593 | 100.41 |
| Australia | 1,117 | 31.11 | 3,973 | 75.49 |
| India | 545 | 71.59 | 1,891 | 152.17 |
| The Philippines | 511 | 18.68 | 1,261 | -13.74 |
| Malaysia | 431 | -72.54 | 2,423 | 37.17 |
| Holland | 326 | -0.51 | 812 | 0.87 |
| Indonesia | 319 | -25.22 | 1,001 | -44.70 |
| Turkey | 302 | 1,134.12 | 309 | 897.80 |
| Mexico | 227 | 3,677.55 | 775 | 12,823.45 |
| Norway | 200 | 32.85 | 725 | 126.46 |
| The United Arab Emirates | 100 | -37.88 | 320 | 32.79 |
| The Kingdom of Bahrain | 72 | 685.67 | 119 | 1,189.44 |
| Algeria | 50 | - | 99 | 142.39 |
| The US | 39 | -52.04 | 95 | -57.64 |
| Qatar | 24 | - | 24 | - |
| Ukraine | 24 | - | 48 | - |
| Greece | 20 | - | 20 | - |
| Spain | 16 | - | 20 | - |
| Pakistan | 5 | 66.67 | 5 | -28.57 |
| Slovenia | 5 | - | 50 | - |
| Russia | 1 | -92.98 | 1 | -97.00 |
| Iran | - | -100.00 | 200 | 2,753.11 |
| Cuba | - | - | 12 | - |
| Canada | - | - | 10 | - |
| Israel | - | -100.00 | 193 | 702.40 |
| The Arab Republic of Egypt | - | - | 199 | - |
| Italy | - | -100.00 | 79 | 556.04 |
| The Republic of Iceland | - | - | 48 | - |
| Austria | - | -100.00 | 20 | 33,665.00 |
| Brazil | - | -100.00 | 1,060 | -19.32 |
| Argentina | - | - | 10 | - |
| scrap aluminum | 107 | 1.55 | 253 | 36.69 |
| Destination | ||||
| South Korea | 94 | 10.37 | 224 | 35.20 |
| The United Arab Emirates | 13 | - | 13 | - |
| Japan | - | - | 17 | - |
| alumina | 1,400 | -78.98 | 9,899 | -79.51 |
| Destination | ||||
| South Korea | 294 | -86.35 | 3,603 | -17.33 |
| Japan | 195 | -6.41 | 601 | -4.29 |
| Vietnam | 170 | 44.91 | 520 | 115.52 |
| Russia | 152 | 8.45 | 289 | 66.97 |
| The US | 124 | -67.03 | 1,054 | -0.36 |
| Taiwan (China) | 88 | -33.21 | 242 | 25.48 |
| Bangladesh | 83 | 315.20 | 171 | 108.34 |
| Iran | 58 | -18.11 | 274 | 44.18 |
| Brazil | 51 | 112.50 | 126 | 423.12 |
| The UK | 44 | -33.43 | 133 | -12.37 |
| Spain | 32 | 102.03 | 46 | 43.52 |
| Germany | 23 | 108.81 | 53 | 280.30 |
| Australia | 22 | - | 27 | 7,336.11 |
| Italy | 15 | -92.42 | 53 | -84.32 |
| Uzbekistan | 10 | -91.38 | 10 | -91.41 |
| Kazakhstan | 6 | - | 123 | 3,983.33 |
| Thailand | 6 | -88.16 | 25 | -69.42 |
| India | 6 | -89.04 | 109 | -2.27 |
| North Korea | 5 | -99.78 | 2,006 | 0.01 |
| Hong Kong | 3 | 72.51 | 3 | -74.77 |
| Portugal | 2 | -47.06 | 2 | -76.74 |
| Hungary | 2 | - | 3 | 7,400.00 |
| The United Arab Emirates | 2 | -92.01 | 4 | -99.99 |
| Slovenia | 2 | - | 2 | - |
| Holland | 1 | -88.80 | 11 | -2.63 |
| Malaysia | 1 | - | 82 | 1,270.00 |
| France | 1 | -98.88 | 15 | -80.93 |
| Canada | 1 | -98.63 | 52 | -28.55 |
| Turkey | 0 | - | 5 | - |
| The Independent State of Papua New Guinea | - | - | 1 | - |
| Mexico | - | -100.00 | 26 | -65.82 |
| The State of Kuwait | - | - | 5 | - |
| Singapore | - | -100.00 | 36 | 430.60 |
| Indonesia | - | -100.00 | 37 | -67.70 |
| Israel | - | -100.00 | 3 | -33.33 |
| South Africa | - | -100.00 | 33 | 107.27 |
| Greece | - | - | 6 | - |
| Mauritius | - | - | 1 | - |
| Nigeria | - | - | 108 | 157.14 |
| aluminum semis | 300,000 | -5.20 | 1,070,000 | 48.90 |
| Including | ||||
| Aluminum bar, rod, and profile | 50,404 | 9.10 | 182,257 | 40.13 |
| Aluminum wire | 2,187 | 15.90 | 6,973 | 48.84 |
| Aluminum plate, sheet, and strip | 164,187 | -9.97 | 610,448 | 71.38 |
| aluminum foil | 74,309 | 8.55 | 226,031 | 18.73 |
| Aluminum tube (including accessories) | 6,966 | -55.43 | 42,324 | 18.16 |
| Aluminum structure and components | 47,210 | 0.21 | 181,859 | 34.69 |
| Aluminum stranded wire, cable | 20,116 | 86.33 | 67,628 | 113.40 |
| Note:“-”meansdataisunavailable. |