Đăng Nhập
VNWorld Copper Production and Usage for June: Summary
Tuyên bố về Nguồn Dữ liệu: Ngoại trừ thông tin công khai, tất cả dữ liệu khác được SMM xử lý dựa trên thông tin công khai, giao tiếp thị trường và dựa trên mô hình cơ sở dữ liệu nội bộ của SMM. Chúng chỉ mang tính chất tham khảo và không cấu thành khuyến nghị ra quyết định.
Để biết thêm thông tin hoặc có thắc mắc gì, vui lòng liên hệ: lemonzhao@smm.cn
Để biết thêm thông tin về cách truy cập báo cáo nghiên cứu, vui lòng liên hệ:service.en@smm.cn
Tin Liên Quan
1 giờ trước
Dữ liệu: Diễn biến thị trường SHFE, DCE (24/3)
Read More
Dữ liệu: Diễn biến thị trường SHFE, DCE (24/3)
Bảng sau cho thấy biến động của kim loại đen và kim loại màu trên SHFE và DCE vào ngày 24 tháng 3 năm 2026
1 giờ trước
2 giờ trước
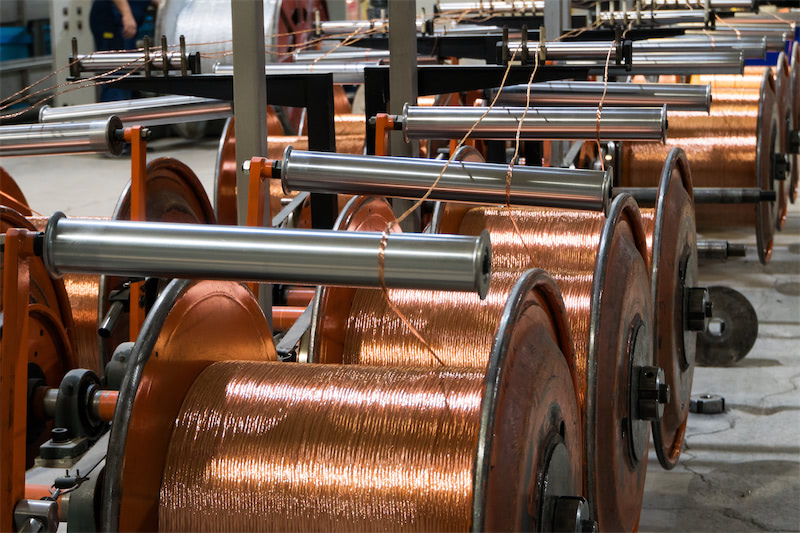
Máy cán đồng 3.500 mm tự sản xuất đầu tiên của Trung Quốc chạy thử thành công, đạt bước đột phá lớn
Read More
Máy cán đồng 3.500 mm tự sản xuất đầu tiên của Trung Quốc chạy thử thành công, đạt bước đột phá lớn
Chiếc máy cán nóng nguội tấm đồng và hợp kim đồng khổ rộng, dày 3.500 mm đầu tiên trong nước do China First Heavy Industries chế tạo cho Công ty TNHH Gia công Đồng Luoyang thuộc Chalco, được tự chủ thiết kế và sản xuất, đã cán thử thành công ngay lần đầu, hoàn thành mục tiêu sớm hơn 1 tháng, đánh dấu bước đột phá lớn của Trung Quốc trong lĩnh vực thiết bị cán tấm đồng và hợp kim đồng khổ rộng, dày cao cấp.
2 giờ trước
5 giờ trước
Giá tham chiếu phế liệu đồng đã bao gồm thuế tại Chiết Giang của SMM (ngày 24 tháng 3 năm 2026)
Read More
Giá tham chiếu phế liệu đồng đã bao gồm thuế tại Chiết Giang của SMM (ngày 24 tháng 3 năm 2026)
Hôm nay, giá trung bình dây đồng Bare Bright đã gồm thuế tại Chiết Giang được báo ở mức 93.700 nhân dân tệ/tấn, tăng 700 nhân dân tệ/tấn so với ngày trước. Mức khấu trừ (so với giá đồng SMM Trường Giang) duy trì ổn định trong khoảng 300–400 nhân dân tệ/tấn. Do giá gần đây điều chỉnh giảm từ vùng cao và thị trường biến động mạnh, tâm lý “chờ đợi và quan sát” gia tăng rõ rệt, khiến giao dịch giao ngay diễn biến trầm lắng. Giới chuyên môn cho rằng thị trường hiện đang trong thế giằng co. Tuy nhiên, khối lượng giao dịch được kỳ vọng sẽ chạm đáy rồi phục hồi khi giá ổn định hoặc lấy lại đà tăng
5 giờ trước
Tin Liên Quan
Dữ liệu: Diễn biến thị trường SHFE, DCE (24/3)
Mar 24, 2026 15:52
Máy cán đồng 3.500 mm tự sản xuất đầu tiên của Trung Quốc chạy thử thành công, đạt bước đột phá lớn
Mar 24, 2026 14:05
Giá tham chiếu phế liệu đồng đã bao gồm thuế tại Chiết Giang của SMM (ngày 24 tháng 3 năm 2026)
Mar 24, 2026 11:56
Thanh lý bán ra của nhà cung cấp và chào giá đối ứng từ hạ nguồn khiến mức chiết khấu đồng giao ngay tại Thượng Hải chịu áp lực [SMM Đồng giao ngay Thượng Hải]
Mar 24, 2026 11:53