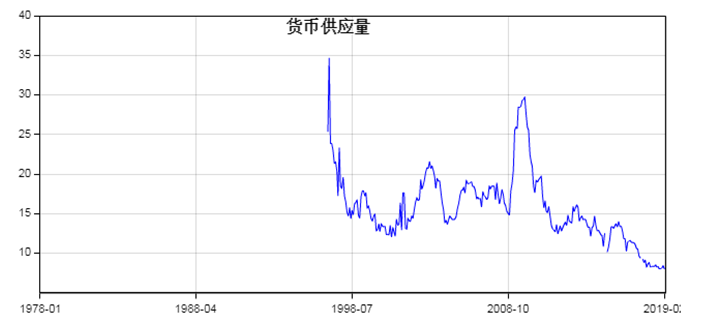
From the trend of M2, China's M2 growth rate has been in a high state before 1998, during which there have been several times of high inflation prices. From 1998 to 2008, M2 growth rate hovered between 12.3% and 20.8%, during which the economy was in a relatively stable stage of development. M2 growth soared from 15.02 per cent in September 2008 to 29.42 per cent in November 2009, apparently directly related to 4 trillion of government spending in the wake of the financial crisis. From 2013 to 2015, China's M2 growth rate slowed to 12.7% on average. Due to the implementation of the policy of "adjusting structure and removing production capacity", the overall economy is in a relatively stable stage. With M2 growth slowing from 10 per cent to 8.1 per cent in 2017, it is clear that the economy is in a weak phase. What is the relationship between M2 growth rate and the price of big merchants? Compared with nearly 40 futures varieties, it is found that when M2 growth rate develops from low to high, it is suitable to configure more futures varieties. On the contrary, when M2 growth rate decreases from high to low, more futures empty varieties should be allocated. So what is M2 growth rate?
M2 is an important indicator of money supply. M0, M1, M2, M3 are all important indicators to reflect the money supply. M1 reflects the real purchasing power in the economy; M2 reflects both the real and potential purchasing power. If M1 is growing faster, consumption and terminal markets are active; if M2 is growing faster, investment and intermediate markets are active. The central bank and the commercial banks may determine monetary policy accordingly. M1 is too high and M2 is too low, indicating that demand is strong, underinvestment, there is a risk of inflation; M2 is too high and M1 is too low, indicating that investment is overheated, demand is not strong, there is the risk of asset bubble. Generally speaking, M2 mainly measures the buying and selling activity of investment market and capital market in the economy. This index has an important impact on commodity prices, and a good grasp of this index can effectively predict the trend of futures prices.