SHANGHAI, Feb 17 (SMM) - This is a roundup of China's metals weekly inventory as of February 17.
SMM Aluminium Ingot and Billet Social Inventories as of February 16
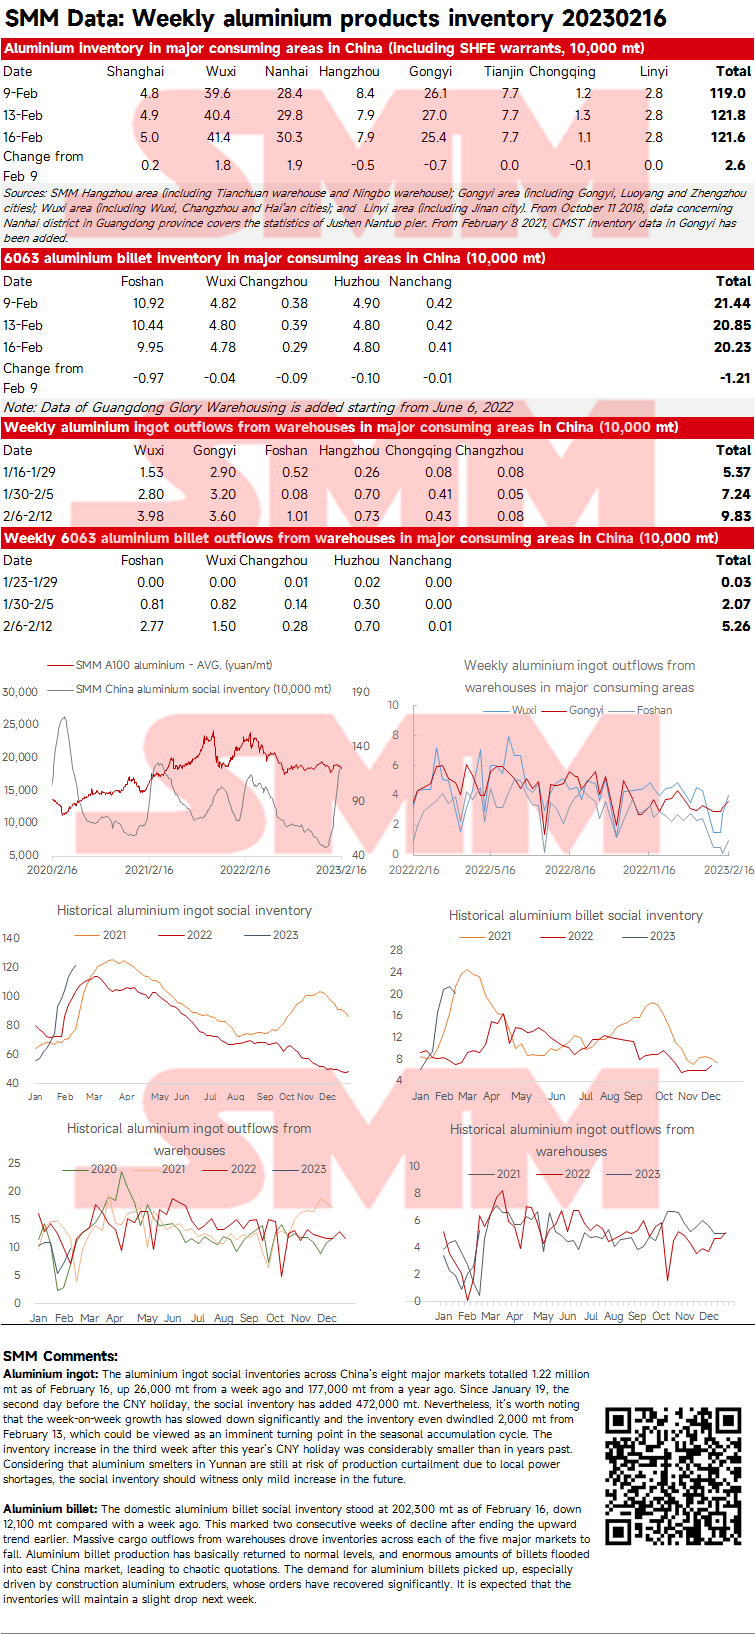
Aluminium ingot: The aluminium ingot social inventories across China’s eight major markets totalled 1.22 million mt as of February 16, up 26,000 mt from a week ago and 177,000 mt from a year ago. Since January 19, the second day before the CNY holiday, the social inventory has added 472,000 mt. Nevertheless, it’s worth noting that the week-on-week growth has slowed down significantly and the inventory even dwindled 2,000 mt from February 13, which could be viewed as an imminent turning point in the seasonal accumulation cycle. The inventory increase in the third week after this year’s CNY holiday was considerably smaller than in years past. Considering that aluminium smelters in Yunnan are still at risk of production curtailment due to local power shortages, the social inventory should witness only mild increase in the future.
Aluminium billet: The domestic aluminium billet social inventory stood at 202,300 mt as of February 16, down 12,100 mt compared with a week ago. This marked two consecutive weeks of decline after ending the upward trend earlier. Massive cargo outflows from warehouses drove inventories across each of the five major markets to fall. Aluminium billet production has basically returned to normal levels, and enormous amounts of billets flooded into east China market, leading to chaotic quotations. The demand for aluminium billets picked up, especially driven by construction aluminium extruders, whose orders have recovered significantly. It is expected that the inventories will maintain a slight drop next week.
Social Inventory of Lead Ingot Hit a 5-month High amid the Delivery of SHFE 2302 Contract
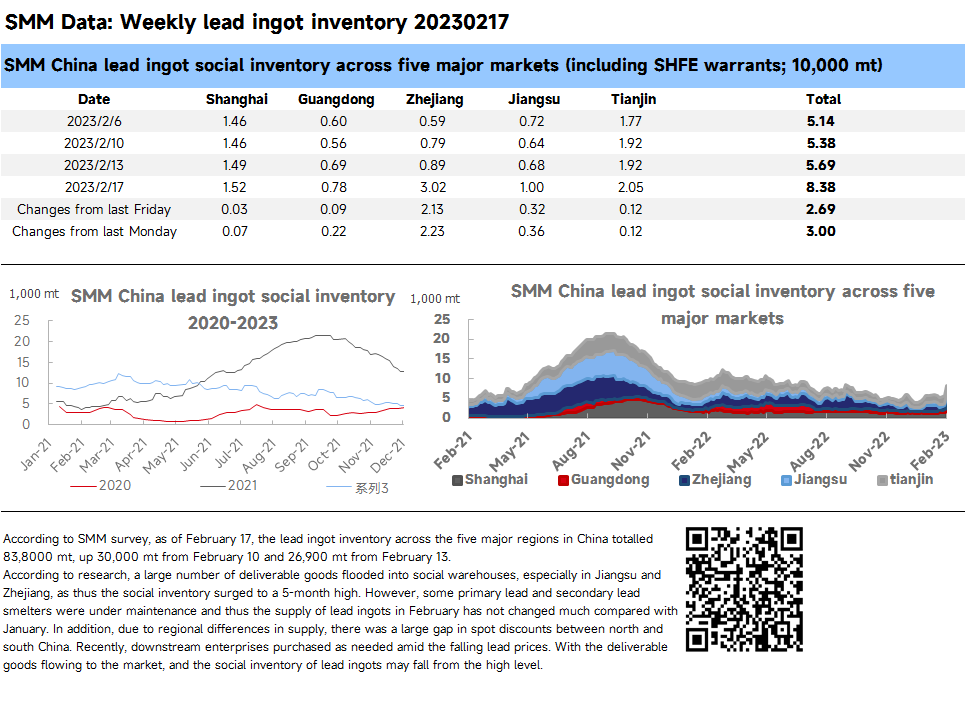
SHNAGHAI, Feb 17 (SMM) - According to SMM survey, as of February 17, the lead ingot inventory across the five major regions in China totalled 83,8000 mt, up 30,000 mt from February 10 and 26,900 mt from February 13.
According to research, a large number of deliverable goods flooded into social warehouses, especially in Jiangsu and Zhejiang, as thus the social inventory surged to a 5-month high. However, some primary lead and secondary lead smelters were under maintenance and thus the supply of lead ingots in February has not changed much compared with January. In addition, due to regional differences in supply, there was a large gap in spot discounts between north and south China. Recently, downstream enterprises purchased as needed amid the falling lead prices. With the deliverable goods flowing to the market, and the social inventory of lead ingots may fall from the high level.
Copper Inventory in Major Chinese Markets Added 9,100 mt This Week
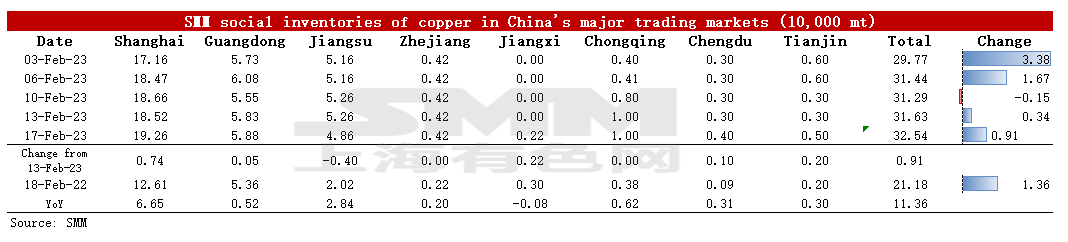
As of Friday February 17, copper stocks in mainstream Chinese Markets tracked by SMM increased by 9,100 mt to 325,400 mt from Monday, an increase of 12,500 mt from last Friday, and an increase of 128,800 mt from the level before Chinese New Year holidays. The post-holiday stock accumulation was slightly above the accumulation of 122,700 mt in the same period last year. National Domestic inventory has accumulated for eight consecutive weeks since the end of December. Only Jiangsu saw inventory declines. Total inventory climbed 113,600 mt compared to 211,800 mt in the same period last year. The inventory was 66,500 mt higher than the same period last year in Shanghai, 5,200 mt higher than the same period last year in Guangdong, and 28,400 mt higher in Jiangsu. The inventory in Zhejiang exceeded the same period last year by 2,000 mt, and that in Chongqing was 6,200 mt more. Chengdu saw a 3,100 mt increase in inventory from the same period last year, and Tianjin reported a growth of 3,000 mt.
Specifically, the inventory in Shanghai increased by 7,400 mt to 192,600 mt compared with Monday. There were large volumes of arriving shipments of domestic copper especially those from smelters to warehouses due to the delivery early in the week. Arrivals of imported copper were limited, though. The inventory in Guangdong increased by 500 mt to 58,800 mt. This week, the consumption in Guangdong has diminished significantly. SMM understood that due to the previous excessive production and the slow stockpiling by downstream producers recently, the copper semis processing plants have high inventories and were forced to lower operating rates. This can also be reflected in the decline in the average daily shipments from Guangdong. The decline in inventory in Jiangsu was mainly due to the improvement in downstream stockpiling.
As far as we know, the arrivals of imported copper next week will remain limited, and the market supply will be mainly domestic copper. The total supply is expected to remain stable. Consumption next week would underperform this week due to the month-end cash flow issues and downstream consumption having not improved noticeably. To sum up, SMM expect that inventory will continue to increase next week.
Copper Inventory in China Bonded Zone Grew 15,900 mt This Week
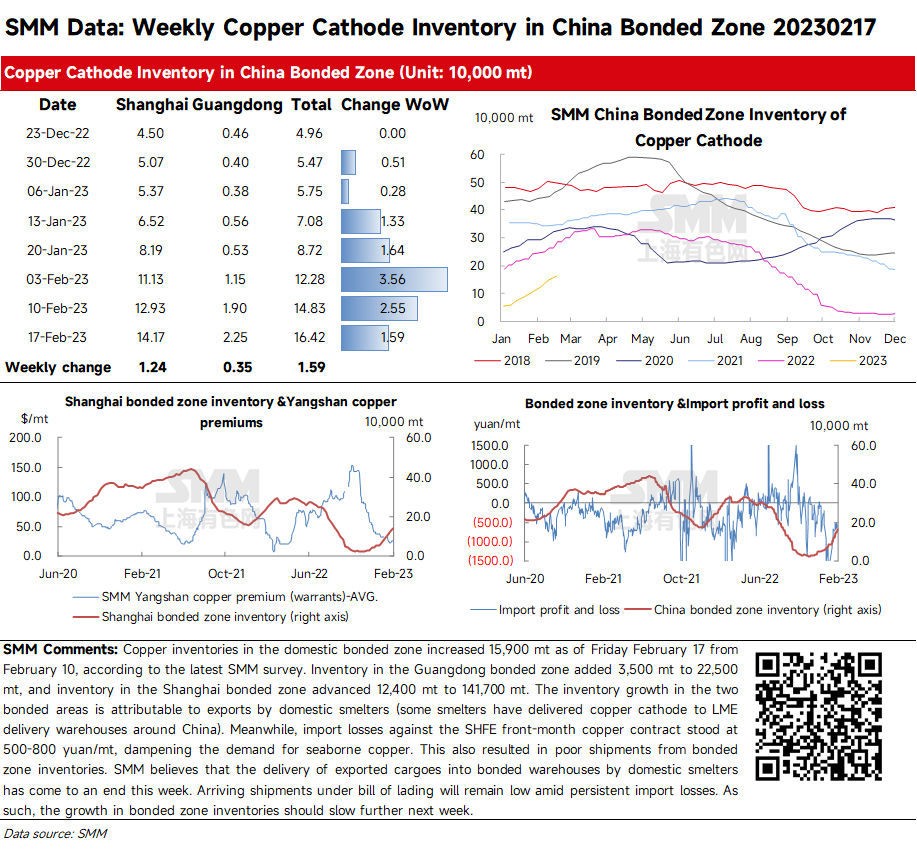
Copper inventories in the domestic bonded zone increased 15,900 mt as of Friday February 17 from February 10, according to the latest SMM survey. Inventory in the Guangdong bonded zone added 3,500 mt to 22,500 mt, and inventory in the Shanghai bonded zone advanced 12,400 mt to 141,700 mt.
The inventory growth in the two bonded areas is attributable to exports by domestic smelters (some smelters have delivered copper cathode to LME delivery warehouses around China). Meanwhile, import losses against the SHFE front-month copper contract stood at 500-800 yuan/mt, dampening the demand for seaborne copper. This also resulted in poor shipments from bonded zone inventories.
SMM believes that the delivery of exported cargoes into bonded warehouses by domestic smelters has come to an end this week. Arriving shipments under bill of lading will remain low amid persistent import losses. As such, the growth in bonded zone inventories should slow further next week.
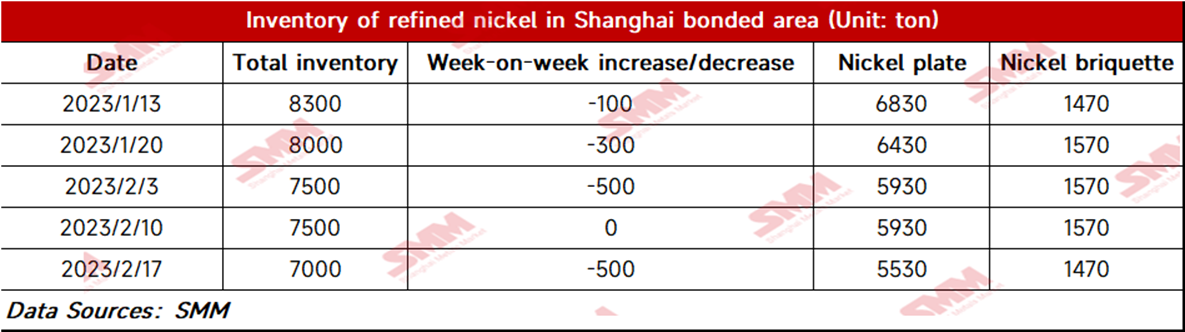
Bonded Zone Inventory of Nickel Falls 500 mt from Feb 10
Bonded zone inventory of nickel dropped 500 mt to 7,000 mt WoW as of February 17, with the inventory of nickel briquettes and nickel plates standing at 1,470 mt and 5,530 mt respectively. Imports of pure nickel gained some profits last week and this week. Some traders who lock in the SHFE/LME nickel price ratio cleared customs this week. Nickel briquettes and nickel plates have been shipped to the spot market during the week.
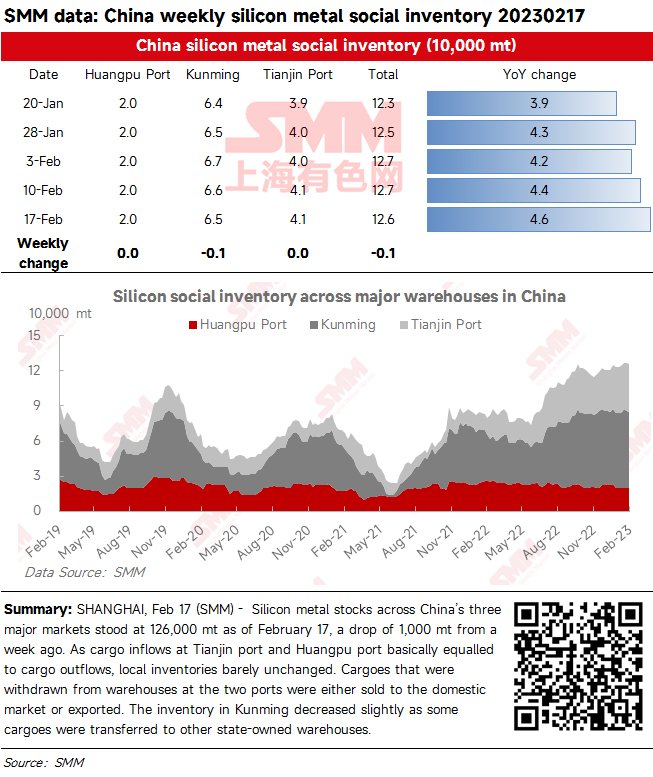
Silicon Metal Social Inventory Dropped Slightly
Silicon metal stocks across China’s three major markets stood at 126,000 mt as of February 17, a drop of 1,000 mt from a week ago. As cargo inflows at Tianjin port and Huangpu port basically equalled to cargo outflows, local inventories barely unchanged. Cargoes that were withdrawn from warehouses at the two ports were either sold to the domestic market or exported. The inventory in Kunming decreased slightly as some cargoes were transferred to other state-owned warehouses.
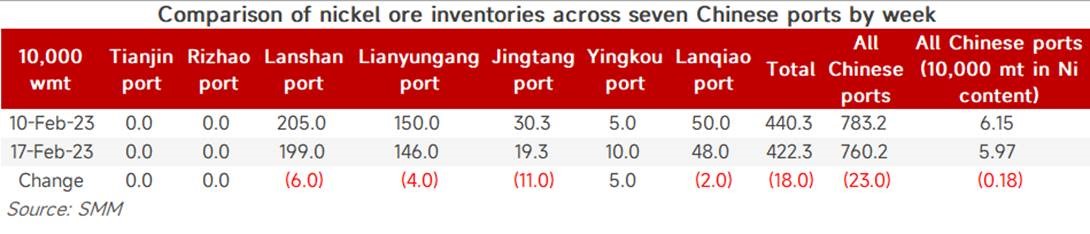
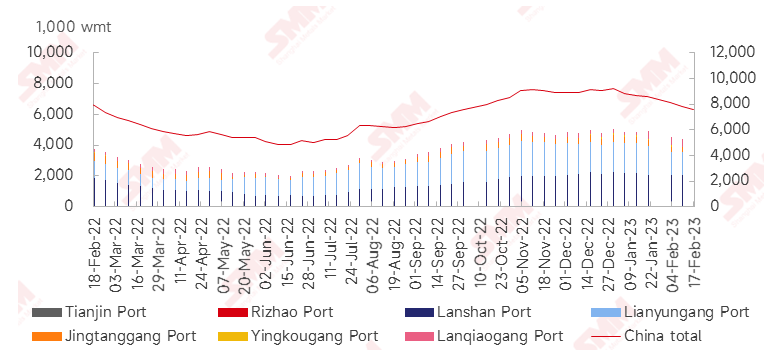
Nickel Ore Inventories at Chinese Ports Fall 230,000 wmt on the Week
As of February 17, the nickel ore inventories at Chinese ports dipped 230,000 wmt from a week earlier to 7.6 million wmt. The total Ni content dropped 2,000 mt to about 60,000 mt. The port inventory of nickel ore across seven major Chinese ports stood at 4.22 million wmt, 180,000 wmt lower than the previous week, with the inventory at Jingtang Port falling the most. On the supply side, nickel ore shipments from the Philippines are hindered by the rainy season, tightening the market supply. On the demand side, NPI plants could only accept lower purchase prices after the NPI prices fell, which cannot boost the nickel ore imports. Port inventory of laterite nickel ore will maintain a downward trend amid the game between buyers and sellers.
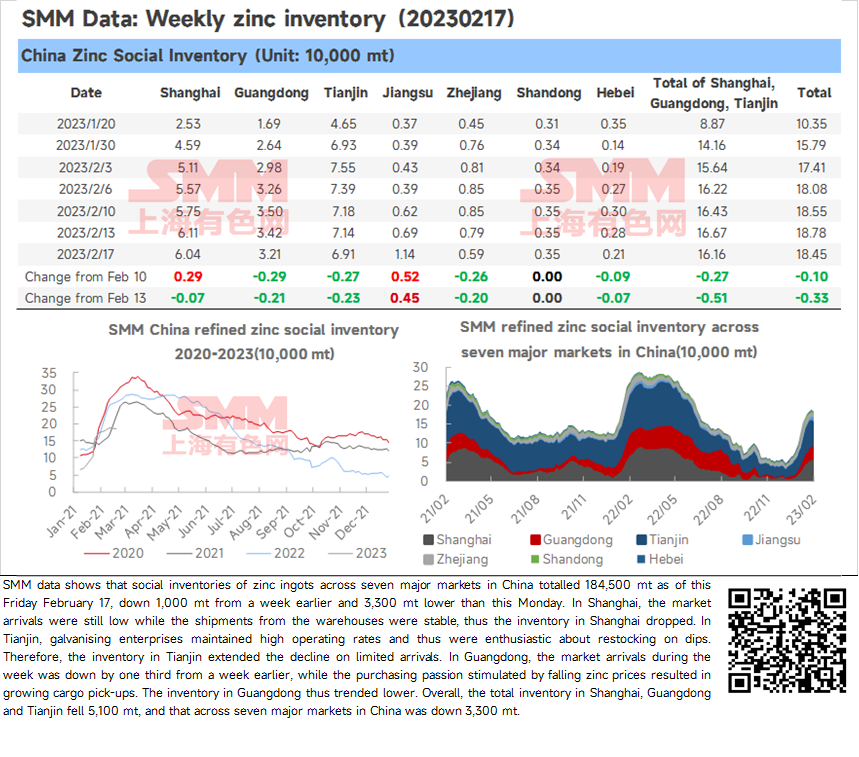
Zinc Ingot Social Inventory Down 3,300 mt from Monday
SMM data shows that social inventories of zinc ingots across seven major markets in China totalled 184,500 mt as of this Friday February 17, down 1,000 mt from a week earlier and 3,300 mt lower than this Monday.
In Shanghai, the market arrivals were still low while the shipments from the warehouses were stable, thus the inventory in Shanghai dropped.
In Tianjin, galvanising enterprises maintained high operating rates and thus were enthusiastic about restocking on dips. Therefore, the inventory in Tianjin extended the decline on limited arrivals.
In Guangdong, the market arrivals during the week was down by one third from a week earlier, while the purchasing passion stimulated by falling zinc prices resulted in growing cargo pick-ups. The inventory in Guangdong thus trended lower.
Overall, the total inventory in Shanghai, Guangdong and Tianjin fell 5,100 mt, and that across seven major markets in China was down 3,300 mt.


![[SMM 크롬 플래시] 남아프리카공화국 8월 고탄소 페로크롬 수출량 전월 대비 20% 증가한 11만 7,180톤, 캐나다·미국발 선적이 주도](https://imgqn.smm.cn/usercenter/TdoSs20251217171724.jpeg)