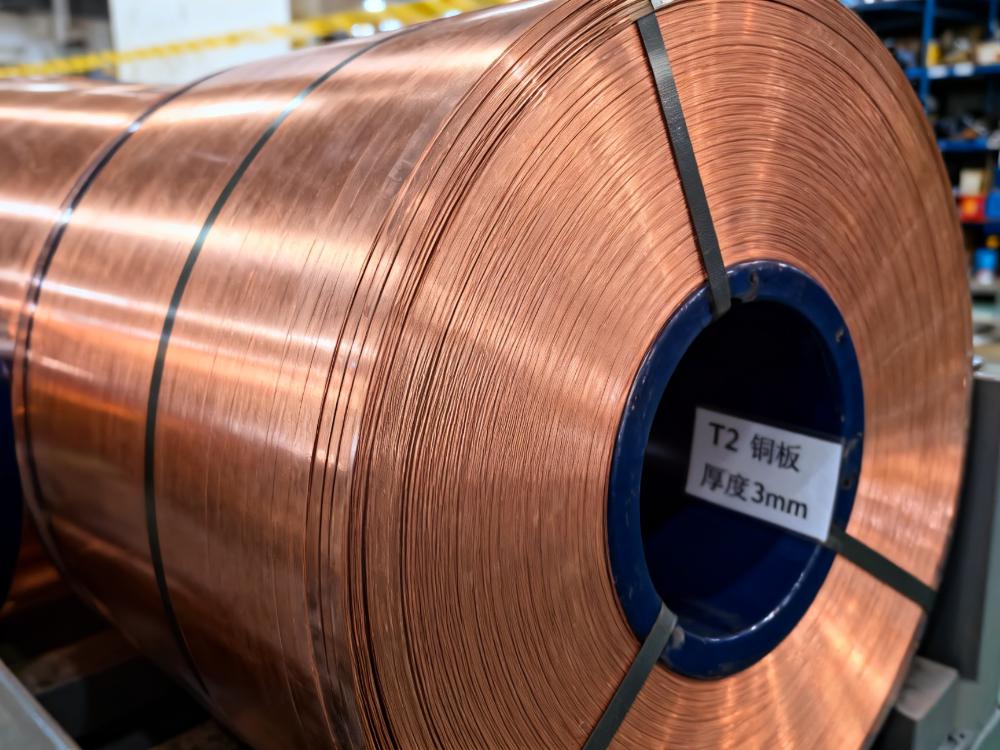
According to data from the General Administration of Customs, in July 2026, China's copper foil imports (HS codes: 74101100, 74102190) were 7,908.95 mt, up 22.2% YoY and down 7.06% MoM; from January to July 2026, China's cumulative copper foil imports were 53,039.26 mt, up 13.64% YoY.
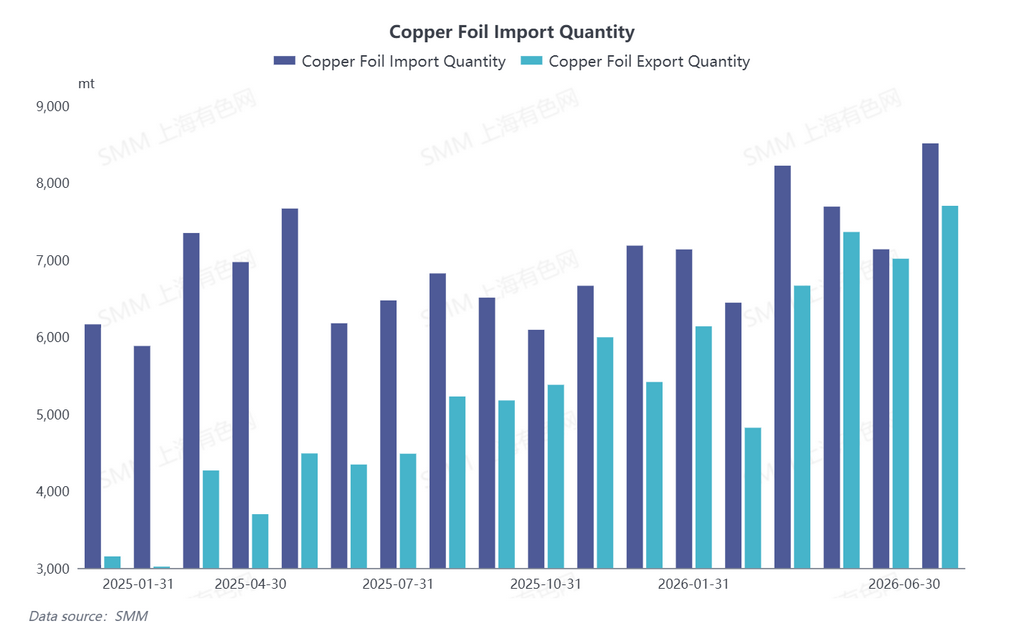
In July 2026, China's copper foil exports were 7,066.1 mt, up 57.6% YoY and down 8.23% MoM; from January to July 2026, China's cumulative copper foil exports were 46,758.9 mt, up 70.34% YoY.
In July 2026, China's copper foil import value was $188.415 million, up 53.64% YoY and down 4.13% MoM; from January to July 2026, China's cumulative copper foil import value was $1,157.449 million, up 41.37% YoY.
In July 2026, China's copper foil export value was $119.2991 million, up 104.85% YoY and up 12.79% MoM; from January to July 2026, China's cumulative copper foil export value was $759.2695 million, up 115.41% YoY.
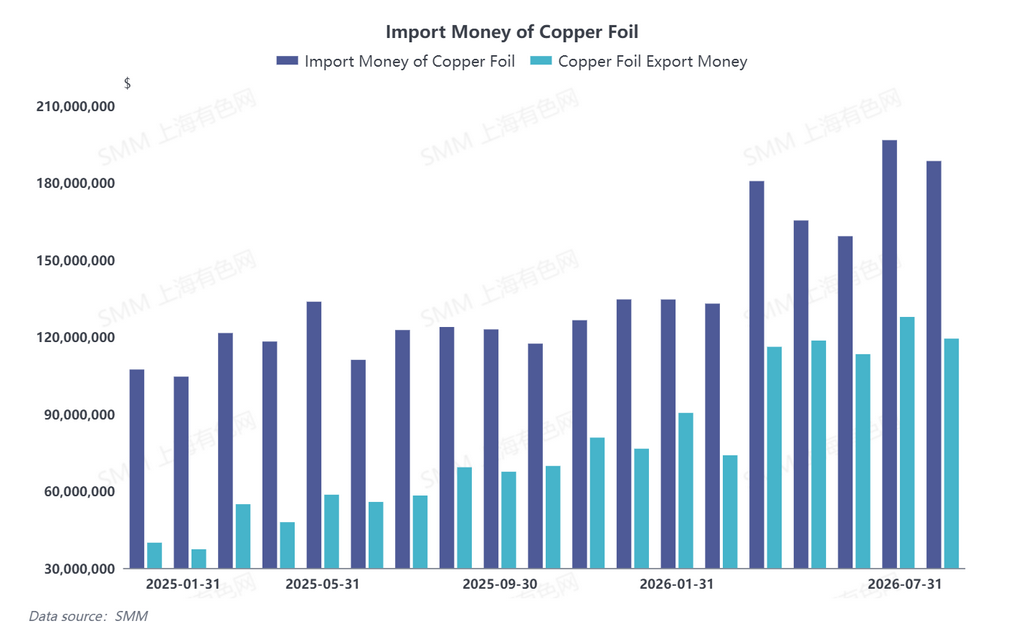
In July 2026, China's copper foil trade deficit was approximately $69.12 million, up about $0.32 million MoM from June 2026's $68.8 million.
By trade mode, in July 2026, China imported 5,548.55 mt of copper foil via Ordinary Trade; 176.51 mt via processing trade with supplied materials; 1,216.49 mt via processing trade with imported materials; 937.55 mt via customs special supervision zones; and 29.85 mt via other trade modes.
In July 2026, China exported 1,478.12 mt of copper foil via Ordinary Trade; 1,751.78 mt via processing trade with supplied materials; 3,375.78 mt via processing trade with imported materials; 411.31 mt via customs special supervision zones; and 49.12 mt via other trade modes.
By country/region, in July 2026, the main import sources for China's copper foil were Taiwan, China, Malaysia, and Indonesia, with imports of 4,491.66 mt, 1,022.84 mt, and 918.87 mt, respectively.
In July 2026, the main export destinations for China's copper foil were Thailand, South Korea, and Malaysia, with exports of 1,341.16 mt, 1,012.96 mt, and 996.23 mt, respectively. In July 2026, China's copper clad laminate (CCL) (HS code: 74102110) imports were 4,091.67 mt, up 26.55% YoY and up 26.03% MoM; from January to July 2026, China's cumulative CCL imports were 24,607.69 mt, up 6.89% YoY.
In July 2026, China's CCL exports were 8,905.19 mt, up 23.17% YoY and down 4.47% MoM; from January to July 2026, China's cumulative CCL exports were 57,990.65 mt, up 12.58% YoY.
Overall, in July 2026, China's copper foil imports and exports both pulled back MoM. On the import side, China's capacity continued to ramp up, with the substitution rate for low and mid-end specifications already at a high level, marginal import dependency declining, and imports continuing to contract. On the export side, the pullback was due to strong demand from China's lithium battery and AI computing sectors, narrowing the surplus supply available for export; additionally, July coincided with the off-season in the Northern Hemisphere, slowing the procurement pace of downstream electronics manufacturing and battery assembly in major export destinations such as Southeast Asia. However, YoY growth remained stable, and a continuation of the high prosperity trend is expected in August.