Published:
May 09, 2026 - 3:35 AM
Updated:
May 09, 2026 - 3:39 AM
The fundamental backdrop is shifting in silver's favor. The war has reached a stalemate, and most of the escalation risk is behind us. China's economy accelerated to 5% growth in Q1, its strongest pace in over a year, and copper's breakout above $6.25 is the industrial-demand confirmation that's been missing. Silver's industrial component, roughly half its end use, typically gets pulled along when copper leads. Meanwhile, the dollar is rolling over into what looks like another leg lower, and it has historically been the single most reliable tailwind for the entire metals complex.
Daily Silver Chart
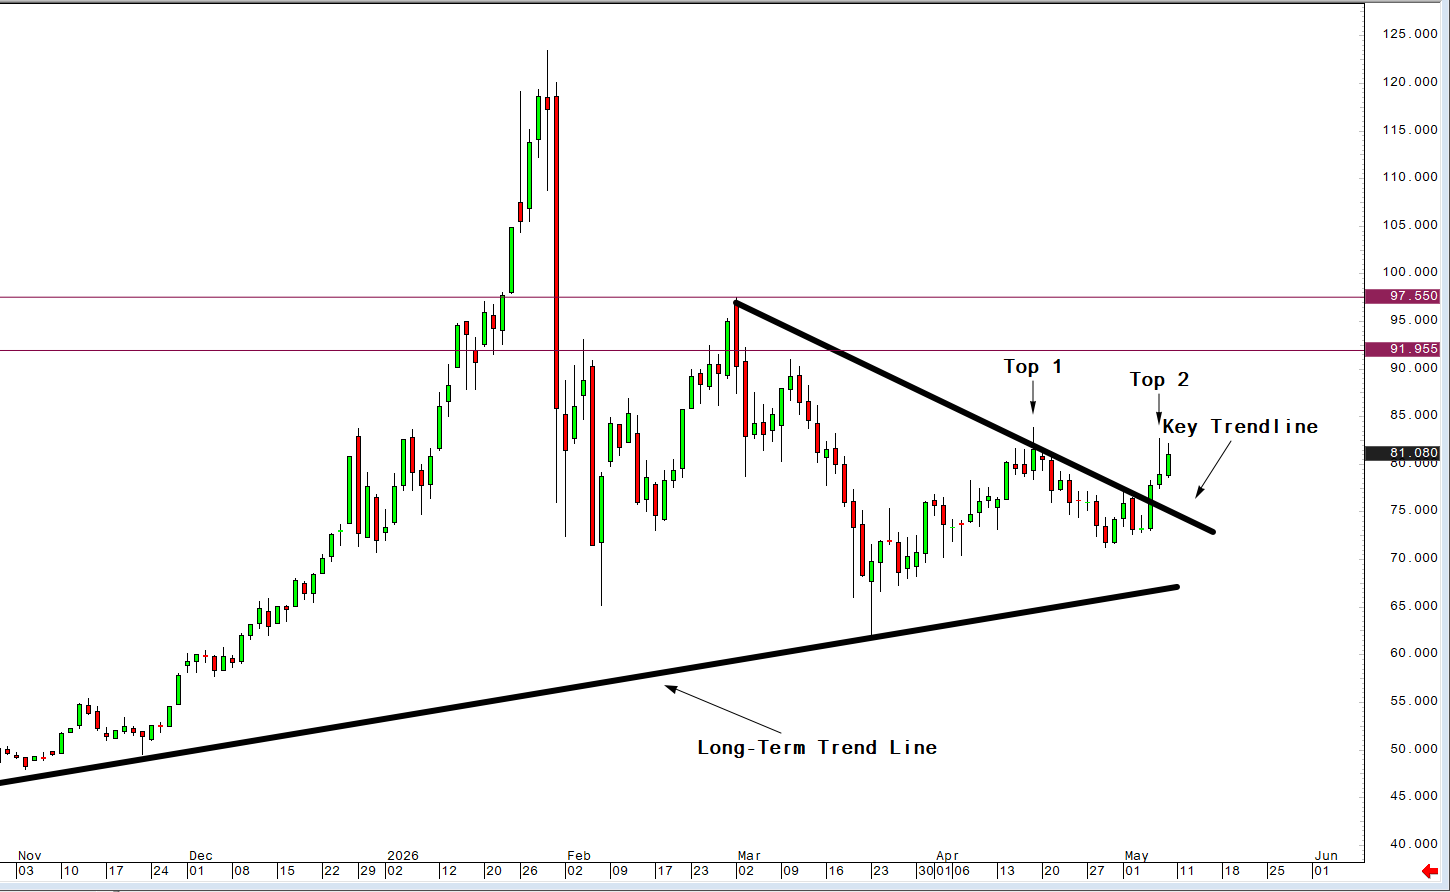
Silver has spent the past three sessions behaving like a market that wants to go higher. After running from $73 to $82+ in two days, silver retested the breakout at $78 and held. The chart shows two price peaks in proximity, near $84 (the mid-April rally high) and $82.67 (Wednesday's intraday high). When two peaks form at similar levels like this, traders call it a double top, and a warning sign that buyers tried twice to push prices higher, failed both times, and may be running out of steam, which is why it's considered a bearish reversal pattern. However, the pattern doesn't activate just because two peaks exist; it only triggers if the price falls below the neckline at $73, the low point between the two peaks, which would confirm sellers have taken back control. On the flip side, a daily close above $84 cancels the pattern entirely, signaling that the bearish technical threat could be off the table.
If price closes above $84, the recent sideways action has broken out to the upside, potentially clearing the way for higher prices. The first hurdle would be $92, with a longer-term target of $98–$100 based on a falling wedge pattern on the chart. Bottom line: keep an eye on two key levels. A drop below $73 turns the outlook bearish, while a close above $84 turns it bullish. Staying ahead of the Silver market has never been easier. Get the Blue Line Futures Precious Metals Chart Pack today with the same level-by-level technical breakdown, including the cross-contract setups that often signal which metal is leading and which is lagging by registering here: Get Precious Metals Chart Pack
Performance Disclaimer
Hypothetical performance results have many inherent limitations, some of which are described below. No representation is being made that any account will or is likely to achieve profits or losses similar to those shown. In fact, there are frequently sharp differences between hypothetical performance results and the actual results subsequently achieved by any particular trading program.
One of the limitations of hypothetical performance results is that they are generally prepared with the benefit of hindsight. In addition, hypothetical trading does not involve financial risk, and no hypothetical trading record can completely account for the impact of financial risk in actual trading.
For example, the ability to withstand losses or to adhere to a particular trading program in spite of trading losses are material points that can also adversely affect actual trading results. There are numerous other factors related to the markets in general or to the implementation of any specific trading program that cannot be fully accounted for in the preparation of hypothetical performance results all of which can adversely affect actual trading results.
Source:https://www.kitco.com/opinion/2026-05-08/silver-about-break-out-these-are-levels-watch