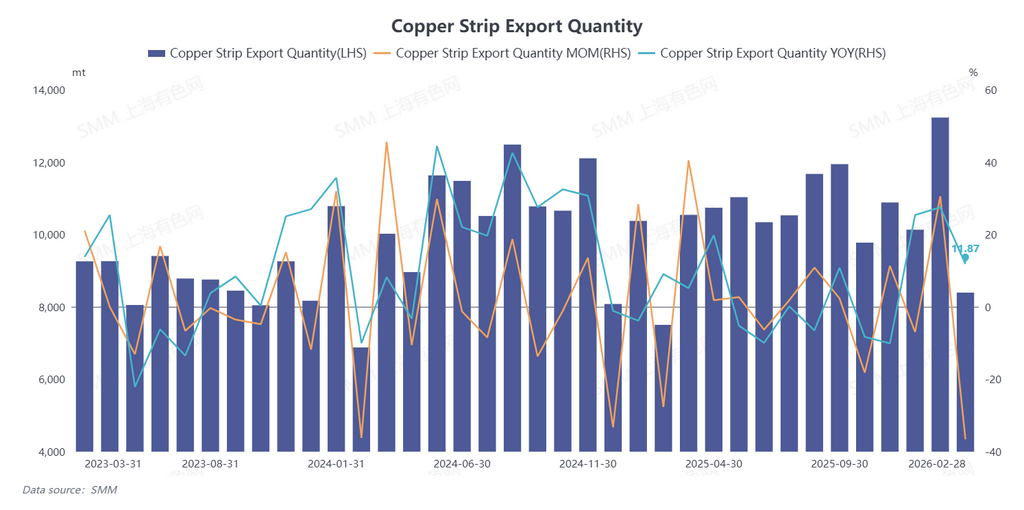
According to data from the General Administration of Customs, China’s copper plate/sheet and strip exports were 13,233.73 mt in January 2026, up 30.59% MoM and up 27.53% YoY; in February, exports were 8,395.28 mt, down 36.56% MoM and up 11.87% YoY. In January-February, China’s cumulative copper plate/sheet and strip exports reached 21,629.01 mt, up 20.96% YoY cumulatively.
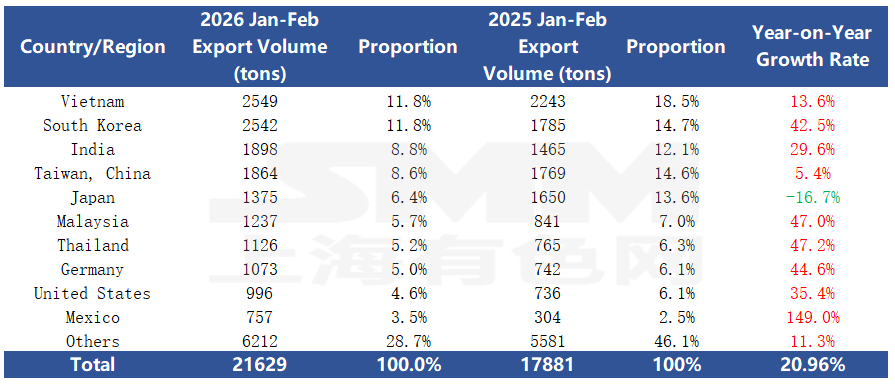
In January-February 2026, China’s copper plate/sheet and strip exports rose 20.96% YoY, maintaining overall steady growth, with exports covering 120 countries and regions. In terms of export pattern, Vietnam and South Korea ranked first and second, with export volumes of 2,549 mt and 2,542 mt, up 13.6% YoY and 42.5% YoY, respectively. India maintained steady growth and ranked third with exports of 1,898 mt, with the YoY growth rate reaching 29.6%; Taiwan, China and Japan followed, with export volumes of 1,864 mt and 1,375 mt, respectively. Among them, Taiwan, China was up 5.4% YoY, while Japan was the only major destination market to post a YoY decline, down 16.7%. In terms of growth rates, emerging markets were particularly outstanding: Mexico’s YoY growth rate reached as high as 149.0%, with exports surging from 304 mt to 757 mt, making it the most prominent growth market. Malaysia, Thailand, and Germany also performed strongly, with YoY growth rates of 47.0%, 47.2%, and 44.6%, respectively, all achieving growth of more than 40%.
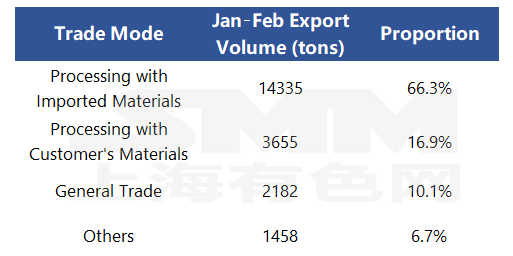
The structure of China’s copper plate/sheet and strip export trade modes continued the characteristics seen in the previous period. Customs data showed that in January-February, processing trade with imported materials remained the core export mode, with exports of 14,335 mt, accounting for 66.3% and firmly maintaining its dominant position; Processing and Assembling exports were 3,655 mt, accounting for 16.9%; Ordinary Trade exports were 2,182 mt, accounting for 10.1%; and other trade modes totaled 1,458 mt, accounting for 6.7%.
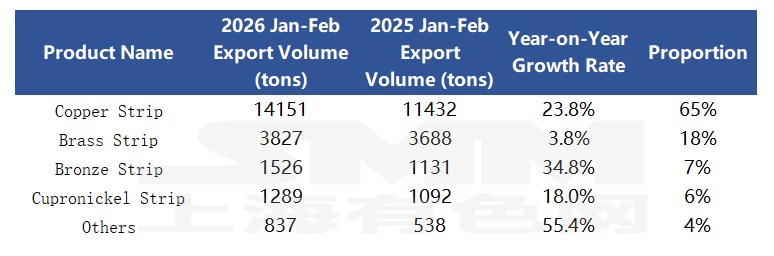
In terms of detailed product structure, in January-February 2026, China’s copper plate/sheet and strip exports were still dominated by copper strip, with exports of 14,151 mt, accounting for 65% and up 23.8% YoY, serving as the core driver boosting overall exports. Bronze strip performed strongly, with a YoY growth rate of 34.8%, the fastest among major categories; cupronickel strip, brass strip, and other categories also achieved YoY growth, with the overall structure remaining stable and growth momentum abundant. (HS code 74091110,74091190,74091900,74092100,74092900,74093100,74093900,74094000,74099000)