1. Manufacturing Purchasing Managers Index
In December 2020, China's Manufacturing Purchasing Managers Index (PMI) was 51.9 percent, down by 0.2 percentage point from last month, which was above the threshold for ten consecutive months, indicating that the manufacturing industry continued to recovery steadily.
In terms of enterprise scale, the PMI of large enterprises was 52.7 percent, which was 0.3 percentage point lower than that of last month, but still higher than the threshold; the PMI of medium-sized enterprises was 52.7 percent, which was 0.7 percentage point higher than that of last month, and continued to be above the threshold; the PMI of small enterprises was 48.8 percent, which was 1.3 percentage points lower than that of last month, which was lower than the threshold.
According to the classification index, the five sub-indices composing PMI, the production index and new orders index were both above the threshold, while raw materials inventory index, employment index and supplier distribution time index all stayed below the threshold.
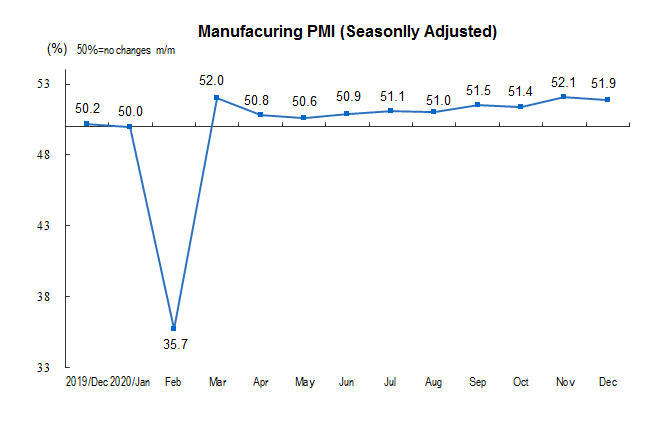
Production index was 54.2 percent, down by 0.5 percentage point from last month, but still stayed above the threshold, indicating that the growth rate of manufacturing production has slightly slowed down.
New orders index was 53.6 percent, down by 0.3 percentage point from last month, but still stayed above the threshold, indicating that the demand of the manufacturing industry continued to improve.
The inventory index of raw materials was 48.6 percent, unchanged with last month, indicating that the inventory of major raw materials in the manufacturing industry has declined over the previous month.
The employment index was 49.6 percent, slightly up 0.1 percentage point from the previous month, indicating a slight improvement in the employment outlook of manufacturing enterprises.
The supplier delivery time index was 49.9 percent, which was 0.2 percentage point lower than the previous month, indicating that the delivery time of raw material suppliers in manufacturing industry was slightly slower than that of last month.

2. Non-manufacturing purchasing managers index
In December, the non-manufacturing business activity index was 55.7 percent, which was 0.7 percentage point lower than that of last month, but it continued to be in a relatively high economic zone, and the non-manufacturing industry continued to recover steadily.
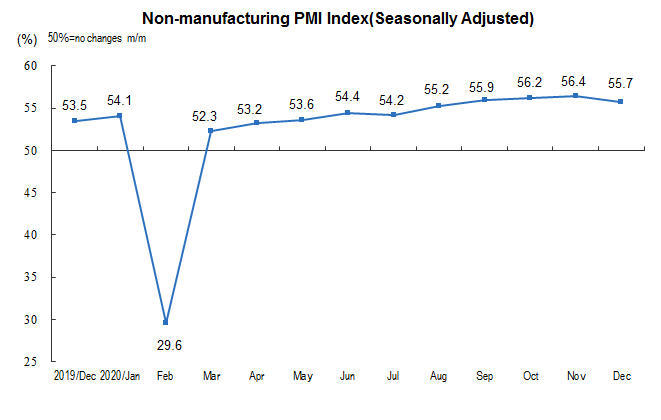
In terms of industry, the construction industry business activity index was 60.7 percent, 0.2 percentage point higher than that of last month. The business activity index of service industry was 54.8 percent, 0.9 percentage point lower than that of last month. From the perspective of industry situation, the business activity index of air transportation, post, telecommunication, radio and television satellite transmission services, monetary and financial services, and capital market services was in the high prosperity range of more than 60.0 percent; the business activity index of catering, real estate, ecological protection and environmental governance stayed below the threshold.
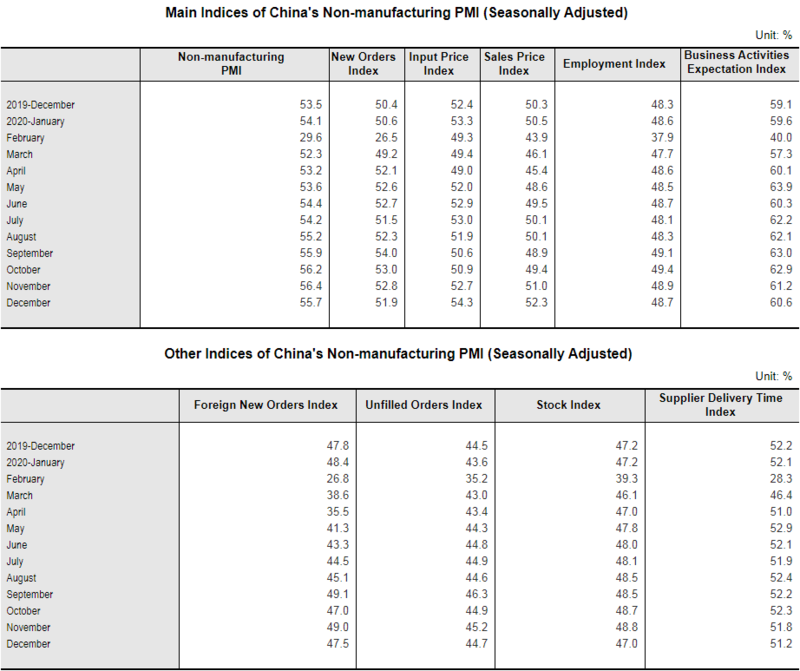
The index of new orders was 51.9 percent, down 0.9 percentage point from the previous month, indicating that the growth of demand in the non-manufacturing market has slowed down. By industry, the new order index of construction industry was 55.8 percent, up 1.8 percentage points from last month; the new order index of service industry was 51.2 percent, down 1.4 percentage points from last month.
The price index of inputs was 54.3 percent, up 1.6 percentage points from last month, indicating that the prices of inputs used by non-manufacturing enterprises for business activities continued to rise. By industry, the price index of construction inputs was 61.2 percent, up 3.7 percentage points from last month; the price index of service inputs was 53.1 percent, up 1.2 percentage points from last month.
The sales price index was 52.3 percent, up 1.3 percentage points from last month, indicating that the overall sales price of non-manufacturing industry continued to rise. By industry, the sales price index of the construction industry was 54.0 percent, up 2.7 percentage points from the previous month; the sales price index of the service industry was 52.0 percent, up 1.1 percentage points from the previous month.
The employment index was 48.7 percent, down 0.2 percentage point from the previous month, indicating that the employment outlook of the non-manufacturing industry has dropped slightly. By industry, the employment index of construction industry was 52.7 percent, down 1.7 percentage points from last month; the employment index of service industry was 48.0 percent, up 0.1 percentage point from last month.
The expected index of business activities was 60.6 percent, down 0.6 percentage point from last month, but it continued to be in the high economic zone, indicating that most non-manufacturing enterprises were still optimistic about the stable recovery of the industry. In terms of different industries, the expected index of business activities in the construction industry was 63.5 percent, up 1.7 percentage points from last month; the expected index of business activities in the service industry was 60.1 percent, down 1.0 percentage point from last month.
3. Composite PMI Output Index
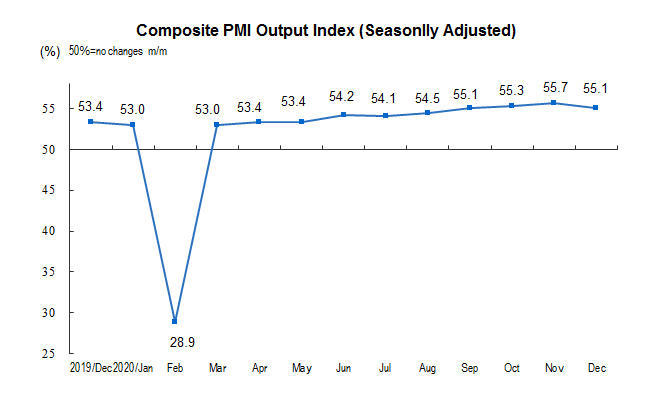
In December, the comprehensive PMI output index was 55.1 percent, which was 0.6 percentage point lower than that of last month, but it was in a relatively high boom range of more than 55.0 percent for four consecutive months, indicating that the production and operation activities of Chinese enterprises continued to recover in the near future.
![[SMM Kilat Logam Mulia]](https://imgqn.smm.cn/usercenter/OQqCm20251217171736.jpg)