Les données du Bureau national des statistiques (BNS) montrent qu'en avril 2026, les prix à la consommation nationaux ont augmenté de 1,2 % en glissement annuel. Plus précisément, les zones urbaines ont enregistré une hausse de 1,2 % et les zones rurales de 1,0 % ; les prix alimentaires ont baissé de 1,6 %, tandis que les prix non alimentaires ont augmenté de 1,8 % ; les prix des biens de consommation ont augmenté de 1,4 % et les prix des services de 0,9 %. En moyenne de janvier à avril, les prix à la consommation nationaux ont augmenté de 0,9 % par rapport à la même période de l'année précédente. En avril, les prix à la consommation nationaux ont augmenté de 0,3 % en glissement mensuel. Plus précisément, les zones urbaines ont enregistré une hausse de 0,3 % et les zones rurales de 0,1 % ; les prix alimentaires ont baissé de 1,6 %, tandis que les prix non alimentaires ont augmenté de 0,7 % ; les prix des biens de consommation ont augmenté de 0,1 % et les prix des services de 0,5 %. En avril 2026, les prix départ usine des producteurs industriels ont augmenté de 2,8 % en glissement annuel et de 1,7 % en glissement mensuel. Les prix d'achat des producteurs industriels ont augmenté de 3,5 % en glissement annuel et de 2,1 % en glissement mensuel. En moyenne de janvier à avril, les prix départ usine des producteurs industriels ont augmenté de 0,2 % par rapport à la même période de l'année précédente, et les prix d'achat des producteurs industriels de 0,5 %.
Les prix à la consommation ont augmenté de 1,2 % en glissement annuel en avril 2026
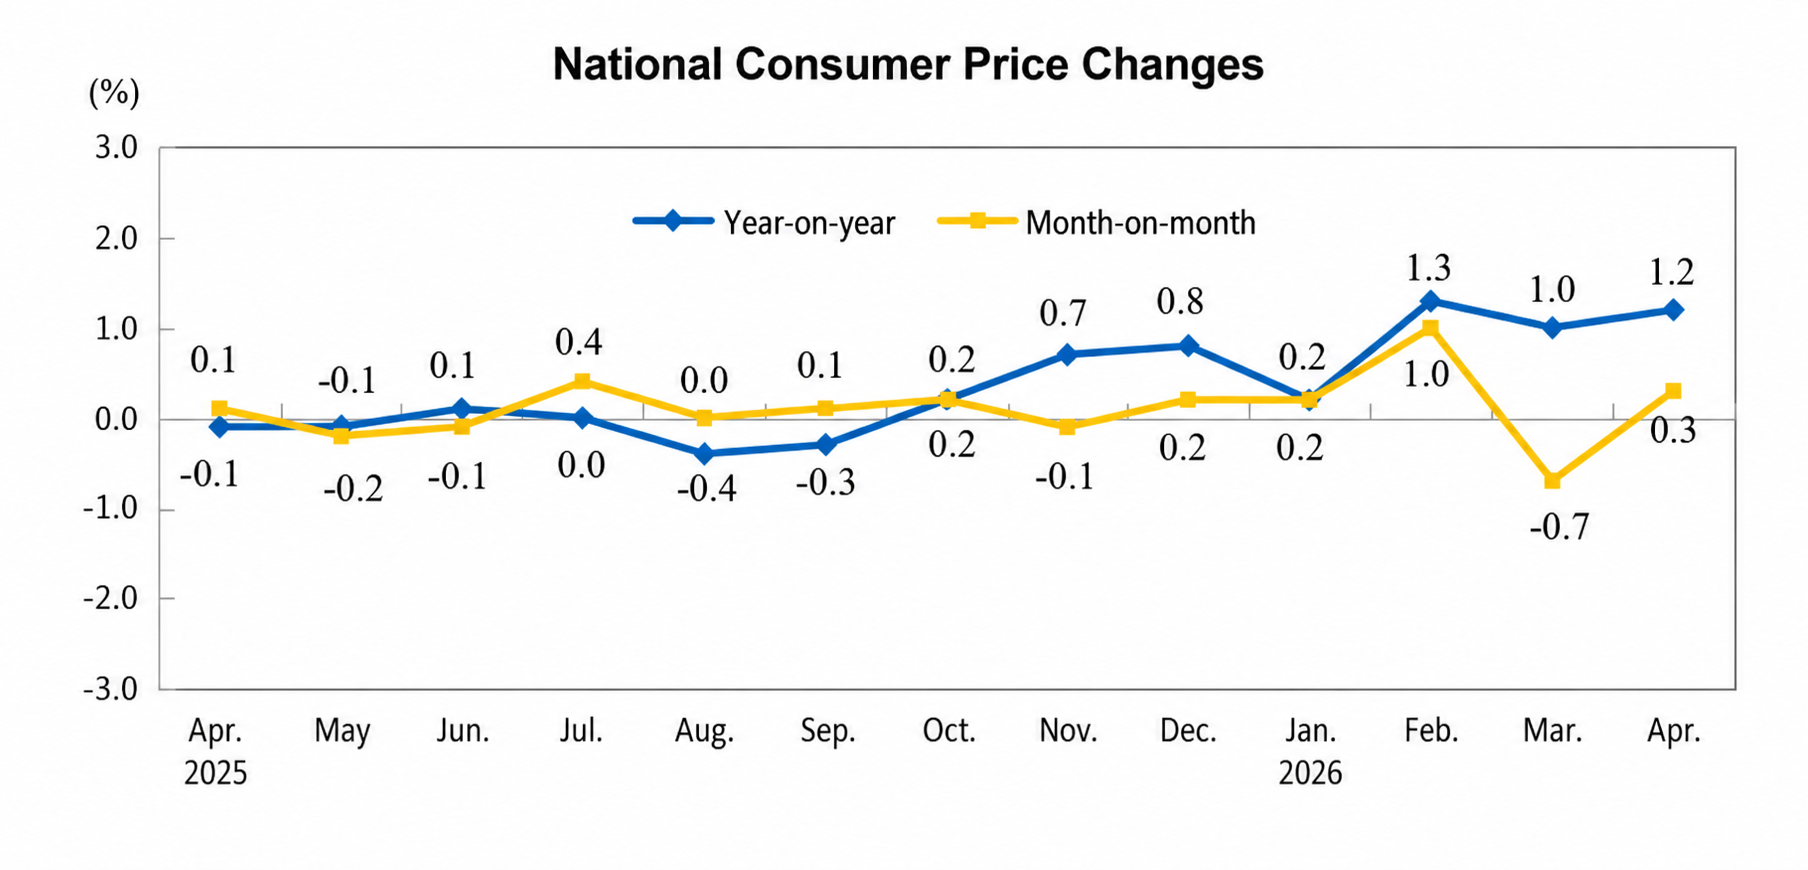
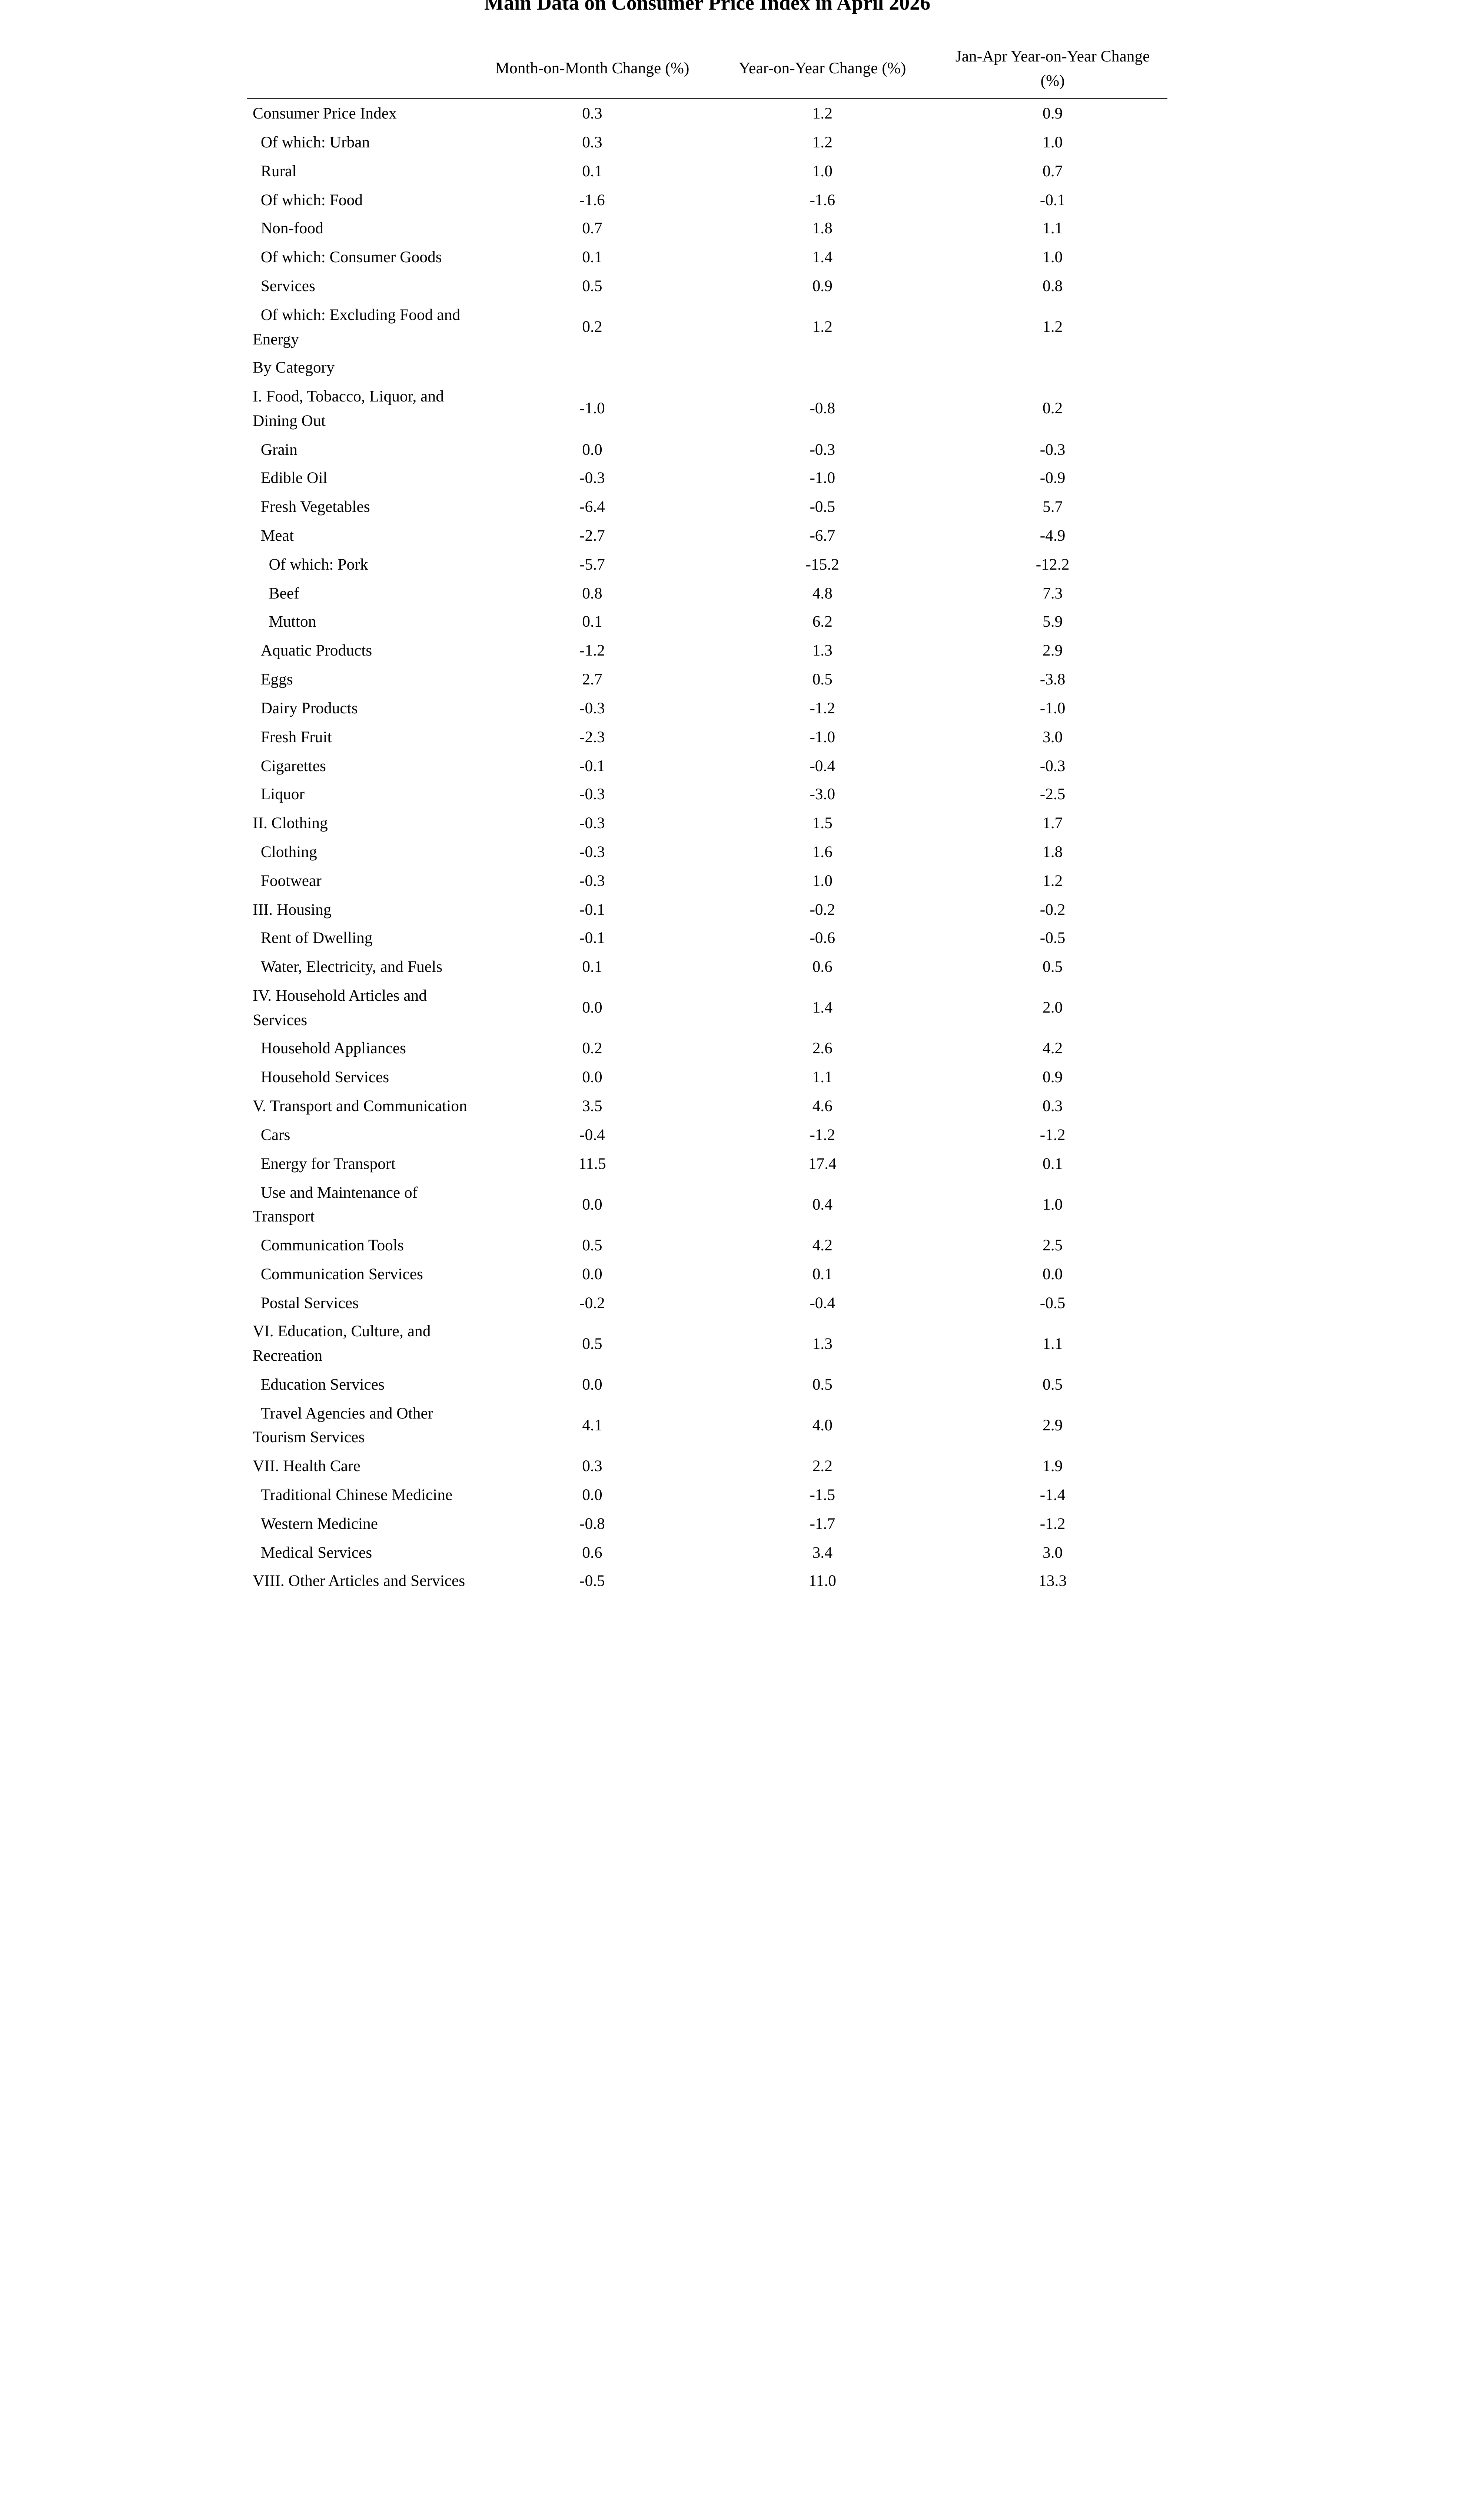
En avril 2026, les prix à la consommation nationaux ont augmenté de 1,2 % en glissement annuel. Plus précisément, les zones urbaines ont enregistré une hausse de 1,2 % et les zones rurales de 1,0 % ; les prix alimentaires ont baissé de 1,6 %, tandis que les prix non alimentaires ont augmenté de 1,8 % ; les prix des biens de consommation ont augmenté de 1,4 % et les prix des services de 0,9 %. En moyenne de janvier à avril, les prix à la consommation nationaux ont augmenté de 0,9 % par rapport à la même période de l'année précédente.
En avril, les prix à la consommation nationaux ont augmenté de 0,3 % en glissement mensuel. Plus précisément, les zones urbaines ont enregistré une hausse de 0,3 % et les zones rurales de 0,1 % ; les prix alimentaires ont baissé de 1,6 %, tandis que les prix non alimentaires ont augmenté de 0,7 % ; les prix des biens de consommation ont augmenté de 0,1 % et les prix des services de 0,5 %.
I. Variations en glissement annuel des prix des différentes catégories de biens et services
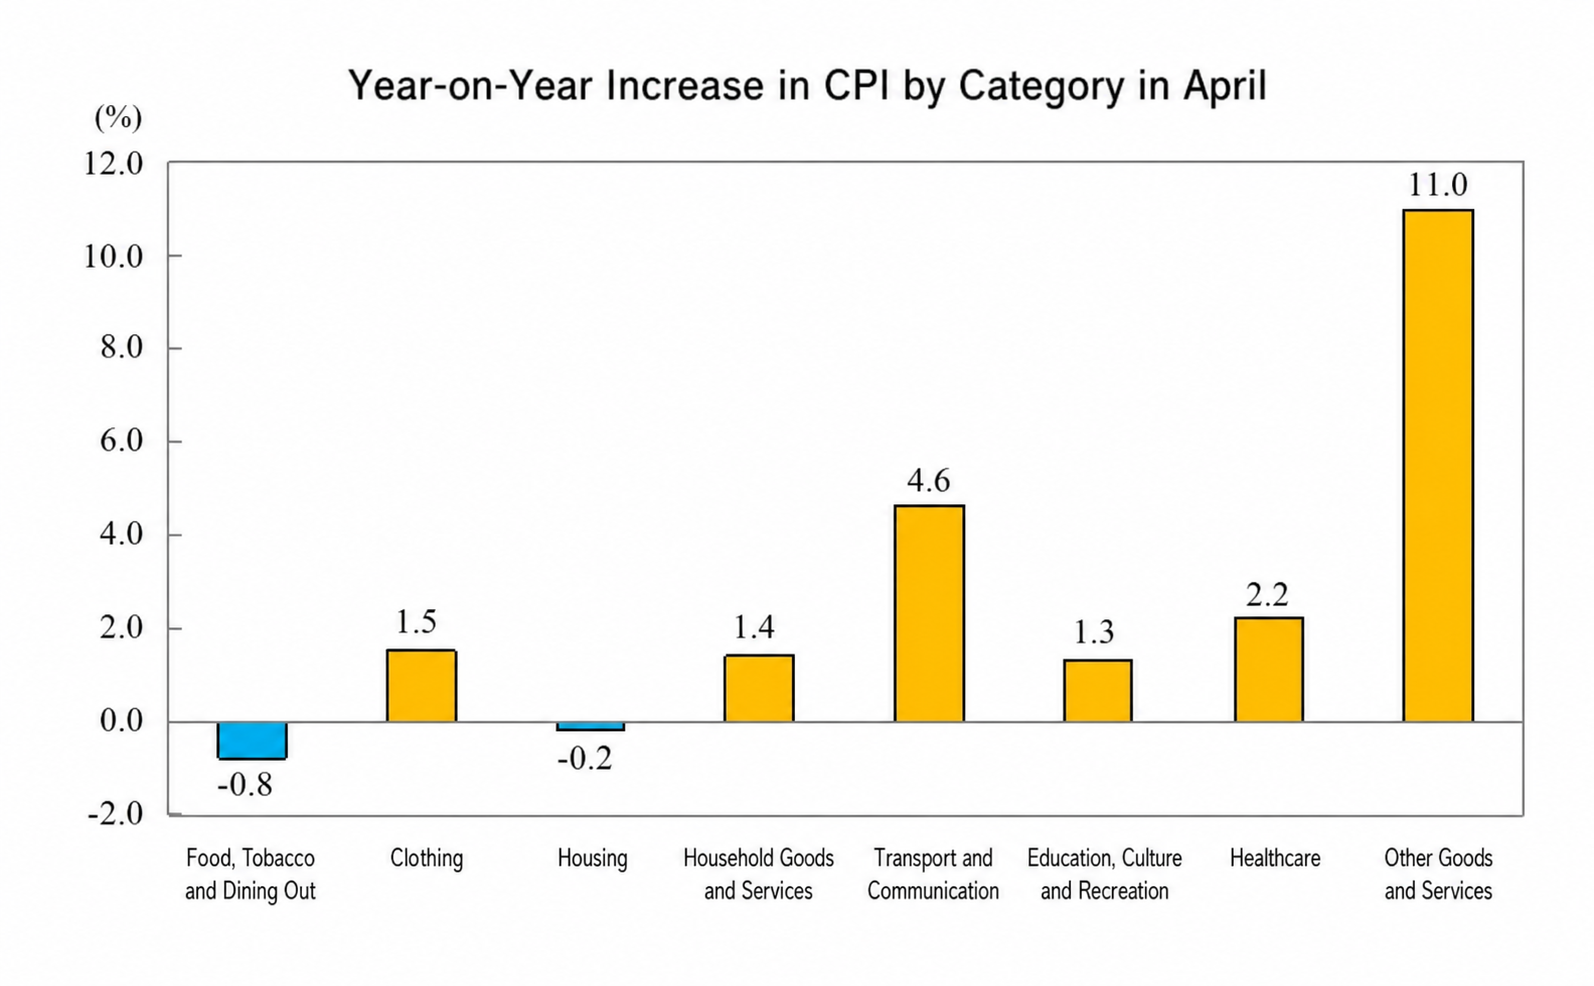
En avril, les prix de l'alimentation, du tabac, de l'alcool et de la restauration ont baissé de 0,8 % en glissement annuel, tirant l'IPC vers le bas d'environ 0,24 point de pourcentage. Parmi les produits alimentaires, les prix de la viande d'élevage ont baissé de 6,7 %, tirant l'IPC vers le bas d'environ 0,28 point de pourcentage, dont les prix du porc ont baissé de 15,2 %, tirant l'IPC vers le bas d'environ 0,29 point de pourcentage ; les prix des fruits frais ont baissé de 1,0 %, tirant l'IPC vers le bas d'environ 0,02 point de pourcentage ; les prix des légumes frais ont baissé de 0,5 %, tirant l'IPC vers le bas d'environ 0,01 point de pourcentage ; les prix des produits aquatiques ont augmenté de 1,3 %, poussant l'IPC vers le haut d'environ 0,02 point de pourcentage.
Parmi les sept autres catégories principales, six ont enregistré des hausses en glissement annuel et une a connu une baisse. Plus précisément, les prix des autres fournitures et services, des transports et communications, et des soins de santé ont augmenté respectivement de 11,0 %, 4,6 % et 2,2 % ; les prix de l'habillement, des articles et services ménagers, et de l'éducation, la culture et les loisirs ont augmenté respectivement de 1,5 %, 1,4 % et 1,3 % ; les prix du logement ont baissé de 0,2 %.
II. Variations mensuelles des prix des différentes catégories de biens et services
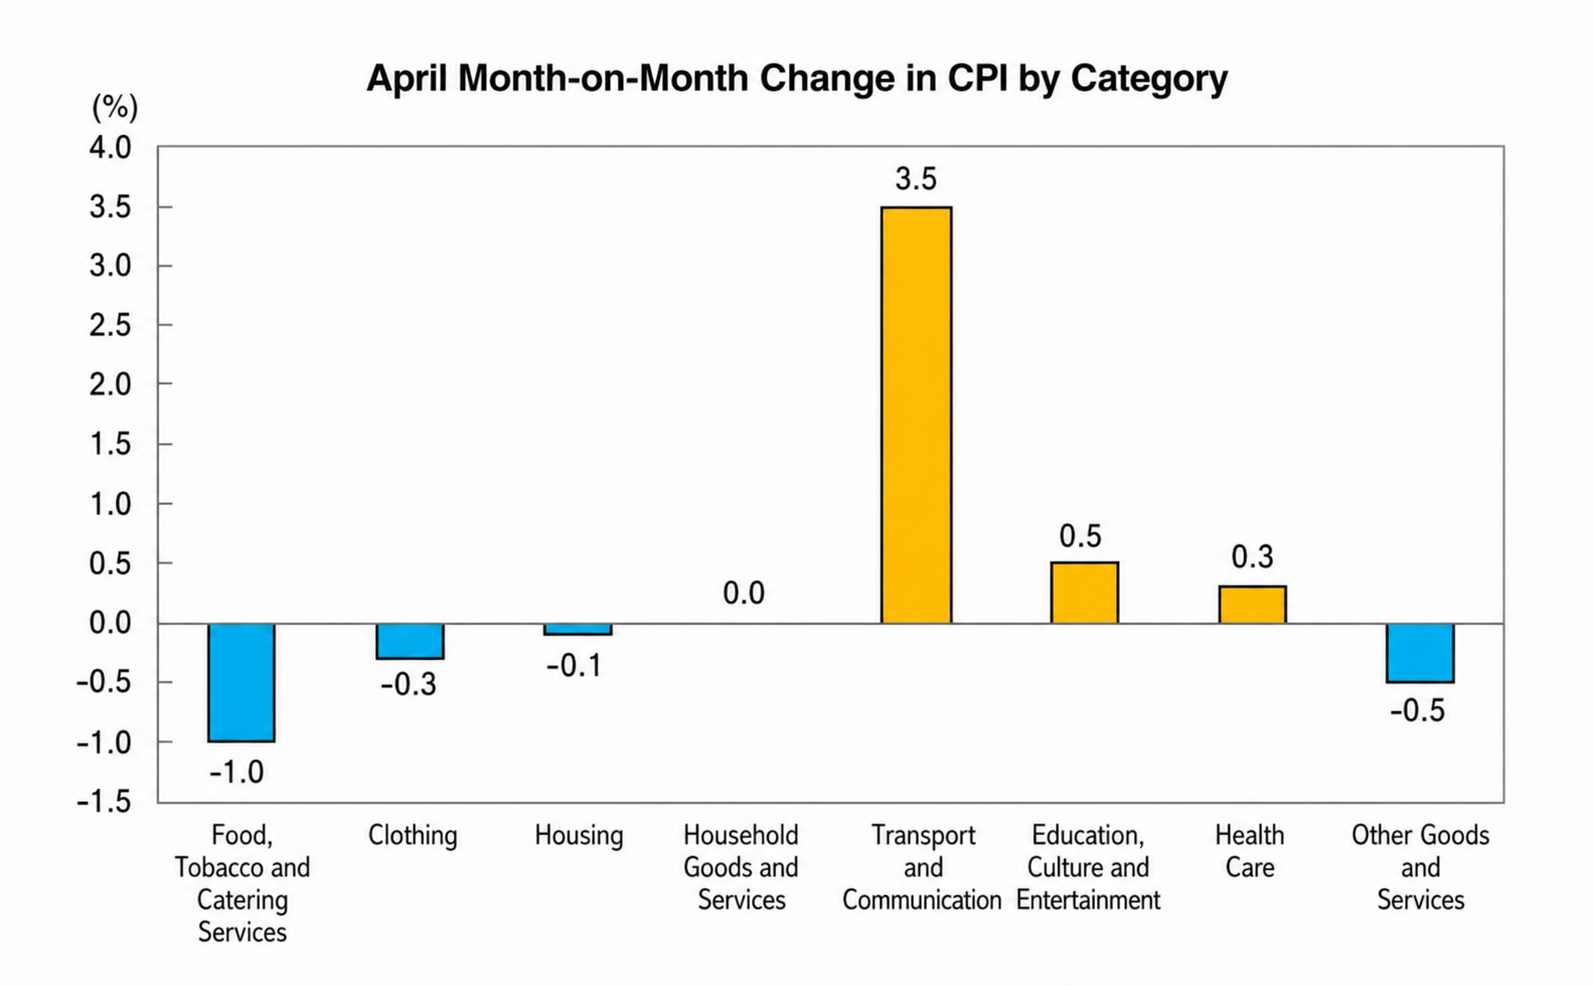
En avril, les prix des produits alimentaires, du tabac, de l'alcool et de la restauration ont baissé de 1,0 % en glissement mensuel, tirant l'IPC vers le bas d'environ 0,28 point de pourcentage. Parmi les produits alimentaires, les prix des légumes frais ont baissé de 6,4 %, tirant l'IPC vers le bas d'environ 0,11 point de pourcentage ; les prix de la viande de bétail ont baissé de 2,7 %, tirant l'IPC vers le bas d'environ 0,11 point de pourcentage, dont les prix du porc ont baissé de 5,7 %, tirant l'IPC vers le bas d'environ 0,10 point de pourcentage ; les prix des fruits frais ont baissé de 2,3 %, tirant l'IPC vers le bas d'environ 0,05 point de pourcentage ; les prix des produits aquatiques ont baissé de 1,2 %, tirant l'IPC vers le bas d'environ 0,02 point de pourcentage ; les prix des œufs ont augmenté de 2,7 %, poussant l'IPC vers le haut d'environ 0,01 point de pourcentage.
Parmi les sept autres catégories principales, les prix ont augmenté dans trois, sont restés stables dans une et ont baissé dans trois en glissement mensuel. Plus précisément, les prix des transports et communications, de l'éducation, la culture et les loisirs, et des soins de santé ont augmenté respectivement de 3,5 %, 0,5 % et 0,3 % ; les prix des articles et services ménagers sont restés stables ; les prix des autres biens et services, de l'habillement et du logement ont baissé respectivement de 0,5 %, 0,3 % et 0,1 %.
Prix départ usine des producteurs industriels en hausse de 2,8 % en glissement annuel et de 1,7 % en glissement mensuel en avril 2026
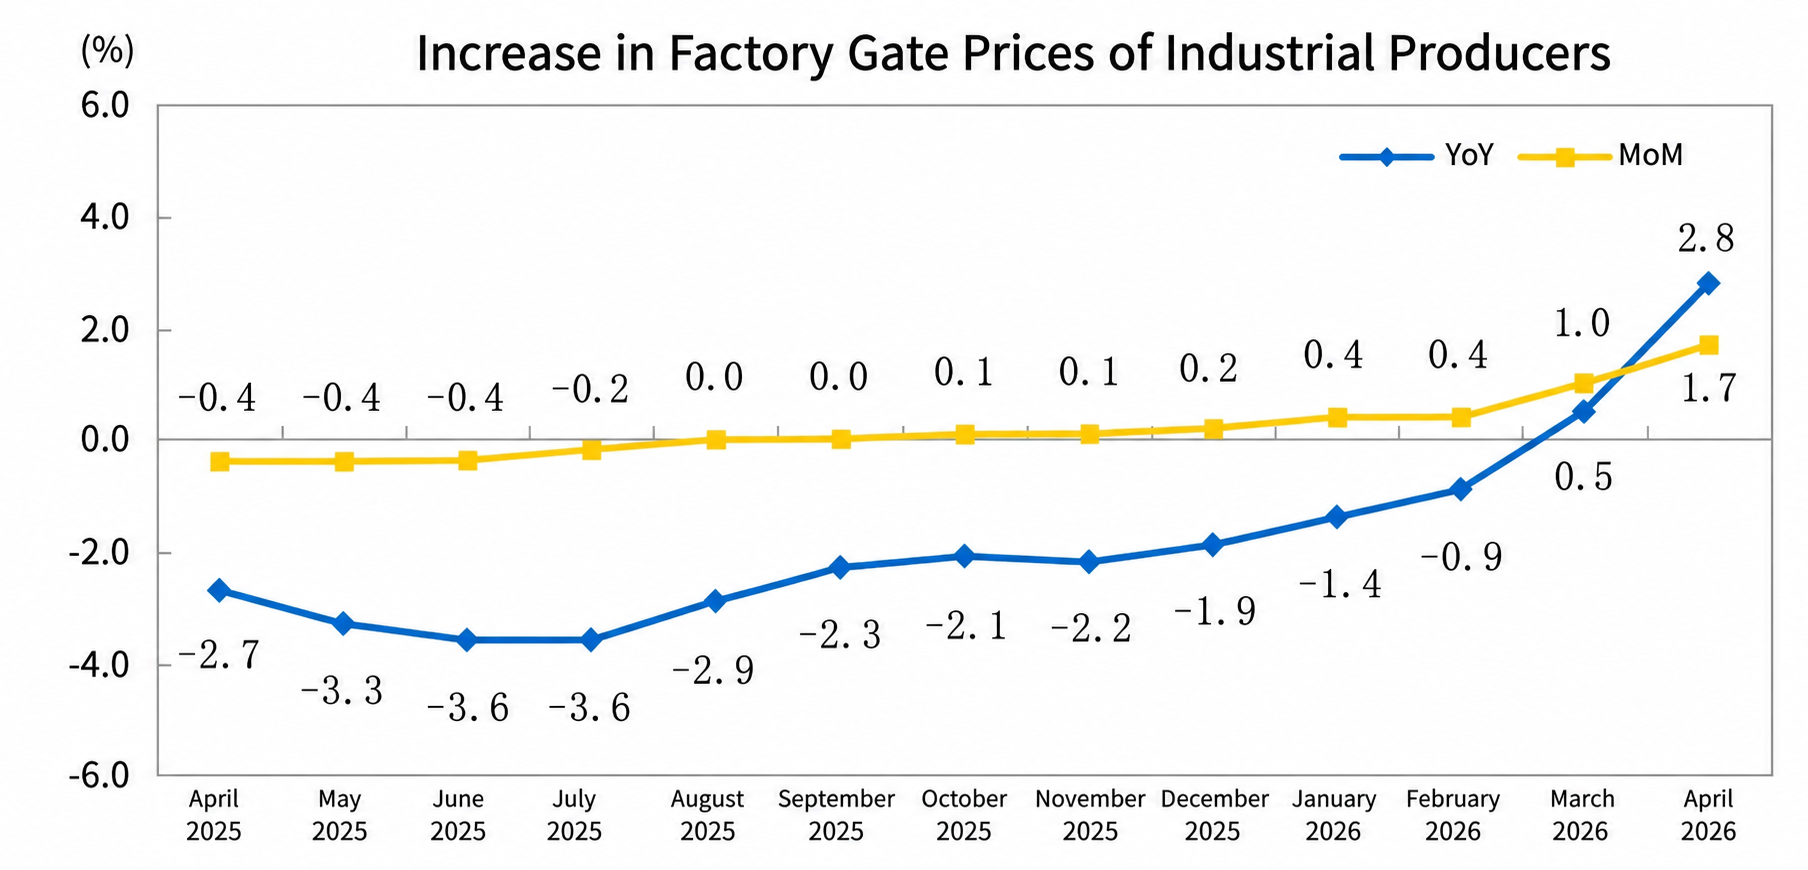
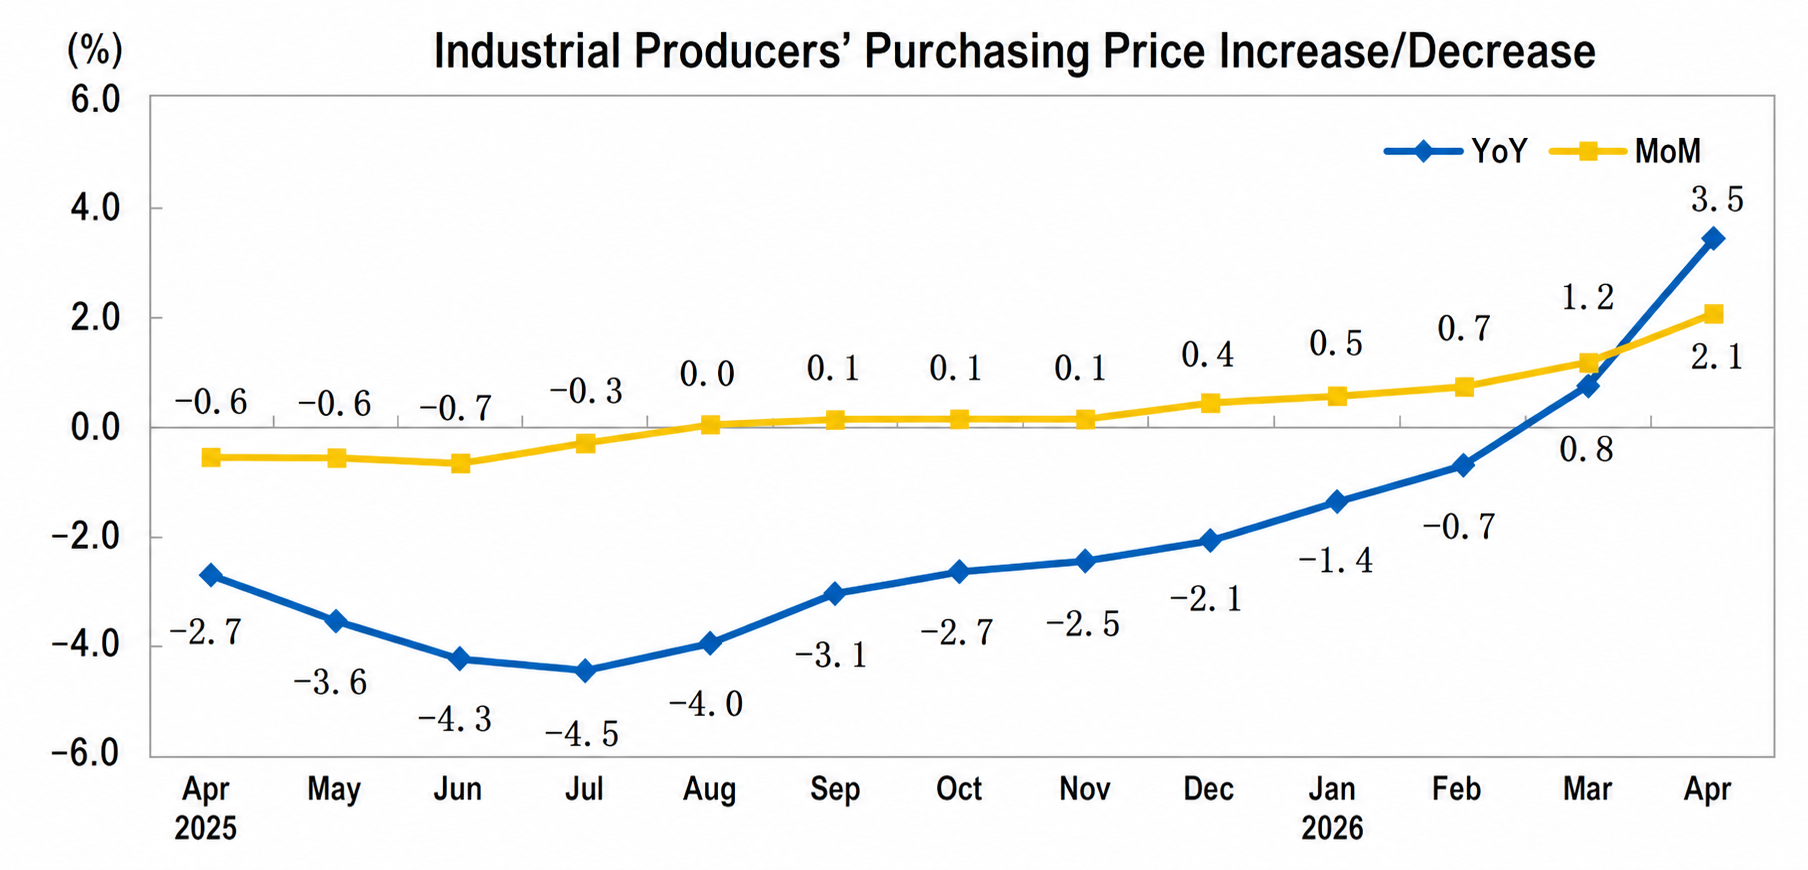
En avril 2026, les prix départ usine des producteurs industriels au niveau national ont augmenté de 2,8 % en glissement annuel et de 1,7 % en glissement mensuel. Les prix d'achat des producteurs industriels ont augmenté de 3,5 % en glissement annuel et de 2,1 % en glissement mensuel. En moyenne sur la période janvier-avril, les prix départ usine des producteurs industriels ont augmenté de 0,2 % par rapport à la même période de l'année précédente, et les prix d'achat des producteurs industriels ont augmenté de 0,5 %.
I. Variations en glissement annuel des prix à la production industrielle
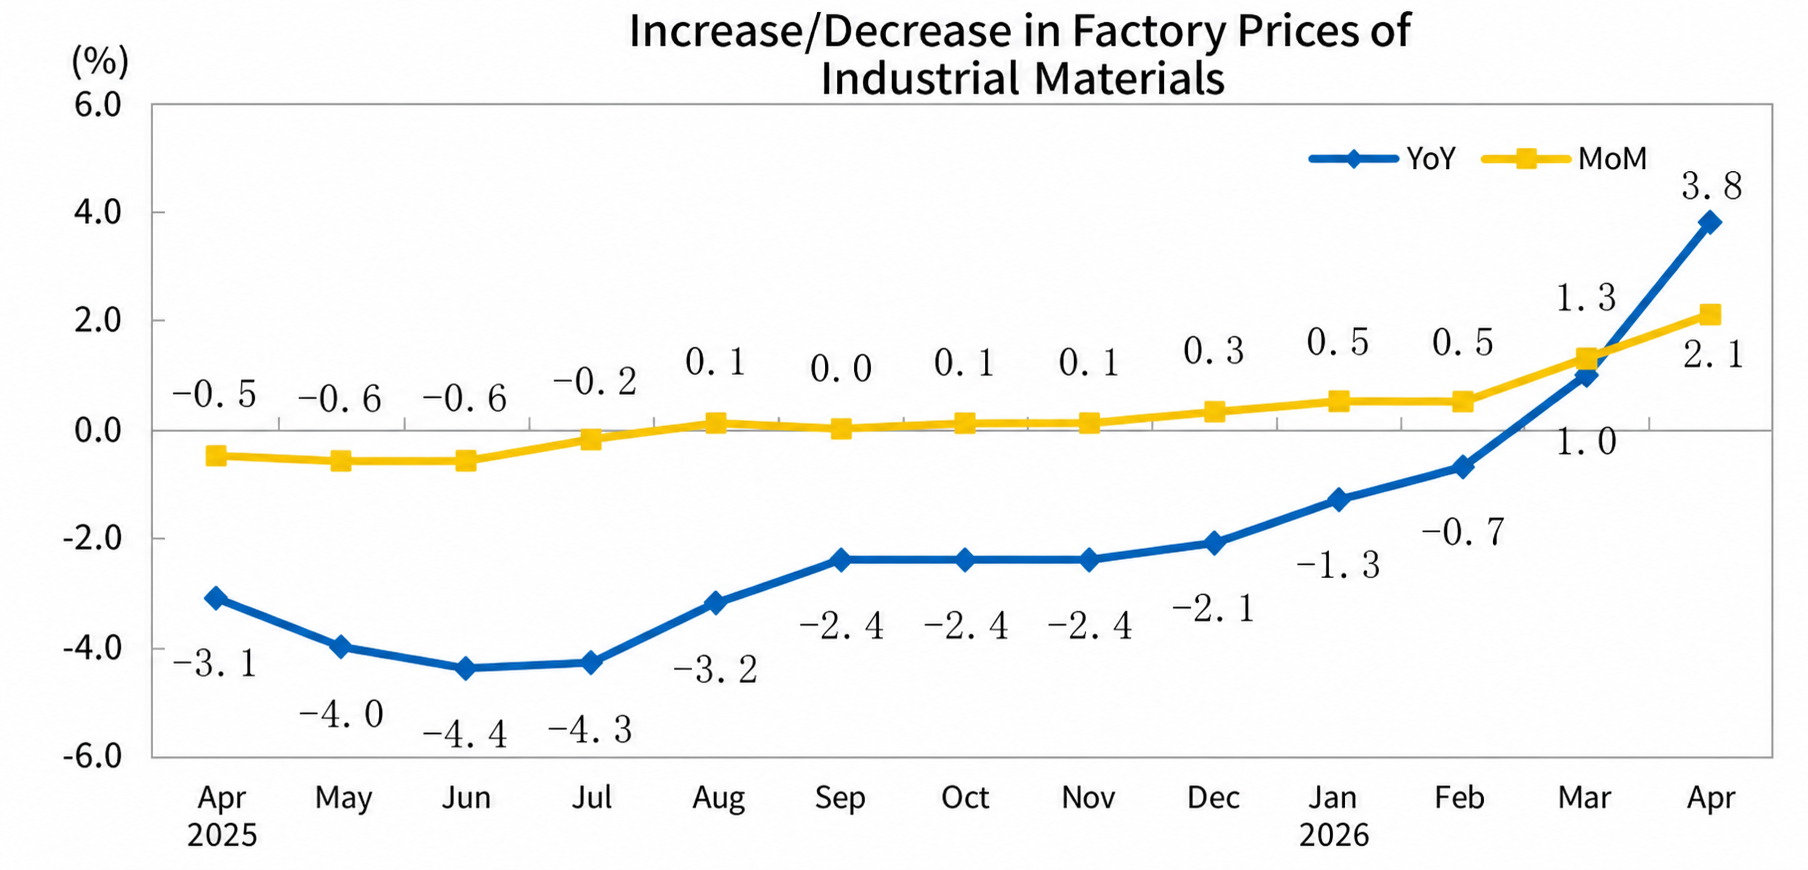
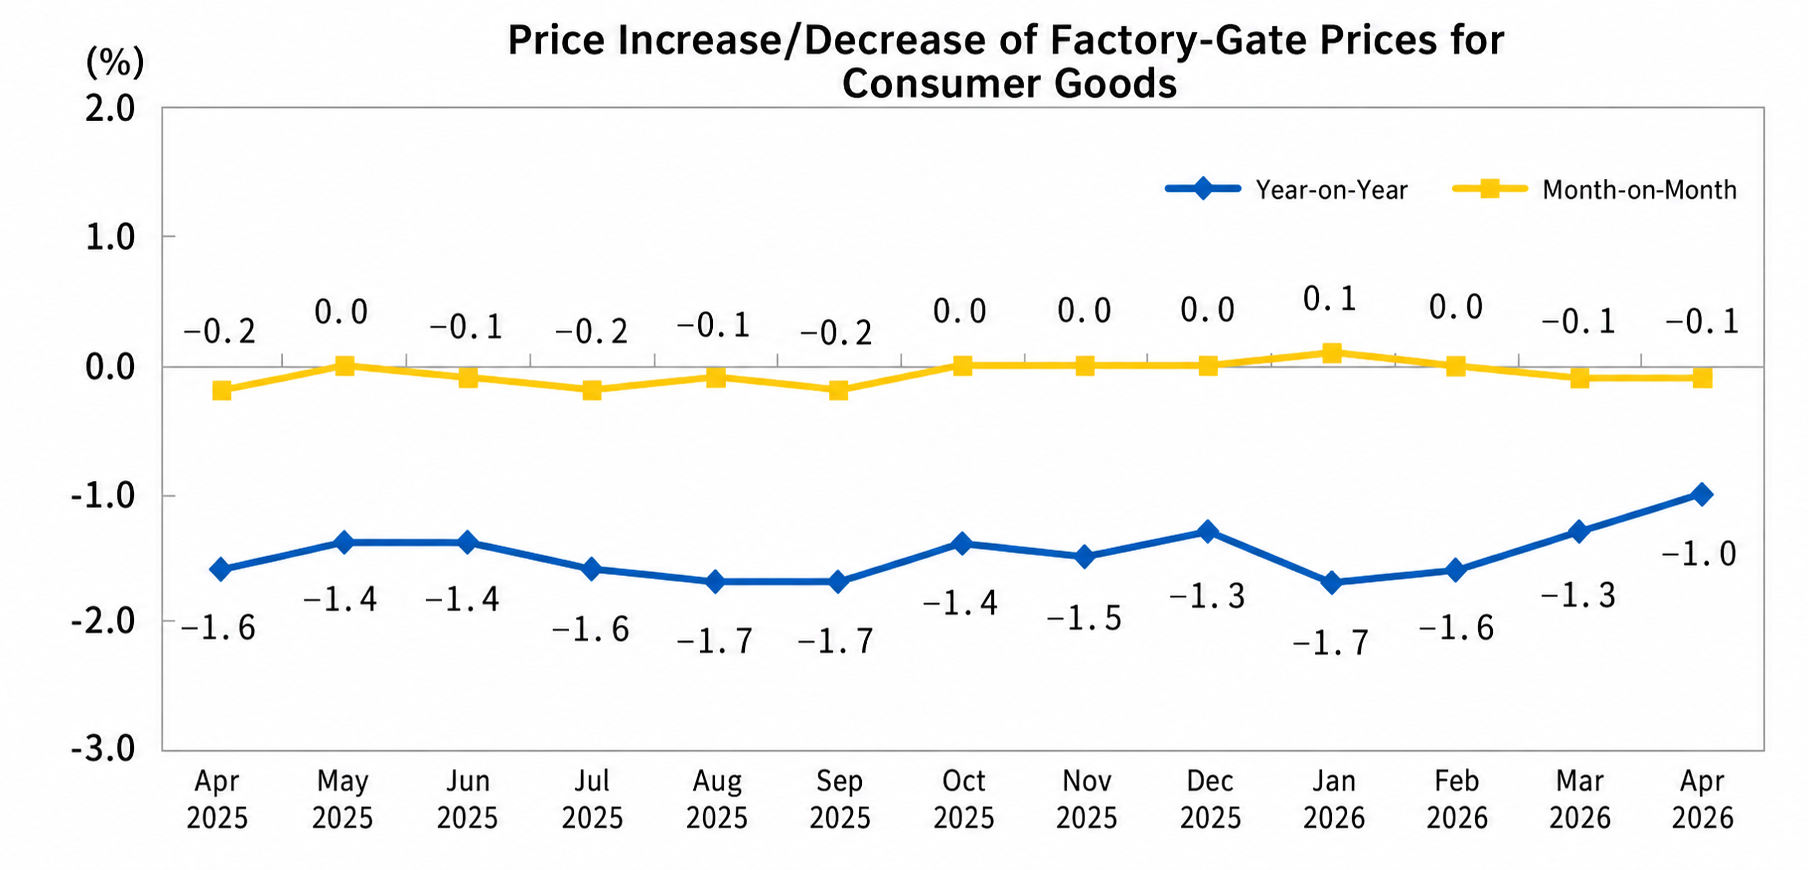
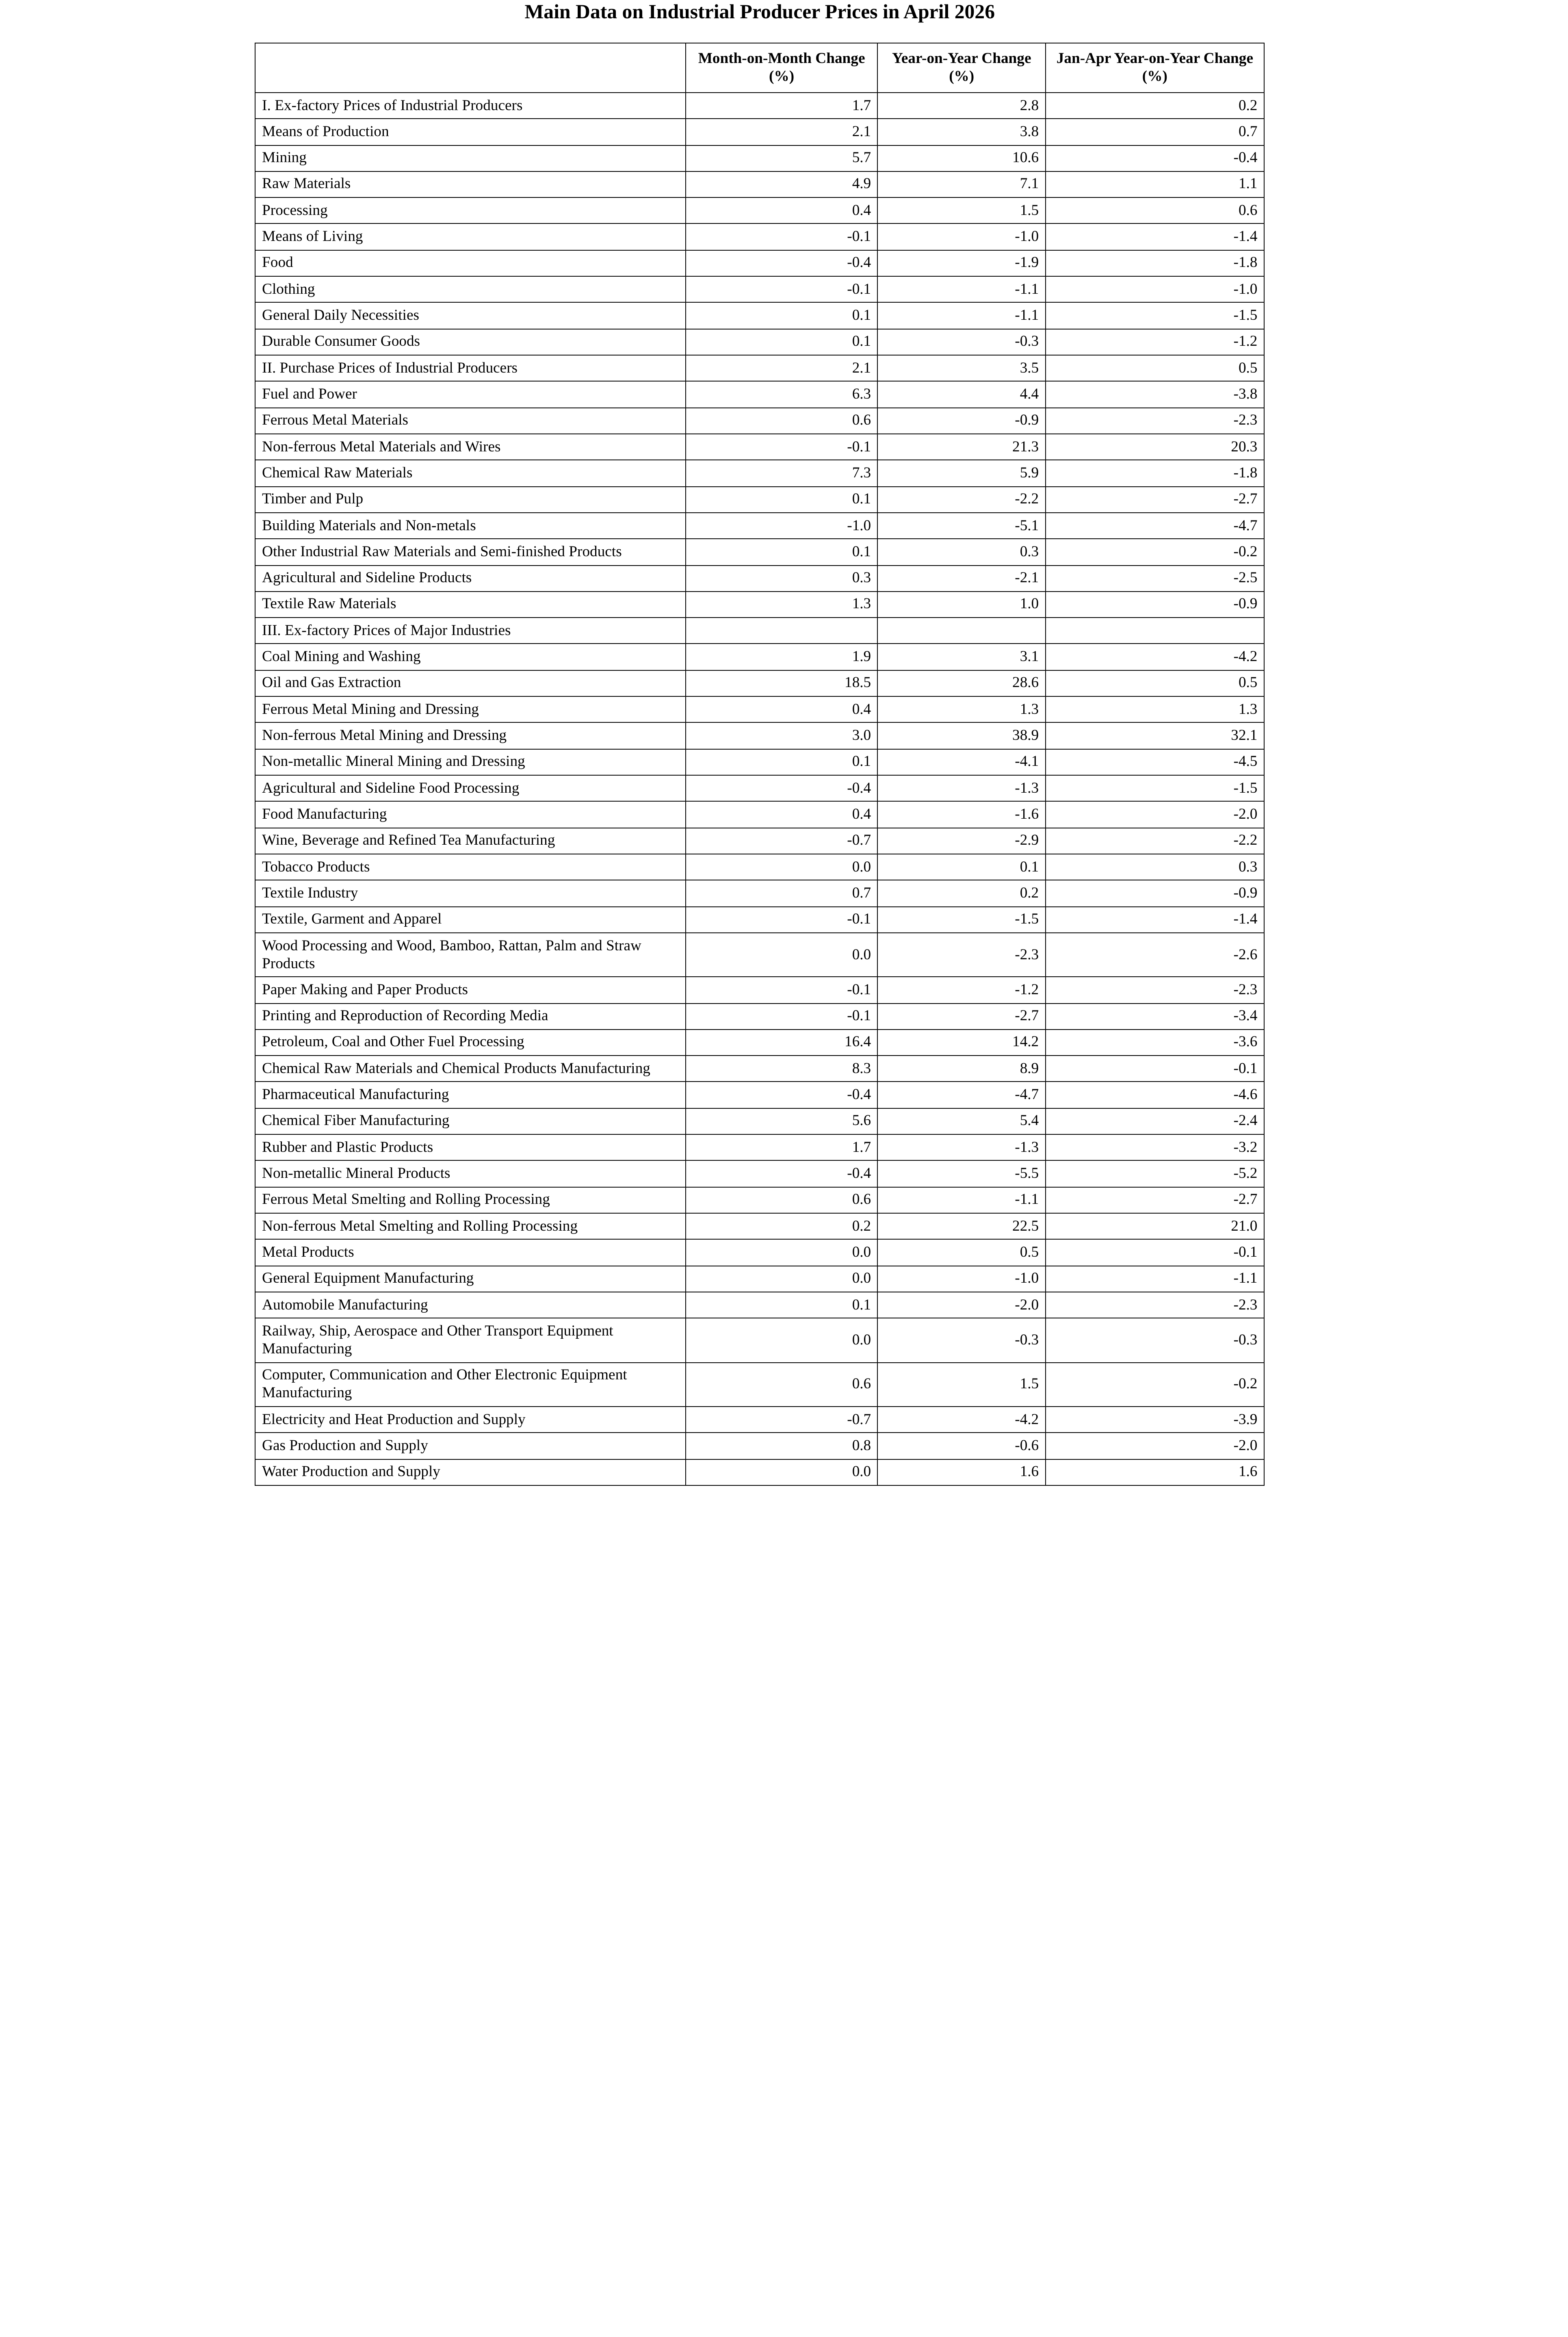
En avril, parmi les prix départ usine des producteurs industriels, les prix des moyens de production ont augmenté de 3,8 %, poussant le niveau global des prix départ usine des producteurs industriels vers le haut d'environ 2,98 points de pourcentage. Spécifiquement, les prix des industries extractives ont augmenté de 10,6 %, ceux des industries de matières premières de 7,1 %, et ceux des industries de transformation de 1,5 %. Les prix des biens de consommation ont baissé de 1,0 %, tirant vers le bas le niveau global des prix départ usine des producteurs industriels d'environ 0,23 point de pourcentage. Spécifiquement, les prix alimentaires ont baissé de 1,9 %, les prix de l'habillement et des produits de consommation courante ont tous deux baissé de 1,1 %, et les prix des biens de consommation durables ont baissé de 0,3 %.
Parmi les prix d'achat des producteurs industriels, les prix des matériaux en métaux non ferreux et fils ont augmenté de 21,3 %, les matières premières chimiques de 5,9 %, les combustibles et l'énergie de 4,4 %, et les matières premières textiles de 1,0 % ; les prix des matériaux de construction et minéraux non métalliques ont baissé de 5,1 %, les sous-produits agricoles de 2,1 %, et les matériaux en métaux ferreux de 0,9 %.
II. Variations mensuelles des prix à la production industrielle
En avril, parmi les prix départ usine des producteurs industriels, les prix des biens de production ont augmenté de 2,1 %, contribuant à environ 1,68 point de pourcentage à la hausse globale des prix départ usine des producteurs industriels. Spécifiquement, les prix des industries extractives ont augmenté de 5,7 %, ceux des industries de matières premières de 4,9 %, et ceux des industries de transformation de 0,4 %. Les prix des biens de consommation ont baissé de 0,1 %, tirant vers le bas le niveau global des prix départ usine des producteurs industriels d'environ 0,02 point de pourcentage. Spécifiquement, les prix alimentaires ont baissé de 0,4 %, les prix de l'habillement de 0,1 %, et les prix des produits de consommation courante et des biens de consommation durables ont tous deux augmenté de 0,1 %.
Parmi les prix d'achat des producteurs industriels, les prix des matières premières chimiques ont augmenté de 7,3 %, les combustibles et l'énergie de 6,3 %, les matières premières textiles de 1,3 %, les métaux ferreux de 0,6 %, et les sous-produits agricoles de 0,3 % ; les prix des matériaux de construction et minéraux non métalliques ont baissé de 1,0 %, et les métaux non ferreux et fils de 0,1 %.
Avril 2026 : l'IPC a légèrement rebondi, la croissance de l'IPP s'est élargie
— Interprétation des données de l'IPC et de l'IPP d'avril 2026 par Dong Lijuan, statisticienne en chef de la Division urbaine du Bureau national des statistiques (BNS)
En avril, sous l'influence des variations des prix internationaux du pétrole brut et de l'augmentation de la demande de voyages pendant les vacances, l'indice des prix à la consommation (IPC) a augmenté de 0,3 % en glissement mensuel et de 1,2 % en glissement annuel. L'IPC de base, hors prix alimentaires et énergétiques, a augmenté de 1,2 % en glissement annuel, maintenant un léger rebond. Sous l'effet de la hausse rapide des prix internationaux des matières premières, de l'augmentation de la demande dans certaines industries nationales et de l'optimisation continue de l'ordre concurrentiel du marché, l'indice des prix à la production (IPP) a augmenté de 1,7 % en glissement mensuel et de 2,8 % en glissement annuel, avec des taux de croissance en expansion par rapport au mois précédent.
I. Léger rebond de l'IPC
En glissement mensuel, l'IPC national est passé d'une baisse de 0,7 % le mois précédent à une hausse de 0,3 %, soit 0,4 point de pourcentage au-dessus du niveau saisonnier, principalement porté par la hausse des prix de l'énergie et des services de voyage. Sous l'effet des fluctuations des prix internationaux du pétrole brut, les prix de l'énergie en Chine ont augmenté de 5,7 %, avec une hausse en expansion de 0,9 point de pourcentage par rapport au mois précédent, contribuant à environ 0,39 point de pourcentage à la hausse mensuelle de l'IPC. Parmi ceux-ci, les prix de l'essence ont augmenté de 12,6 %. Les prix des services sont passés d'une baisse de 1,1 % le mois précédent à une hausse de 0,5 %, soit 0,2 point de pourcentage au-dessus du niveau saisonnier, contribuant à environ 0,22 point de pourcentage à la hausse mensuelle de l'IPC. Plus précisément, portée par les congés de la fête de Qingming, les congés de la fête du Travail et les vacances de printemps dans certaines régions, la demande de services de voyage a augmenté significativement, avec des hausses de prix des billets d'avion, de la location de véhicules, des frais d'agences de voyage et de l'hébergement hôtelier de 29,2 %, 8,6 %, 4,5 % et 3,9 % respectivement, dépassant tous les niveaux saisonniers. Ces quatre postes combinés ont contribué à environ 0,17 point de pourcentage à la hausse mensuelle de l'IPC ; les prix des services médicaux ont augmenté de 0,6 %, contribuant à environ 0,04 point de pourcentage à la hausse mensuelle de l'IPC. Les prix alimentaires ont baissé de 1,6 %, avec un recul se réduisant de 1,1 point de pourcentage par rapport au mois précédent, pesant sur l'IPC d'environ 0,28 point de pourcentage en glissement mensuel. Dans l'alimentation, avec le réchauffement climatique, de grandes quantités de légumes frais et de fruits frais sont arrivées sur le marché, avec des baisses de prix de 6,4 % et 2,3 % respectivement ; le porc et les produits aquatiques étaient en offre abondante, avec des baisses de prix de 5,7 % et 1,2 % respectivement. Ces quatre postes combinés ont pesé sur l'IPC d'environ 0,28 point de pourcentage en glissement mensuel. Les prix des œufs ont augmenté de 3,4 %, contribuant à environ 0,01 point de pourcentage à la croissance mensuelle de l'IPC. Hors énergie, les prix des biens de consommation industriels ont baissé de 0,2 %, restant globalement stables.
En glissement annuel, l'IPC national a augmenté de 1,2 %, avec une hausse en expansion de 0,2 point de pourcentage par rapport au mois précédent. Les prix des biens de consommation industriels ont augmenté de 3,5 % ce mois-ci, la hausse s'élargissant de 1,3 point de pourcentage par rapport au mois précédent, contribuant à environ 1,06 point de pourcentage à la croissance de l'IPC en glissement annuel. Parmi les biens de consommation industriels, affectés par les fluctuations des prix internationaux des matières premières, les prix de l'essence et de la joaillerie en or en Chine ont connu des variations significatives. Plus précisément, la hausse des prix de l'essence s'est élargie à 19,3 %, contribuant à environ 0,56 point de pourcentage à la croissance de l'IPC en glissement annuel ; la hausse des prix de la joaillerie en or s'est repliée à 46,9 %, contribuant à environ 0,2 point de pourcentage à la croissance de l'IPC en glissement annuel ; les prix de l'électroménager et de l'habillement ont augmenté respectivement de 2,6 % et 1,6 %, contribuant ensemble à environ 0,11 point de pourcentage à la croissance de l'IPC en glissement annuel. Les prix des services ont augmenté de 0,9 %, la hausse s'élargissant de 0,1 point de pourcentage par rapport au mois précédent, contribuant à environ 0,44 point de pourcentage à la croissance de l'IPC en glissement annuel. Parmi les services, les prix des services publics de base sont restés globalement stables, les prix des services médicaux et des services éducatifs ayant augmenté respectivement de 3,4 % et 0,5 %, contribuant ensemble à environ 0,25 point de pourcentage à la croissance de l'IPC en glissement annuel ; la hausse des prix des services touristiques s'est quelque peu élargie, augmentant de 3,7 % ce mois-ci, contribuant à environ 0,13 point de pourcentage à la croissance de l'IPC en glissement annuel ; les prix des services de main-d'œuvre ont légèrement augmenté, les prix des services pour animaux de compagnie, de la restauration, des services domestiques et de la réparation et l'entretien de véhicules ayant augmenté entre 1,1 % et 1,4 %, contribuant ensemble à environ 0,1 point de pourcentage à la croissance de l'IPC en glissement annuel. Les prix alimentaires sont passés d'une hausse de 0,3 % le mois précédent à une baisse de 1,6 %. Parmi les produits alimentaires, les prix du porc ont chuté de 15,2 %, la baisse s'élargissant de 3,7 points de pourcentage par rapport au mois précédent, tirant l'IPC en glissement annuel vers le bas d'environ 0,29 point de pourcentage ; les prix des légumes frais et des fruits frais ont baissé respectivement de 0,5 % et 1,0 % ; les prix du bœuf, du mouton, des produits aquatiques et des œufs ont tous augmenté, avec des hausses comprises entre 1,0 % et 6,2 %.
II. La hausse de l'IPP s'est élargie
En glissement mensuel, l'IPP national a augmenté de 1,7 %, la hausse s'élargissant de 0,7 point de pourcentage par rapport au mois précédent. Les principales caractéristiques des variations mensuelles de l'IPP ce mois-ci étaient : premièrement, les facteurs internationaux d'importation ont fait monter les prix dans les industries pétrolières chinoises. La hausse des prix internationaux du pétrole brut a entraîné une augmentation des prix dans les industries pétrolières chinoises. Plus précisément, les prix de l'industrie d'extraction du pétrole et du gaz naturel ont augmenté de 18,5 % en glissement mensuel, ceux de l'industrie de transformation du pétrole, du charbon et d'autres combustibles de 16,4 %, ceux de l'industrie de fabrication de matières premières chimiques et de produits chimiques de 8,3 %, ceux de l'industrie de fabrication de fibres chimiques de 5,6 %, et ceux de l'industrie des produits en caoutchouc et en plastique de 1,7 %. Deuxièmement, la demande accrue dans certaines industries nationales a fait monter les prix. La croissance rapide de la demande en puissance de calcul et l'accélération de l'électrification ont entraîné une hausse des prix de fabrication de fibres optiques de 22,5 % en glissement mensuel, des dispositifs de stockage externes et composants de 3,2 %, et de l'industrie de fusion et de laminage des métaux non ferreux de 0,2 % ; la demande de réapprovisionnement en charbon thermique s'est libérée, combinée à une demande accrue de charbon non énergétique des industries chimiques et métallurgiques, faisant augmenter les prix de l'industrie d'extraction et de lavage du charbon de 1,9 % ; la poursuite de la modernisation des équipements manufacturiers a stimulé la demande d'acier, avec des prix de l'industrie de fusion et de laminage des métaux ferreux en hausse de 0,6 %. Troisièmement, l'ordre concurrentiel sur le marché chinois a continué de s'améliorer, avec des prix des industries concernées en hausse ou des baisses atténuées. La rectification approfondie de la concurrence involutive a continué de porter ses fruits, avec des prix de fabrication de batteries lithium-ion en hausse de 1,6 % en glissement mensuel, des prix de fabrication de véhicules à énergie nouvelle en baisse de 0,1 %, la baisse se réduisant de 0,7 point de pourcentage par rapport au mois précédent.
En glissement annuel, l'IPP national a augmenté de 2,8 %, la hausse s'élargissant de 2,3 points de pourcentage par rapport au mois précédent. Parmi les principales industries dont les prix ont augmenté, l'extraction et la préparation de minerais de métaux non ferreux a progressé de 38,9 %, la fusion et le laminage des métaux non ferreux de 22,5 %, contribuant ensemble à environ 1,58 point de pourcentage à la hausse annuelle de l'IPP ; l'extraction de pétrole et de gaz naturel a augmenté de 28,6 %, la transformation du pétrole, du charbon et d'autres combustibles de 14,2 %, la fabrication de matières premières chimiques et de produits chimiques de 8,9 %, contribuant ensemble à environ 1,5 point de pourcentage à la hausse annuelle de l'IPP ; la fabrication de machines et d'équipements électriques a augmenté de 3,6 %, la fabrication d'ordinateurs, de communications et d'autres équipements électroniques de 1,5 %, contribuant ensemble à environ 0,46 point de pourcentage à la hausse annuelle de l'IPP. Parmi les principales industries ayant enregistré des baisses de prix, les produits minéraux non métalliques ont reculé de 5,5 %, la production et la fourniture d'électricité et de chaleur ont baissé de 4,2 %, la construction automobile a diminué de 2,0 %, et la fonte et le laminage des métaux ferreux ont reculé de 1,1 %, contribuant ensemble à environ 0,75 point de pourcentage à la baisse en glissement annuel de l'IPP.
![Le dollar américain s'affaiblit sur le graphique hebdomadaire, les métaux sont globalement en hausse, l'étain du LME en hausse de près de 5 %, le zinc du LME et l'argent du COMEX en hausse de plus de 2 %, l'or et l'argent terminent la semaine en hausse [Marché overnight]](https://imgqn.smm.cn/usercenter/tSwaX20251217171735.jpg)
![À court terme, les métaux ferreux se consolident à des niveaux bas, et il faut prêter une attention particulière à la situation de maintenance des aciéries [Rapport hebdomadaire SMM sur la chaîne de l'industrie sidérurgique]](https://imgqn.smm.cn/usercenter/nDTpN20251217171748.jpg)