On April 14, data from the General Administration of Customs showed that China exported 9.135 million mt of steel in March 2026, up 1.298 million mt MoM, a 16.6% increase MoM; cumulative steel exports from January to March totaled 24.717 million mt, down 9.9% YoY.
China imported 512,000 mt of steel in March 2026, up 143,000 mt MoM; cumulative steel imports from January to March totaled 1.339 million mt, down 14.1% YoY.
- China's Steel Exports Increased MoM in March
Due to fewer days in February, combined with the Chinese New Year holiday and other factors, steel exports saw a seasonal rebound in March. Earlier SMM survey data on export order-taking also hinted at this trend — domestic sellers gradually resumed taking orders from mid-to-late January, with export order-taking maintaining a relatively high growth rate MoM. On the other hand, the global manufacturing PMI in February 2026 was 51.2%, up 0.2 percentage points MoM, running above 50% for two consecutive months, with Asia, Europe, and the Americas all rising MoM.
- China's Steel Imports Increased MoM in March
Import side, China's cumulative steel imports from January to March totaled 1.339 million mt, down 14.1% YoY; net steel exports reached 23.378 million mt.
- Short-Term Steel Export Outlook
According to the China Federation of Logistics & Purchasing, the global manufacturing PMI in March 2026 was 51.2%, up 0.5 percentage points MoM, running above 50% for 11 consecutive months, driven by some economies in Europe, the Americas, and Asia, while Middle East geopolitical tensions and supply chain disruptions persisted. China's new export orders index for the manufacturing sector was 49.1% in February, up 4.1 percentage points MoM, showing a relatively notable recovery MoM.
Data monitored by the World Steel Association showed that global crude steel production in February 2026 fell 2.2% YoY to 141.8 million mt. Among them, the pullback in China's production was mainly due to physical shutdowns during the Chinese New Year holiday and post-holiday high inventory forcing steel mills to actively cut hot metal production. Excluding China, production in the rest of the world also declined significantly by 8.75% MoM, with notable divergence in production schedule paces across regions — the most prominent being the Middle East, where output dropped markedly due to geopolitical conflicts and tariffs. The contraction in ex-China production, particularly in the Middle East, created opportunities for China's exports, especially semi-finished products.
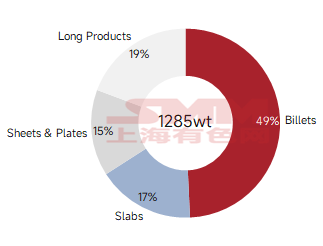
Chart 1 - Iran's Export Data by Product Category
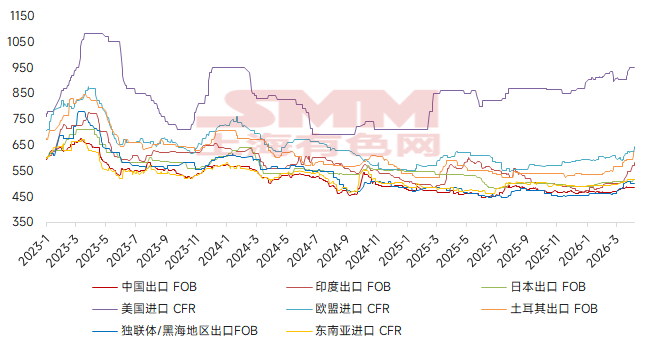
As of April 13, 2026, HRC export prices (FOB) from India, Turkey, and the CIS were $505/mt, $625/mt, and $495/mt respectively, while China's HRC export price (FOB) was $485/mt. Currently, China's HRC export price was +$20/mt, +$140/mt, and +$10/mt lower than those countries respectively. This shows that the escalation of the US-Iran conflict has pushed up ex-China steel costs far more than in China, further highlighting China's steel export price advantage.
Chart 2 - Global Major Market HRC Prices
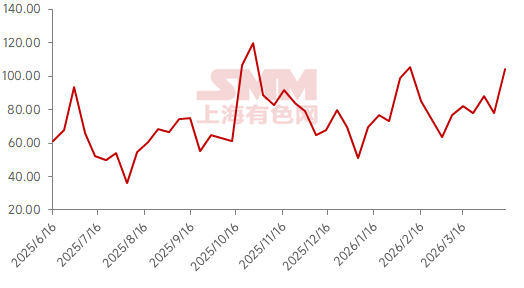
Based on SMM's latest steel mill export scheduling data, HRC export planned volume this month was 851,000 mt, up 67,000 mt from last month's actual exports, an increase of 8.5% MoM.
According to SMM steel export order-taking data, as production gradually resumed in and outside China, steel export order-taking in March increased 13.98% MoM from February. Due to the gap left by Iran's exports to Southeast Asia, the most notable increase was in semi-finished products, while the increase in finished products was relatively limited.
Taking all factors into consideration, with order-taking and shipping gradually recovering, SMM expects steel exports in April to continue rebounding MoM. However, differences across product categories may emerge, which is expected to result in relatively limited incremental volume in the General Administration of Customs data released on the 8th, while the product-specific data released on the 20th may show relatively strong performance in semi-finished products.
Chart 3 - SMM Steel Export Order
Taking VolumeData Source Disclaimer: Data other than publicly available information is derived by SMM based on public information, market communication, and SMM's internal database models, and is for reference only and does not constitute decision-making advice.
Note: This article is an original article of this official account. For any needs regarding reprinting, whitelisting, or cooperation, please contact us. Without permission, the above content shall not be reprinted, modified, used, sold, transferred, displayed, translated, compiled, disseminated, or disclosed to any third party in any other form, nor shall any third party be licensed to use it. Otherwise, once discovered, SMM will take legal measures to pursue infringement liability, including but not limited to claiming contractual liability for breach, return of unjust enrichment, and compensation for direct and indirect economic losses.
![[SMM Steel Market Flash] Mexico Pushes to Drop 50% US Steel Tariffs in USMCA Review, More Talks Due in June-July](https://imgqn.smm.cn/usercenter/wSpkX20251217171718.png)
![[SMM Hot Topic] Against the Backdrop of Declining Global Steel Prices, Chinese Steel Companies See Profit Recovery](https://imgqn.smm.cn/usercenter/rKOND20251217171716.jpg)
![[SMM Steel] Tata Steel Sees Long-Term Growth Opportunity in India](https://imgqn.smm.cn/usercenter/UqlZJ20251217171717.jpg)