SMM April 21 News:
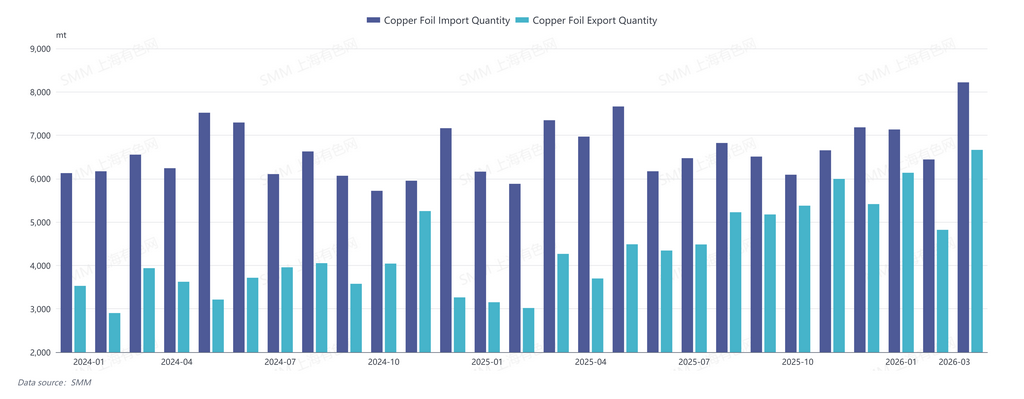
According to data from the General Administration of Customs, China's copper foil (HS codes: 74101100, 74102190) imports in March 2026 were 8,220.04 mt, up 11.88% YoY and up 27.59% MoM. Cumulative imports from January to March 2026 were 21,796.47 mt, up 12.41% YoY.
China's copper foil exports in March 2026 were 6,663.48 mt, up 56.19% YoY and up 38.23% MoM. Cumulative exports from January to March 2026 were 17,620.02 mt, up 68.83% YoY.
China's copper foil import value in March 2026 was $180.604 million, up 48.68% YoY and up 35.88% MoM. Cumulative import value from January to March 2026 was $448.0532 million, up 34.45% YoY.
China's copper foil export value in March 2026 was $116.1164 million, up 111.65% YoY and up 57.11% MoM. Cumulative export value from January to March 2026 was $280.4233 million, up 112.34% YoY.
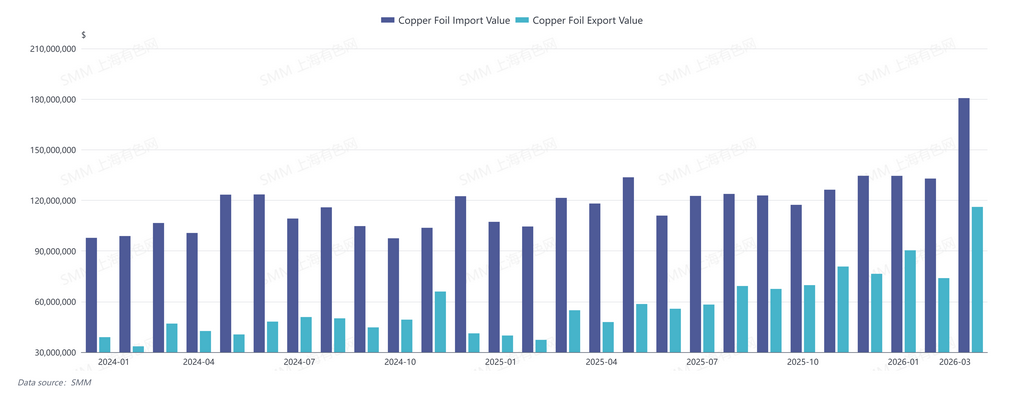
China's copper foil trade deficit in March 2026 was approximately $64.49 million, up approximately $5.48 million MoM from $59.01 million in February 2026.
Trade mode: China's copper foil imports in March 2026 via Ordinary Trade were 5,755.06 mt; processing trade with supplied materials 400.21 mt; processing trade with imported materials 875.7 mt; and other trade modes 1,189.07 mt.
China's copper foil exports in March 2026 via Ordinary Trade were 1,580.67 mt; processing trade with supplied materials 1,694.17 mt; processing trade with imported materials 2,762.66 mt; and other trade modes 625.98 mt.
By country/region, the main sources of China's copper foil imports in March 2026 were Taiwan, China, Malaysia, and Luxembourg, with imports of 4,979.31 mt, 1,197.24 mt, and 644.67 mt, respectively.
The main destinations of China's copper foil exports in March 2026 were Thailand, South Korea, and Malaysia, with exports of 1,839.95 mt, 950.43 mt, and 674.27 mt, respectively.
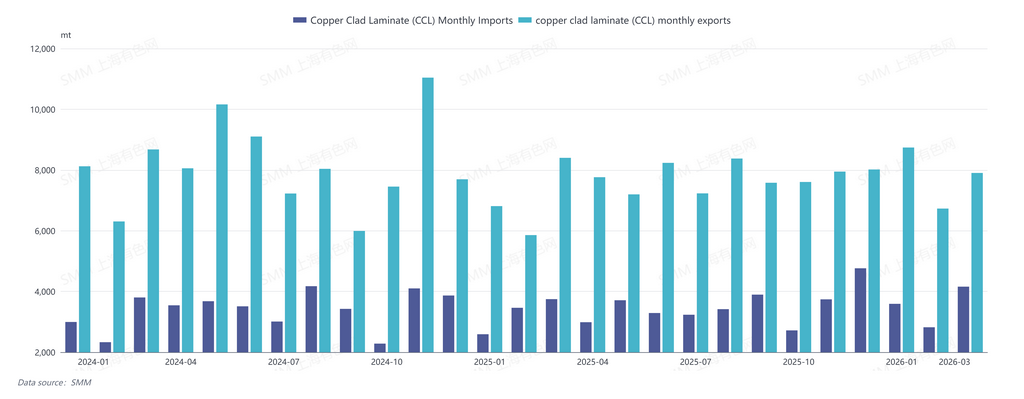
China's CCL (HS code: 74102110) imports in March 2026 were 4,158.10 mt, up 10.97% YoY and up 47.41% MoM. Cumulative imports from January to March 2026 were 10,571.28 mt, up 7.86% YoY.
China's CCL exports in March 2026 were 7,902.45 mt, down 5.92% YoY and up 17.43% MoM. Cumulative exports from January to March 2026 were 23,371.86 mt, up 10.94% YoY.
China's copper foil imports and exports both rose to high levels in March 2026, with exports hitting a single-month record high. The global new energy and AI industries exhibited high prosperity, coupled with optimistic demand during the seasonal peak consumption period. Currently, Chinese copper foil enterprises are releasing capacity and operating at high utilization levels. Although high-end products remain in undersupply, the added value of copper foil products has shown a steady upward trend, and enterprises are accelerating product exports and actively expanding their presence outside China.
![General Administration of Customs: ]China's March Copper Ore Imports Increased MoM, Ore Supply Tightness Remained Unchanged](https://imgqn.smm.cn/usercenter/tXWun20251217171711.jpg)
![Geopolitical Disruptions Sparked Market Caution, BC Copper Fluctuated and Closed Lower [SMM BC Copper Commentary]](https://imgqn.smm.cn/usercenter/KTLHT20251217171714.jpeg)