Editor's Note:
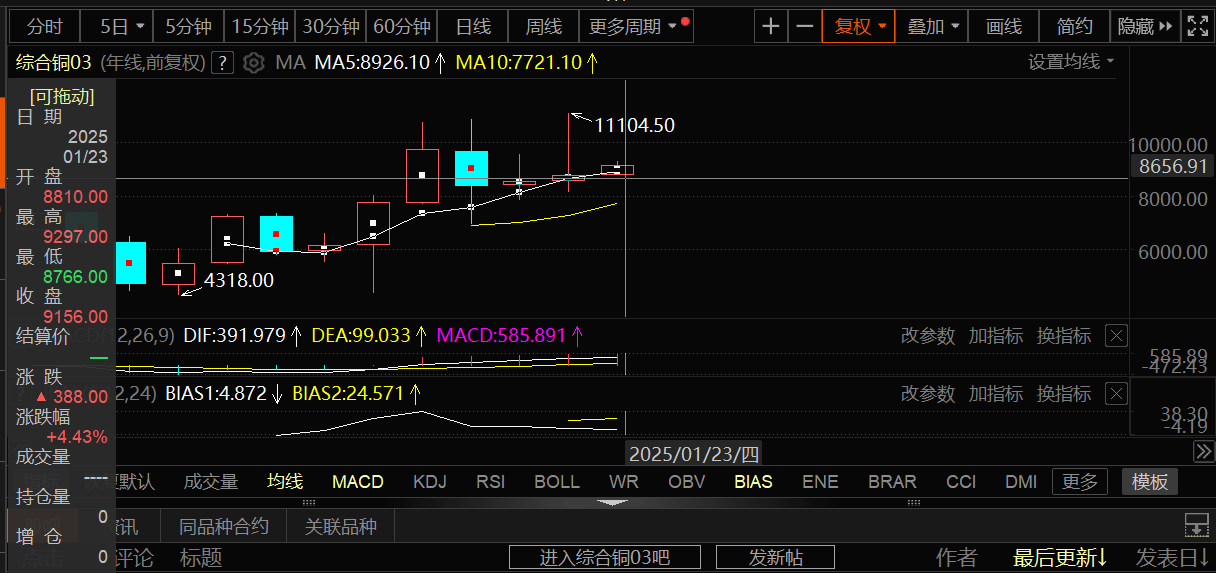
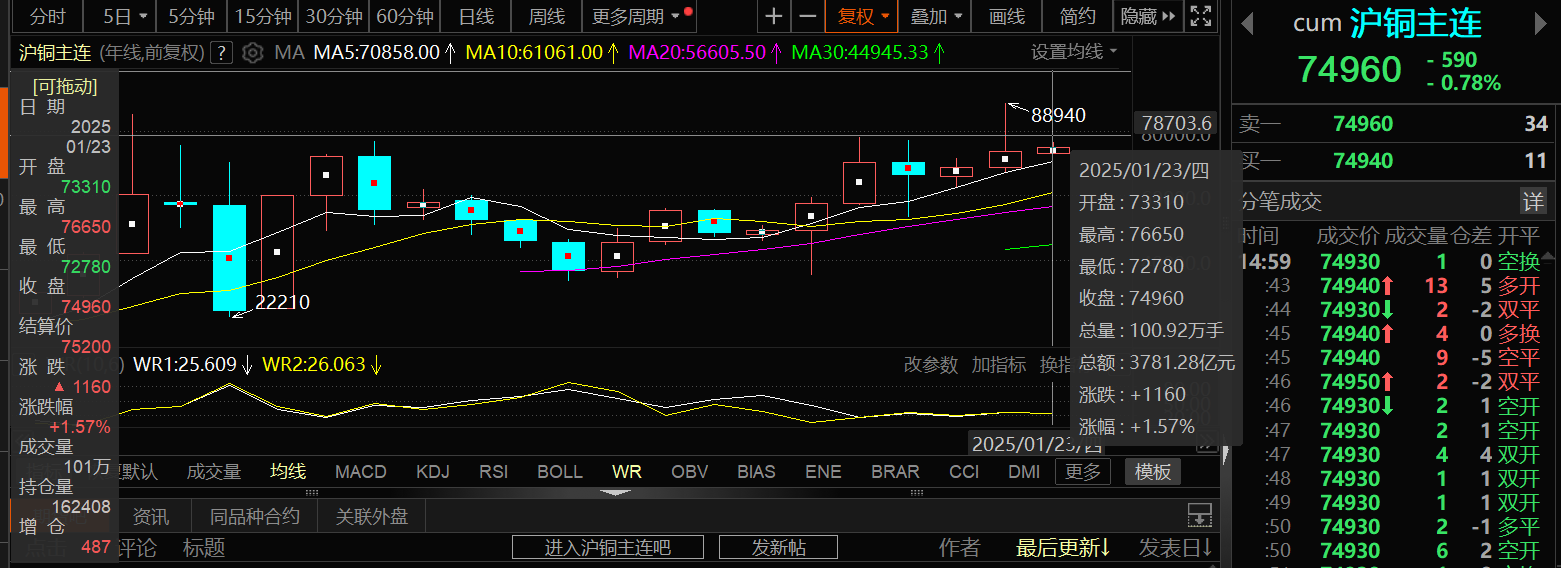
In 2024, copper prices concluded their journey with an overall upward trend. LME copper posted an annual increase of 2.6%, SHFE copper rose 6.96%, and SMM #1 copper cathode climbed 6.59%. Although the final gains in copper prices were not as dazzling as those of precious metals, the volatility in copper prices throughout 2024 was dramatic. Driven by factors such as macroeconomic optimism, heightened expectations of tight copper ore supply, rising expectations for copper cathode production cuts, increased copper consumption in AI applications, and COMEX copper short squeezes, copper futures prices on the three major exchanges all hit record highs in May 2024. Taking SHFE copper as an example, its price fluctuated between a high of 88,940 yuan/mt and a low of 67,380 yuan/mt, with a difference of 21,560 yuan/mt. Such significant volatility was not favorable for downstream copper consumption. Entering 2025, copper prices are currently on an upward trajectory for the year. How will the macro and fundamental factors, which played leading roles in the copper market drama of 2024, perform this year?
》Click to view SMM Futures Data Dashboard
Review of Previous Events
Prices: The annual average daily price of copper cathode in 2024 rose 9.69% YoY
》Click to view SMM Spot Copper Prices
》Subscribe to view historical price trends of SMM metals
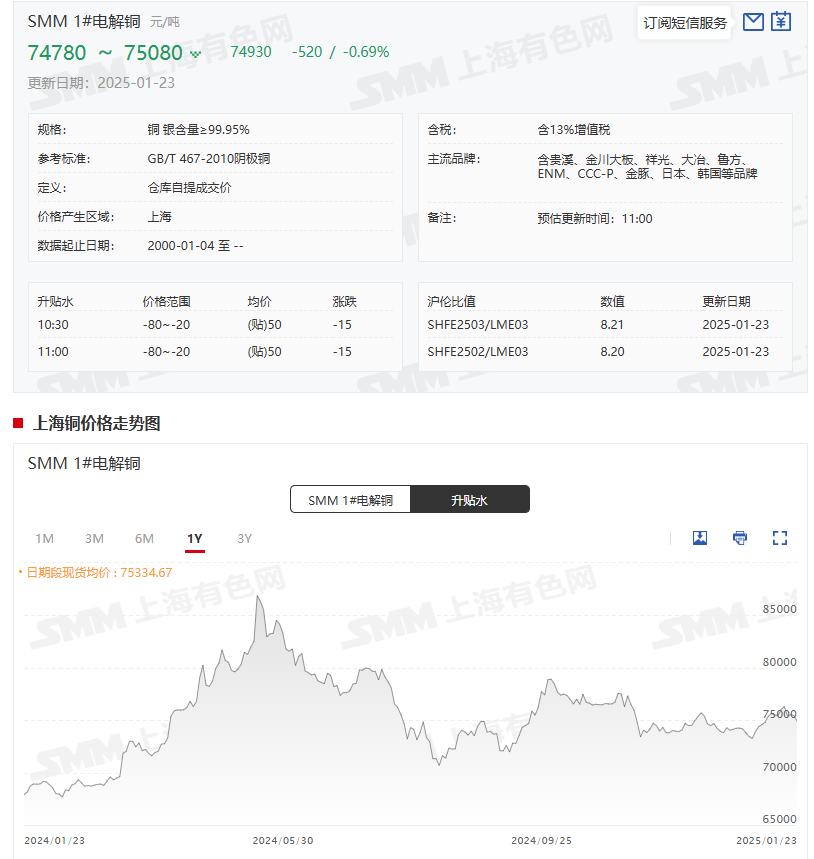
Spot Prices: According to SMM quotes, the average price of SMM #1 copper cathode on December 31, 2024, was 73,790 yuan/mt, compared to 69,230 yuan/mt on December 29, 2023, marking an increase of 4,560 yuan/mt for the year, with an annual growth rate of 6.59%. Since January 2025, the average price of SMM #1 copper cathode has shown a slight upward shift in its center. However, as the year-end approaches and downstream consumption weakens, copper prices have fluctuated downward. On January 23, the average price was 74,930 yuan/mt, down 520 yuan/mt from the previous trading day, a decline of 0.69%.
Regarding the annual average daily price, the daily average price of SMM #1 copper cathode in 2023 was 68,304.65 yuan/mt, while in 2024, it was 74,922.53 yuan/mt, representing an annual increase of 6,617.87 yuan/mt, or 9.69% YoY.
Supply
》Click to view SMM Metal Industry Chain Data Terminal
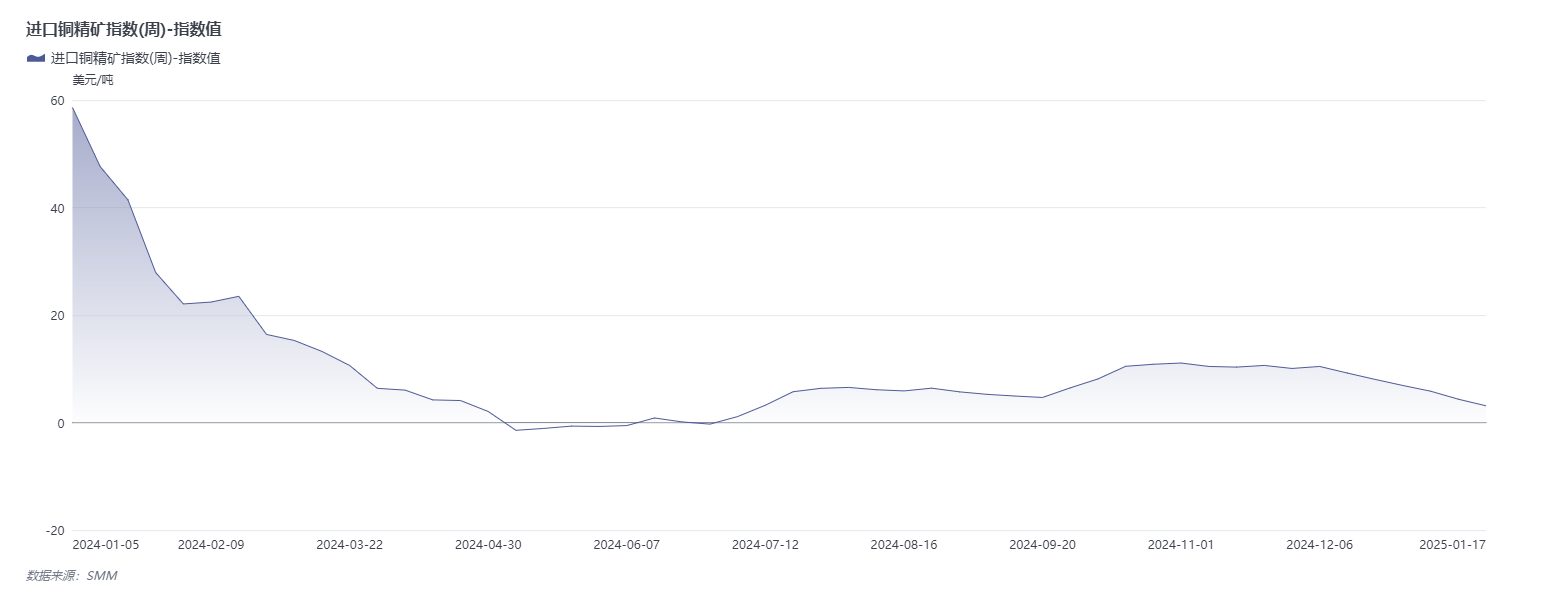
A review of the 2024 weekly performance of the imported copper concentrate index reveals that concerns over tight copper concentrate supply led to TC even turning negative during the year. Future global copper concentrate supply growth will mainly come from existing mine expansion projects. However, the number of newly commissioned world-class copper mines is limited, and these projects are unlikely to significantly boost copper concentrate supply. Large-scale, developable copper mine projects are becoming increasingly rare globally. Considering that concerns over copper concentrate supply are unlikely to ease in the short term, this is expected to provide support for copper prices from the raw material supply side.
China's copper cathode production in 2024 increased by 620,500 mt YoY, up 5.42% YoY
Production: In December 2024, China's copper cathode production increased by 90,400 mt MoM, up 8.99%, and rose 9.62% YoY, exceeding expectations by 8,700 mt. From January to December, production increased by 620,500 mt YoY, a growth rate of 5.42%. The significant increase in December production was mainly due to the following reasons: 1) smelters that had undergone maintenance resumed production; 2) newly commissioned smelters continued ramping up production; 3) some smelters boosted production at year-end; 4) the statistical period for some smelters in December extended from the 26th of the previous month to the 31st of the current month (normally from the 26th of the previous month to the 25th of the current month), resulting in a longer reporting period and contributing to the production increase. 》Click for details
Inventory: Weekly inventory buildup in major copper inventory regions nationwide
》Click to view SMM Metal Industry Chain Database
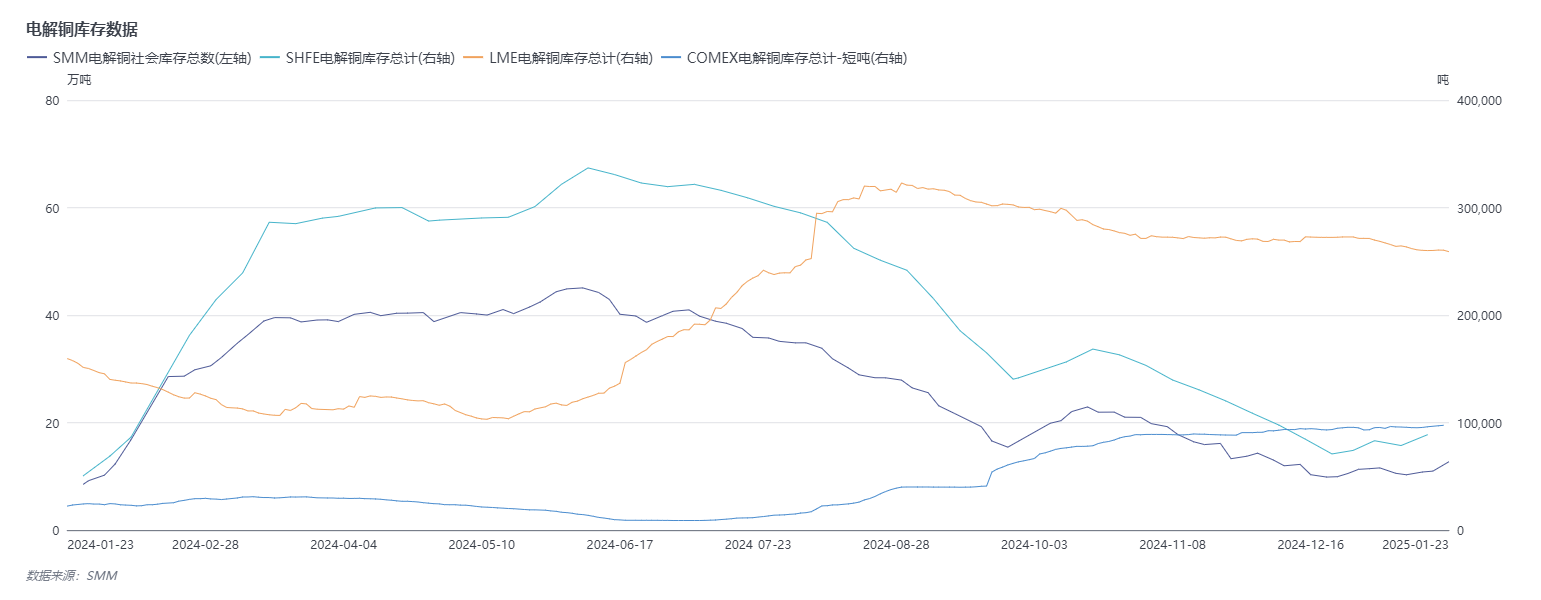
Inventory: According to SMM data on copper inventories in major regions nationwide, as of Thursday, January 23, 2025, copper inventories in major regions increased by 17,400 mt from Monday to 127,200 mt, up 19,100 mt from the previous Thursday. Total inventory was 42,000 mt higher than the 85,200 mt recorded in the same period last year. Although weekly inventory buildup occurred, the latest inventory level of 127,200 mt remains relatively low historically, providing support for domestic copper prices from the inventory side. Reviewing 2024 inventory data, domestic inventories surged after the Chinese New Year, reaching 450,700 mt in early June as downstream consumption was suppressed by record-high copper prices in May. As copper prices retreated, downstream consumption gradually recovered, leading to destocking, with inventories falling to around 100,000 mt by mid-to-late December. Subsequently, inventory levels fluctuated with changes in copper prices and demand.
In contrast to domestic inventory trends, LME copper cathode inventory showed an overall destocking trend at the beginning of the year, hitting a low of 103,100 mt on May 13, before starting an upward trajectory. Inventory peaked at 322,950 mt on August 29 and remained above 300,000 mt until early October, after which it showed a slight destocking trend. As of January 23, 2025, LME inventory stood at 259,050 mt.
The contrasting trends between LME copper cathode inventory and domestic copper social inventory in 2024 indicate a seesaw relationship. This suggests that fluctuations in the SHFE/LME price ratio led to repeated transfers between domestic copper inventories and LME copper inventories in Asia, resulting in opposing inventory trends in the two regions.
Additionally, COMEX copper inventory remained low in H1 2024, staying below 10,000 short tons from mid-June to mid-July. Subsequently, COMEX copper inventory began an upward trend, reaching 97,504 short tons by January 22, 2025, a historical high.
Market Outlook: Copper Prices in 2025 Are Expected to Shift Higher
Domestic: Market expectations for China's macroeconomic performance remain strong. 2025 marks the final year of the 14th Five-Year Plan and the beginning of the 15th Five-Year Plan. With the expansion of favorable policies such as measures to stabilize the real estate market and the "program of large-scale equipment upgrades and consumer goods trade-ins," copper prices are likely to receive macroeconomic support. Overseas: US tariff policies and the direction of the US Fed's interest rate policy will be key factors influencing copper prices. If US trade policies, as some analysts predict, trigger inflation, the resulting rise in copper and other commodity prices could lead to prolonged high inflation, prompting the US Fed to maintain higher interest rates for an extended period. Elevated US interest rates would suppress the market performance of copper and other assets. However, the market has already factored in the impact of US tariff expectations on the metals market multiple times. As the details of US trade policies are announced, their marginal impact on the copper market is expected to diminish.
Fundamentals Side: Supply side: With tight copper concentrate supply showing no signs of easing, the proportion of secondary copper flowing to smelters may increase. Demand side: The new energy sector continues to drive positive growth in copper demand. Beyond Europe, copper consumption in China, Southeast Asia, the US, and South America is also maintaining overall positive growth. If European demand remains stable, growth in other regions could still positively boost global copper cathode consumption. Supported by tight copper concentrate supply and growing demand, copper prices are more likely to rise than fall.
In summary, considering the numerous uncertainties on the macro front and the unresolved tight supply expectations on the fundamentals side, copper fundamentals are expected to provide strong support for copper prices. In the medium and long term, copper prices are likely to see their center continue to shift higher.
Institutional Insights
ANZ stated that challenges in copper supply are expected to persist into 2025. ANZ forecasts copper demand to grow by 3.5% YoY to 28 million mt, with a market supply deficit of 500,000 mt (2% of annual demand).
BMI, a research arm of Fitch Solutions, revised its 2024 average copper price forecast down to $10,000/mt. BMI analysts noted that as of December 17, 2024, the average copper price was $9,277/mt, with current prices hovering around $8,990/mt. The report highlighted that bearish sentiment driven by a more hawkish US Fed and potential US tariff hikes would weigh on copper prices. BMI expects copper consumption to grow by 2.5% YoY in 2024 and by 3.6% in 2025. Over the long term, as the green transition accelerates, strong demand prospects and a persistent structural deficit in the copper market are expected to drive copper prices to $17,000/mt by 2033.
Citi maintained a neutral to bearish rating on the base metals complex, forecasting copper prices to fall to $8,500/mt and aluminum prices to $2,500/mt within the next three months.
Commerzbank predicts copper prices will rise to $9,700/mt by the end of 2025.
JPMorgan stated that the medium-term fundamentals for copper and aluminum remain bullish, expecting a V-shaped recovery in late 2025. It forecasts aluminum prices to rise to $2,850/mt in H2 2025, copper prices to rebound to around $10,400/mt in Q4 2025, and nickel prices to fluctuate around $16,000/mt in 2025.