On November 5, at the hosted by Changzhou Tongtai High-Conductivity New Materials Co., Ltd., SMM Information & Technology Co., Ltd. (SMM), and Shandong Aisi Information Technology Co., Ltd., supported by Shandong Xinghui Copper-Based New Materials Technology Co., Ltd., and with special support from the Wire and Cable Enterprise Federation of Yixing Entrepreneur Association, Suzhou Optoelectronic Industry Chamber of Commerce, Anhui Wuwei Special Cable Association, and Ningbo Wire and Cable Chamber of Commerce, Jiang Xianhui, director of the research institute at Huishang Futures Co., Ltd., shared with attendees the topic "Current Macroeconomic Analysis and Asset Class Investment Logic."

Cycle Positioning—Medium Cycle · Second Inventory Cycle · China-US Divergence
Five Kondratiev Waves in World Economic History
He elaborated by referencing the five Kondratiev waves in world economic history (1782–present).
Medium Cycle Operating Patterns
He introduced the topic from perspectives including changes in US fixed capital consumption (seasonally adjusted, YoY) and the operating patterns of US medium cycles.
US Inventory Cycle Operating Patterns
He analyzed the overall US industrial output gap since 1977 and the US inventory cycle operating patterns summarized since 1975.
Cycle Nesting
Cycle nesting positions the present:
1. One medium cycle contains three short cycles (inventory cycles).
2. Before each medium cycle ends, the inventory cycle hits bottom in advance.
3. This medium cycle began in October 2020; the first inventory cycle started in June 2020 and hit bottom in October 2024.
4. Counting from June 2020 to October 2024, the first inventory cycle ran for 53 months, exceeding historical duration.
5. Counting from November 2024, combined with medium cycle operating patterns, the market has now entered the upward phase of the second inventory cycle within the medium cycle, having run for 23 months.
6. The upward momentum shows no signs of weakening; Q4 and early 2027 are judged to remain in an upward restocking phase. Based on the average US inventory cycle of 35 months, a bottom is expected around October 2027.
7. Risk: Watch for the inflection point of active restocking in the US.
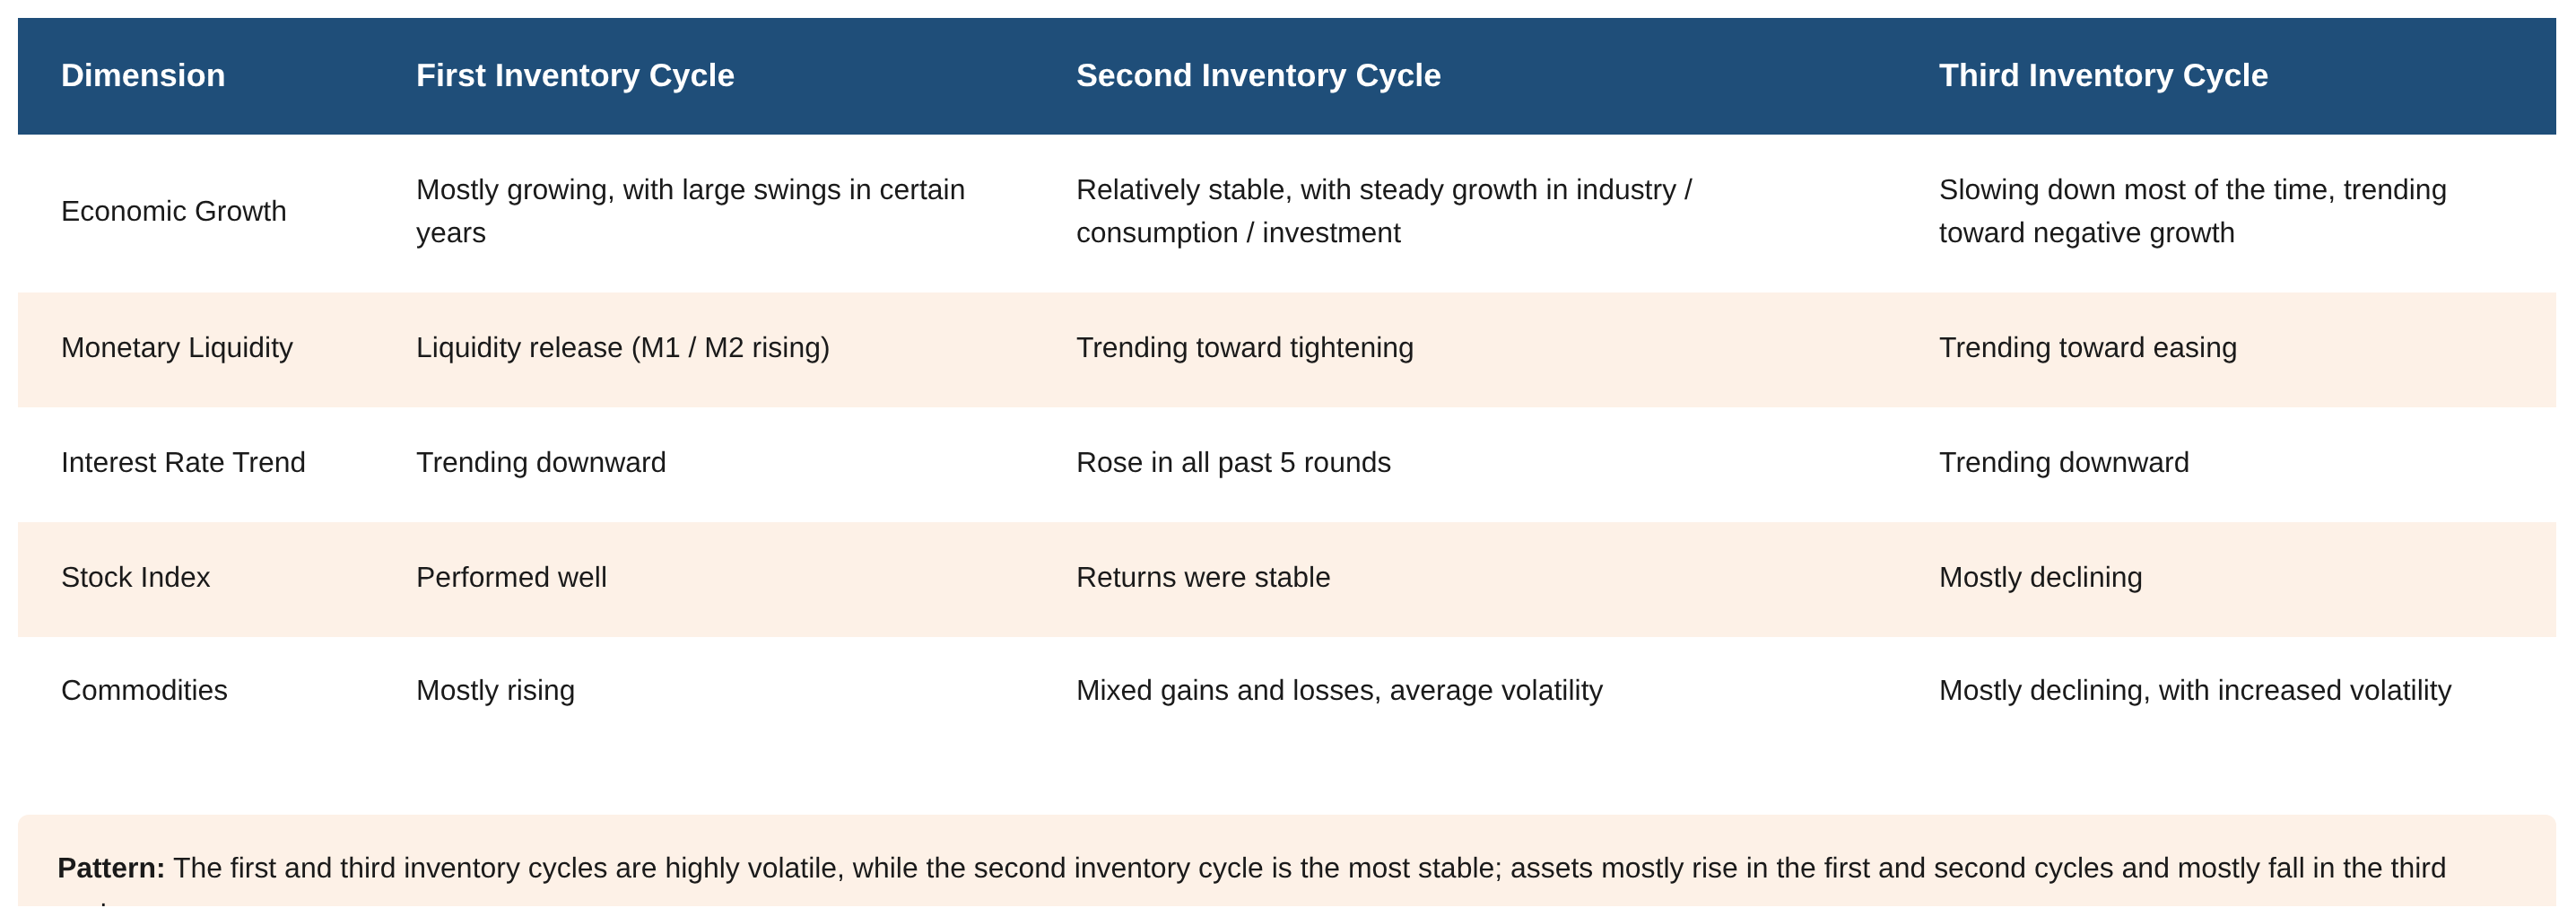
He introduced the topic from perspectives including economic indicators and asset class performance corresponding to different inventory cycle phases, economic indicators and asset class performance corresponding to different inventory cycle phases (continued), first inventory cycle characteristics, second inventory cycle characteristics, and third inventory cycle characteristics.
Summary of First, Second, and Third Inventory Cycle Characteristics
China Inventory Cycle Operating Patterns
China's inventory cycle shares similar patterns with those of Europe and the US, but with the following differences:
1. The average cycle duration is longer than in Europe and the US, with notably longer upward phases.
2. Inventory cycle bottoms occur earlier than in Europe and the US.
(1) In 2009, China's inventory cycle hit bottom in January 2009, four months earlier than the US. (2) In 2020, China's inventory cycle hit bottom in February 2020, four months earlier than the US. (3) In February 2024, China's inventory cycle hit bottom, six months earlier than the US. China's inventory cycle has now entered the passive restocking (downward) phase.
Positioning the Present
Forecast:
1. China: Counting from March 2024, the upward phase to the peak (February 2026) lasted 22 months, followed by a downward phase. As of October, the downward phase has run for 8 months. Based on China's inventory cycle operating patterns, with the downward phase calculated at 18 months, a bottom is expected around August 2027.
2. China's inventory cycle is currently diverging from those of Europe and the US (Europe and the US rising, China falling). Based on the inventory cycle patterns of China, the US, and Europe, a common bottom is expected in August-October 2027, marking the start of the third inventory cycle within the medium cycle.
International Macro—Economic Resilience · Tightening Policy · Geopolitical Tension
► International Macro Overview: Three Threads Interwoven
Since Q2, the international landscape can be summarized in three phrases—economic resilience, tightening policy, and geopolitical tension—mutually intertwined and reinforcing one another, forming the fundamental backdrop for global asset class pricing.
① Economic resilience: Growth, business sentiment, and inflation strengthening simultaneously across three dimensions. Global manufacturing PMI rose to 53.0% in September (the highest since February 2022, marking 14 consecutive months of expansion). The US, Europe, Japan, and emerging markets are rising in tandem.
② Tightening policy: The US Fed has shifted from interest rate cuts to hikes. The September FOMC meeting raised rates by 25bp, with the EFFR rising to 3.88%; the market expects approximately 4.8% by end-2027, implying cumulative hikes of about 125bp.
③ Geopolitical tension: "Dual strait" risks are pushing energy prices higher. Simultaneous disruptions in Hormuz and the Bab el-Mandeb are keeping energy inflation elevated.
► Economic Resilience ①: Broad-Based Growth Rebound
Growth in major economies has broadly rebounded, with emerging economies showing a notable growth advantage and serving as an important source of incremental global demand.
• US Q3 2026 GDP grew 3.4% QoQ annualized, up 1.2pct from Q2 2026's 2.2%, significantly higher than the 0.2% low in Q4 2025, maintaining above 2% for three consecutive quarters. Consumption has retaken the lead as the main engine (contributing 2.51 percentage points to GDP growth), with investment also strong (contributing 3.27 percentage points to GDP growth).
• Eurozone Q2 2026 GDP grew 1.2% YoY, maintaining steady growth of 1.1%–1.2% for four consecutive quarters since Q3 2025. Japan's Q2 2026 GDP grew 1.4% QoQ annualized, maintaining positive growth for three consecutive quarters.
• Emerging economies show a more pronounced growth advantage: South Korea grew 3.4% YoY in Q3 2026, Indonesia 5.3% YoY in Q2 2026, Brazil 2.0% YoY in Q2 2026, Mexico 1.9% YoY in Q2 2026, and India 7.8% YoY in Q2 2026—generally above pre-pandemic growth centers, making them an important source of incremental global demand.
► Economic Resilience ②: Business Sentiment Returns to Expansion
Manufacturing and services PMIs have mostly returned to expansion territory.
• Global manufacturing PMI rose for two consecutive months to 51.0% and 51.2% in January and February 2026, returning to expansion territory, and further rose to 53% in September 2026 (52.3% in August, the highest since February 2022, marking 14 consecutive months of expansion).
• Eurozone manufacturing PMI rose to 52.9% in September 2026 (flash: 52.7%), services PMI rose to 53.0%, and composite PMI rose to 53.1% (the highest since April 2023), returning to expansion territory and reflecting the spread of Europe's recovery from manufacturing to services and accelerating domestic demand repair. Japan's September 2026 manufacturing PMI was 54.1% (final), with services PMI at 51.3%, both in expansion territory, with manufacturing sentiment the strongest among developed economies.
• US Markit manufacturing PMI rose to 55.9% in September 2026, services business activity index rose to 58.8%, ISM manufacturing PMI was 55.5%, and ISM non-manufacturing PMI was 54.9%. All four major sentiment indicators are in expansion territory and rising month by month. The ISM manufacturing new orders index was 55.5% and output index 59.0%, with demand-side improvement outpacing inventory adjustment, and manufacturing restocking momentum taking shape.
► Economic Resilience ③: Inflation Rebounds, Led by Energy
Inflation in major economies has broadly rebounded from low levels, with energy prices as the common driver. This rebound is notably exogenous in nature, shaping the subsequent policy path and asset pricing direction.
· US September CPI: 3.7% (core 2.6%, energy component 20.4%).
· Eurozone HICP: from 1.7% in January to 4.0% in October (core HICP YoY rose from 2.2% to 2.5%).
· Japan CPI: from 1.3% in February to 2.1% in September; India: from 2.7% to 5.5% in September.
The synchronized strengthening of growth, business sentiment, and inflation points to "economic resilience," but inflation is driven by geopolitical energy factors rather than demand overheating.
► US Economy ①: Resilience in Employment with Accumulating Concerns
The aggregate shows resilience (unemployment rate 4.2%, Sahm rule back to 0), but structural and trend concerns cannot be ignored.
► US Economy ②: Divergent Inflation Structure
The inflation rebound is led by geopolitical energy factors, while services inflation (including rent), the largest weight, continues to cool, serving as the "ballast" for inflation.
The energy component's 20.4% YoY increase in September is the main driver of the rebound (energy commodities up 35.3% YoY, with a May peak of 40.6%; motor fuel (gasoline) up 34.9% YoY). Core CPI rose 2.6% YoY, declining for two consecutive years. Shelter at 3.2% and owners' equivalent rent at 3.3% continue to decline, with long-term centers stabilizing.
► Tightening Policy: US Fed Shifts from Cuts to Hikes
In 2026, US Fed policy underwent a directional reversal: from cuts to hikes, with high rates to persist longer and the global risk-free rate center shifting upward accordingly.
► Geopolitical Tension: Dual Strait Risks and Oil Prices
Geopolitics forms a self-reinforcing negative loop through "energy prices → inflation → policy → valuations," making it the largest spillover variable.
· The US-Iran conflict has spilled over to the Houthis and Saudi Arabia, creating simultaneous disruptions in the "dual straits" of Hormuz and the Bab el-Mandeb.
· Approximately 30% of global oil trade, or a daily average of 17–20 million barrels, passes through Hormuz; Red Sea rerouting around the Cape of Good Hope is raising freight costs.
External Summary: A Self-Reinforcing Negative Loop
The three main threads form a closed loop: economic resilience → tightening policy (global risk-free rate center shifting upward) → geopolitical tension (stubborn energy inflation) → reinforcing policy tightening and suppressing valuations.
Asset implications: The global risk-free rate pricing center has systematically shifted upward, constraining the valuation elasticity of risk assets, while the weight of energy and safe-haven assets rises accordingly. The key to "untying the knot" lies in geopolitics and energy prices.
Domestic Macro—Old-to-New Growth Driver Transition and Rebalancing
► Domestic Macro Overview: Convergence + Exit
China's internal cycle is diverging from the global one, showing "convergence + exit"—macro volatility is converging while structural divergence intensifies. He analyzed this from six dimensions: growth, prices and profits, inventory (active destocking), finance, fiscal (increasing revenue and reducing expenditure), and external pricing (interest rate spread and exchange rate decoupling).
Six Major Structural Contradictions and Core Main Threads
He introduced six pairs of mutually constraining contradictions and conclusions on the core main threads.
Outlook and Asset Allocation Logic
Main Thread
The world of 2026 is not one of "global synchronized recovery," but rather a two-way divergence of "global up, China converging"—this is the overarching thread that governs the entire narrative.
Market Outlook (Quarterly to 1 Year)
The mismatch between exogenous global resilience and endogenous China convergence will persist at least until mid-2027; external constraints are "high interest rates + energy premium + rising safe-haven weight."
General Allocation Principle: Equities, Bonds
General principle: Abandon the fantasy of aggregate Beta. Take "certainty premium" as the main thread, and within structural divergence, go long certainty, control volatility, and retain safe havens.
• Equities: For A-shares, structure matters more than the aggregate. Barbell strategy: high-dividend yield stocks (defensive + low risk-free rate of 1.69% lifting valuations) and export chain/high-end manufacturing form the barbell. Aggregate indices lack systematic Beta; opportunities depend on the timing and intensity of broad fiscal stimulus. Watch anti-involution price repair, AI hardware chain, shipbuilding and construction machinery, while avoiding the property chain and weak-credit tail. Global equities are suppressed by high US Treasury yields, with earnings certainty used to hedge rising discount rates.
• Bonds: The downward trend in yield centers is not over but is constrained by extreme spreads—insufficient financing demand (household net repayment of 1.03 trillion yuan, corporate medium- and long-term loans at -23.6%) and weak repair determine the downward direction, but the China-US interest rate spread of approximately -3.5% and high US Treasury yields constitute external constraints. Duration should be neutral to slightly long.
Commodities, FX, Gold
• Commodities: Overweight nonferrous and precious metals, underweight ferrous metals; energy highly volatile. Global capital expenditure and supply constraints support industrial metals such as copper and aluminum, as well as gold. Geopolitics + OPEC+ dominate high volatility in crude oil (high event-driven elasticity, direction hard to predict). Ferrous metals are pressured by weak Chinese demand and "anti-involution"
Supply-demand game cuts both ways, with direction depending on the actual strength of fiscal stimulus.
• FX: RMB to move sideways in the 6.7–6.9 range. After the pricing anchor shifts to the balance of payments, the interest rate differential of about -3.5% no longer dominates; the baseline is mild appreciation followed by range-bound trading. The central bank is wary that excessive appreciation could hurt exports, with an implicit boundary near 6.7. Watch two signals (FX settlement flows nearing exhaustion, and the central parity rate shifting toward depreciation guidance). If US Treasury yields remain above 5.2%, the exchange rate's "immunity" to interest rate differentials may weaken at the margin.
• Gold: medium-term strategic allocation. Three factors resonate—expectations of falling real interest rates, continued central bank gold purchases, and geopolitics plus de-dollarization. Gold serves a safe-haven and currency-substitution function in portfolios and is better suited to medium-term allocation than short-term trading.
Overview of asset allocation logic across major asset classes
Overall allocation principle: abandon the fantasy of aggregate Beta, focus on "certainty premium" as the main theme, and within structural divergence, go long certainty, control volatility, and retain hedges.
It summarizes the allocation logic for each asset across four dimensions: asset class, allocation tilt, core driver (data anchor), and key risks.
Market outlook (2–3 years)
Against the backdrop of a long-wave depression, the mid-cycle boom and the second inventory cycle peak will give way to the third inventory cycle, after which the three cycles will turn down in resonance, intensifying economic and asset price volatility.
• Looking at the present from the past, from the perspective of the long-wave cycle, this mid-cycle is in the long-wave depression phase. Based on historical patterns, economic indicators stabilize in the second inventory cycle, and major asset performance is relatively calm. Overseas is currently in the active restocking phase of the second inventory cycle, with the peak expected in Q4 or early 2027 and the trough in Q4 2027 or early 2028, when the third inventory cycle's upswing begins. In the third inventory cycle, economic indicators become unstable and major asset volatility intensifies. After the third inventory cycle peaks, the long-wave depression and the post-mid-cycle boom eventually usher in a synchronized downturn across the three cycles.
Risk warnings and conclusion
Risk warnings (downside risks): external—geopolitical tensions exceeding expectations, sticky inflation exceeding expectations, Fed policy exceeding expectations, AI development falling short of expectations; internal—policy shifts falling short of expectations, collapse of external demand.
Disclaimer
The information contained in this report is obtained or compiled from sources we believe to be reliable, but Huishang Futures does not guarantee the accuracy, validity, or completeness of the information or data contained herein. The views in this report should not be regarded
as a direct basis for any futures or options commodity trading. No person may publish or reproduce all or part of the contents of this report in any form without the authorization of Huishang Futures.