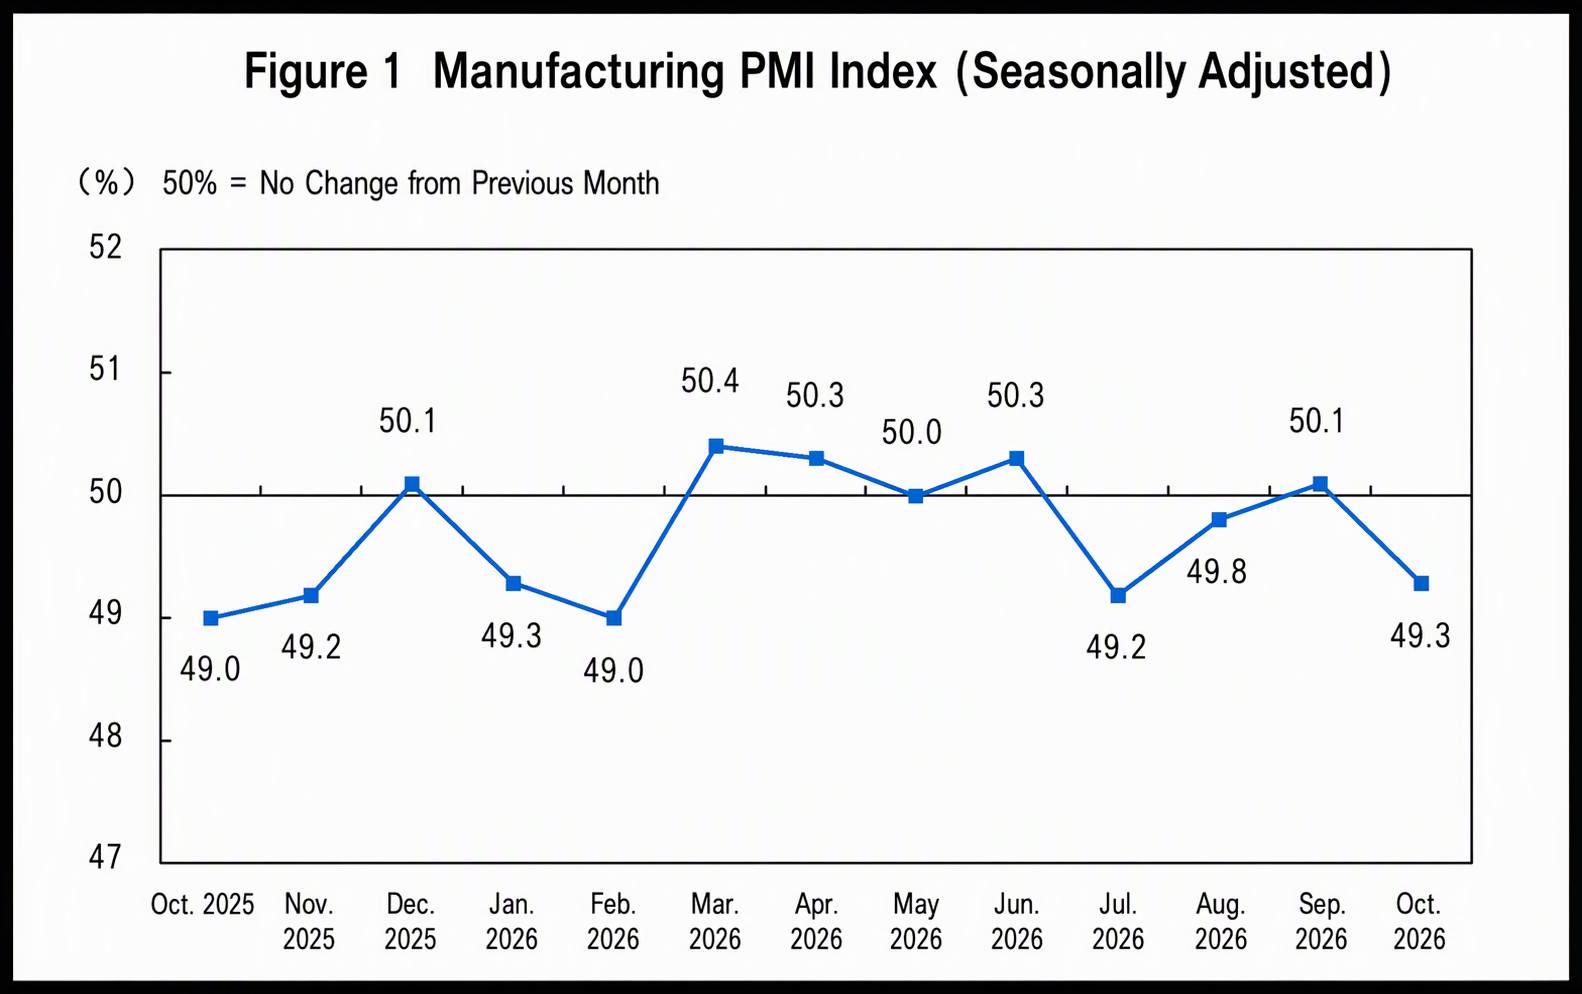
Data from the National Bureau of Statistics (NBS) show that in October, the manufacturing Purchasing Managers' Index (PMI) came in at 49.3%, down 0.8 percentage points from the previous month, indicating a pullback in manufacturing activity. Huo Lihui, chief statistician of the NBS Service Industry Survey Center, provided an interpretation.In October, affected by factors such as the early release of some demand before the "National Day" holiday and the complex and volatile international environment, the manufacturing PMI fell to 49.3%. Both supply and demand slowed down.New momentum maintained rapid growth. The PMI for high-tech manufacturing and equipment manufacturing stood at 51.3% and 50.6%, respectively, remaining above the threshold. Enterprises in related industries continued to expand production and operations, and new quality productive forces sustained a sound development trend. The PMI for consumer goods and high-energy-consuming industries stood at 48.8% and 47.3%, respectively, down 1.9 and 0.7 percentage points from the previous month, indicating weakened market activity. Price indexes retreated from highs. The purchasing price index for major raw materials and the ex-works price index in manufacturing stood at 56.8% and 51.7%, respectively. Affected by the recent decline in prices of some non-ferrous metals and other commodities, they fell 4.0 and 2.3 percentage points from the previous month but remained in expansion territory, with the increase in manufacturing market prices narrowing. By industry, as international crude oil prices continued to climb, both price indexes for petroleum, coal and other fuel processing, as well as chemical fibers, rubber and plastics products, remained above 60.0%. Large enterprises continued to expand.
Performance of China's Purchasing Managers' Index in October 2026
I. Performance of China's Manufacturing Purchasing Managers' Index
In October, the manufacturing Purchasing Managers' Index (PMI) came in at 49.3%, down 0.8 percentage points from the previous month, indicating a pullback in manufacturing activity.
By enterprise size, the PMI for large enterprises was 50.2%, down 0.4 percentage points from the previous month but still above the threshold. The PMI for medium-sized and small enterprises was 48.4% and 47.5%, respectively, down 1.3 and 1.4 percentage points from the previous month, below the threshold.
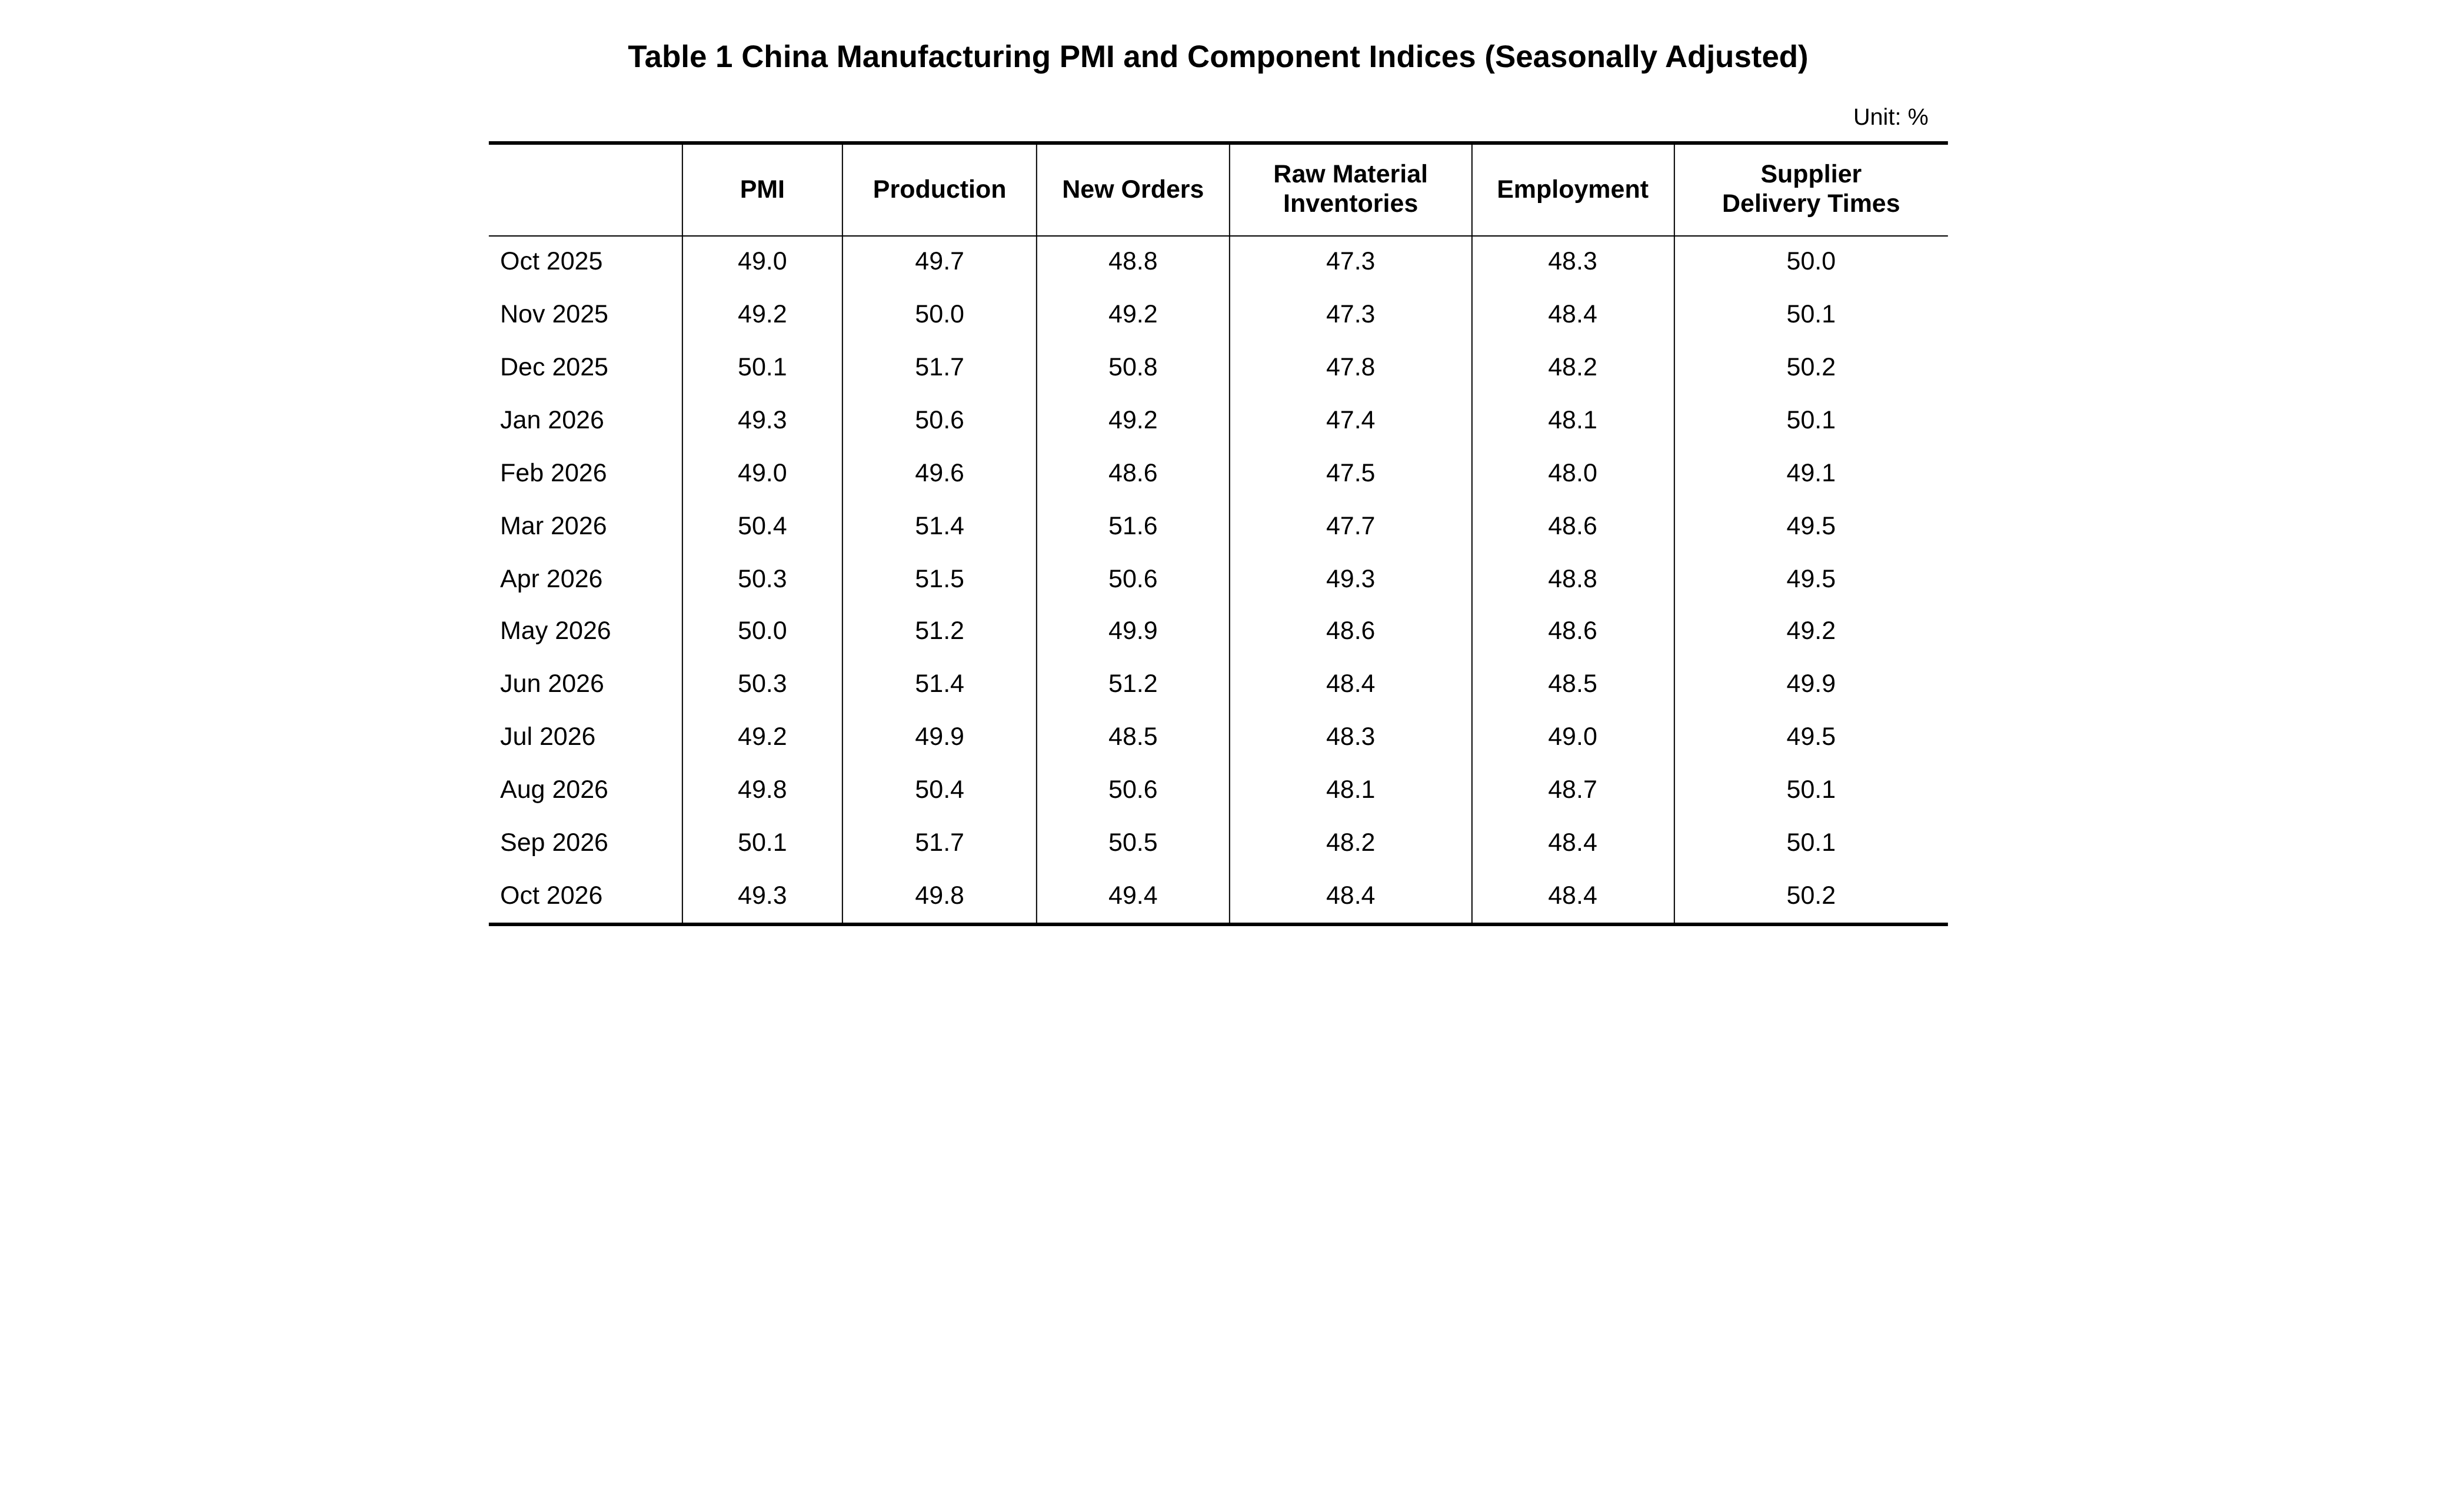
Among the sub-indexes, of the five sub-indexes that make up the manufacturing PMI, the supplier delivery time index was above the threshold, while the production index, new orders index, raw material inventory index, and employment index were below the threshold.
The production index was 49.8%, down 1.9 percentage points from the previous month, indicating a slowdown in manufacturing production activity.
The new orders index was 49.4%, down 1.1 percentage points from the previous month, indicating a decline in manufacturing market demand.
The raw material inventory index was 48.4%, up 0.2 percentage points from the previous month, indicating that the decline in major raw material inventories in manufacturing narrowed.
The employment index was 48.4%, unchanged from the previous month, indicating that the employment climate in the manufacturing sector was generally stable.
The supplier delivery time index was 50.2%, up 0.1 percentage point from the previous month, indicating faster delivery times for raw material suppliers in the manufacturing sector.
II. Performance of China's Non-Manufacturing PMI
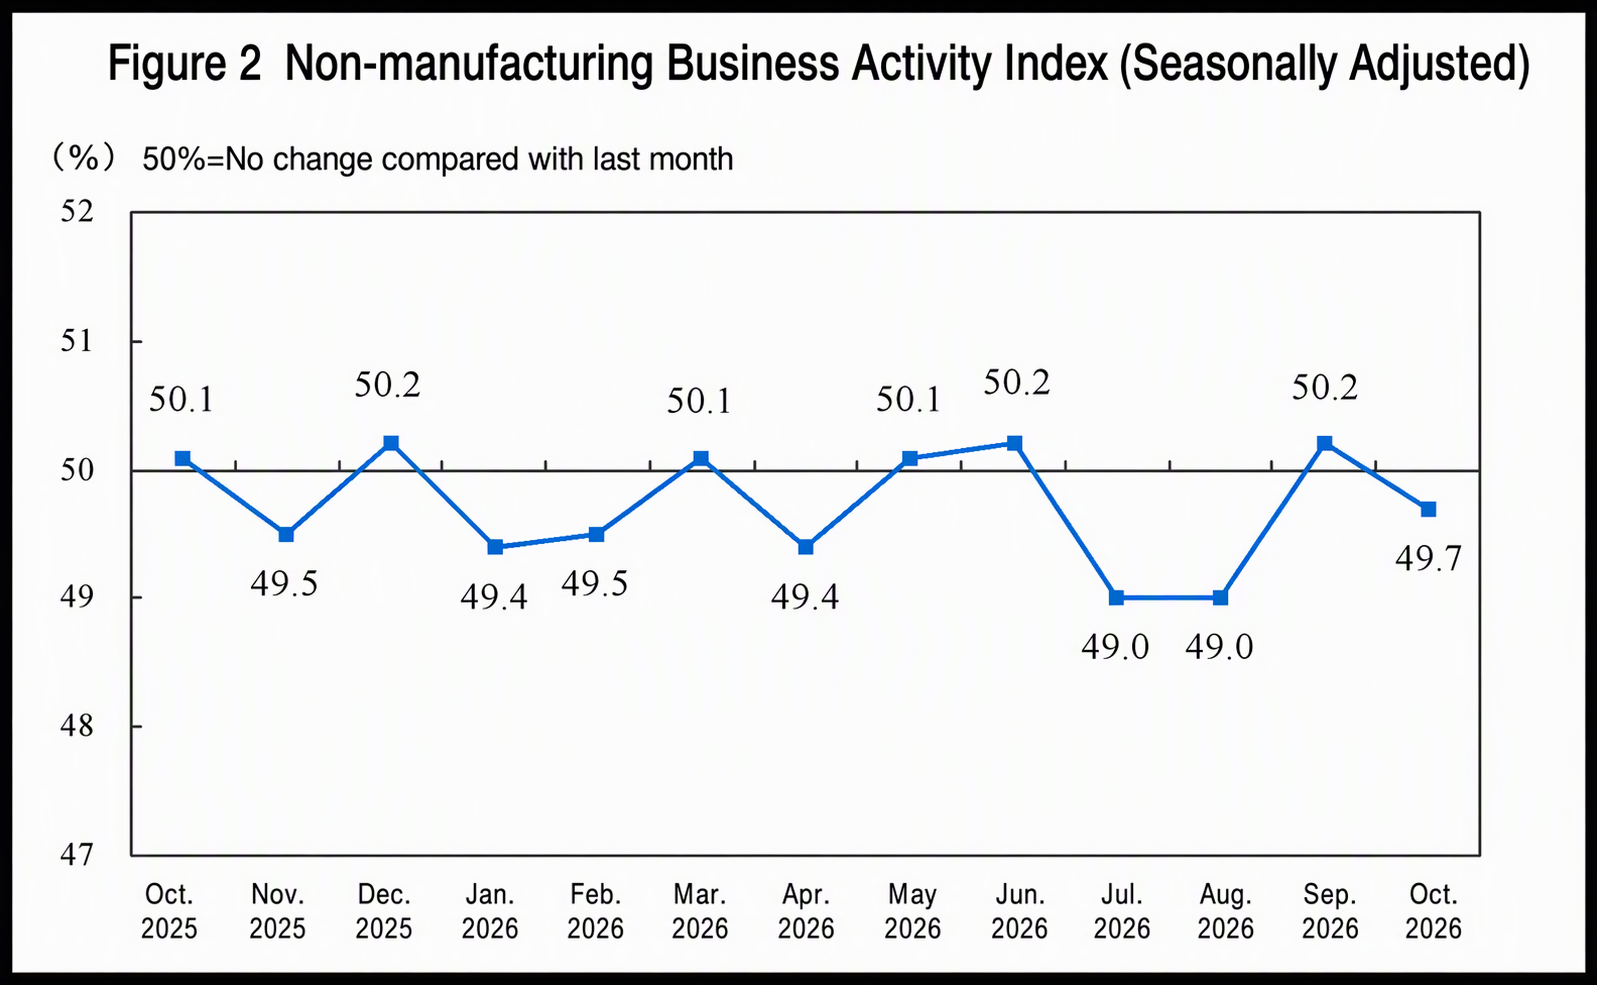
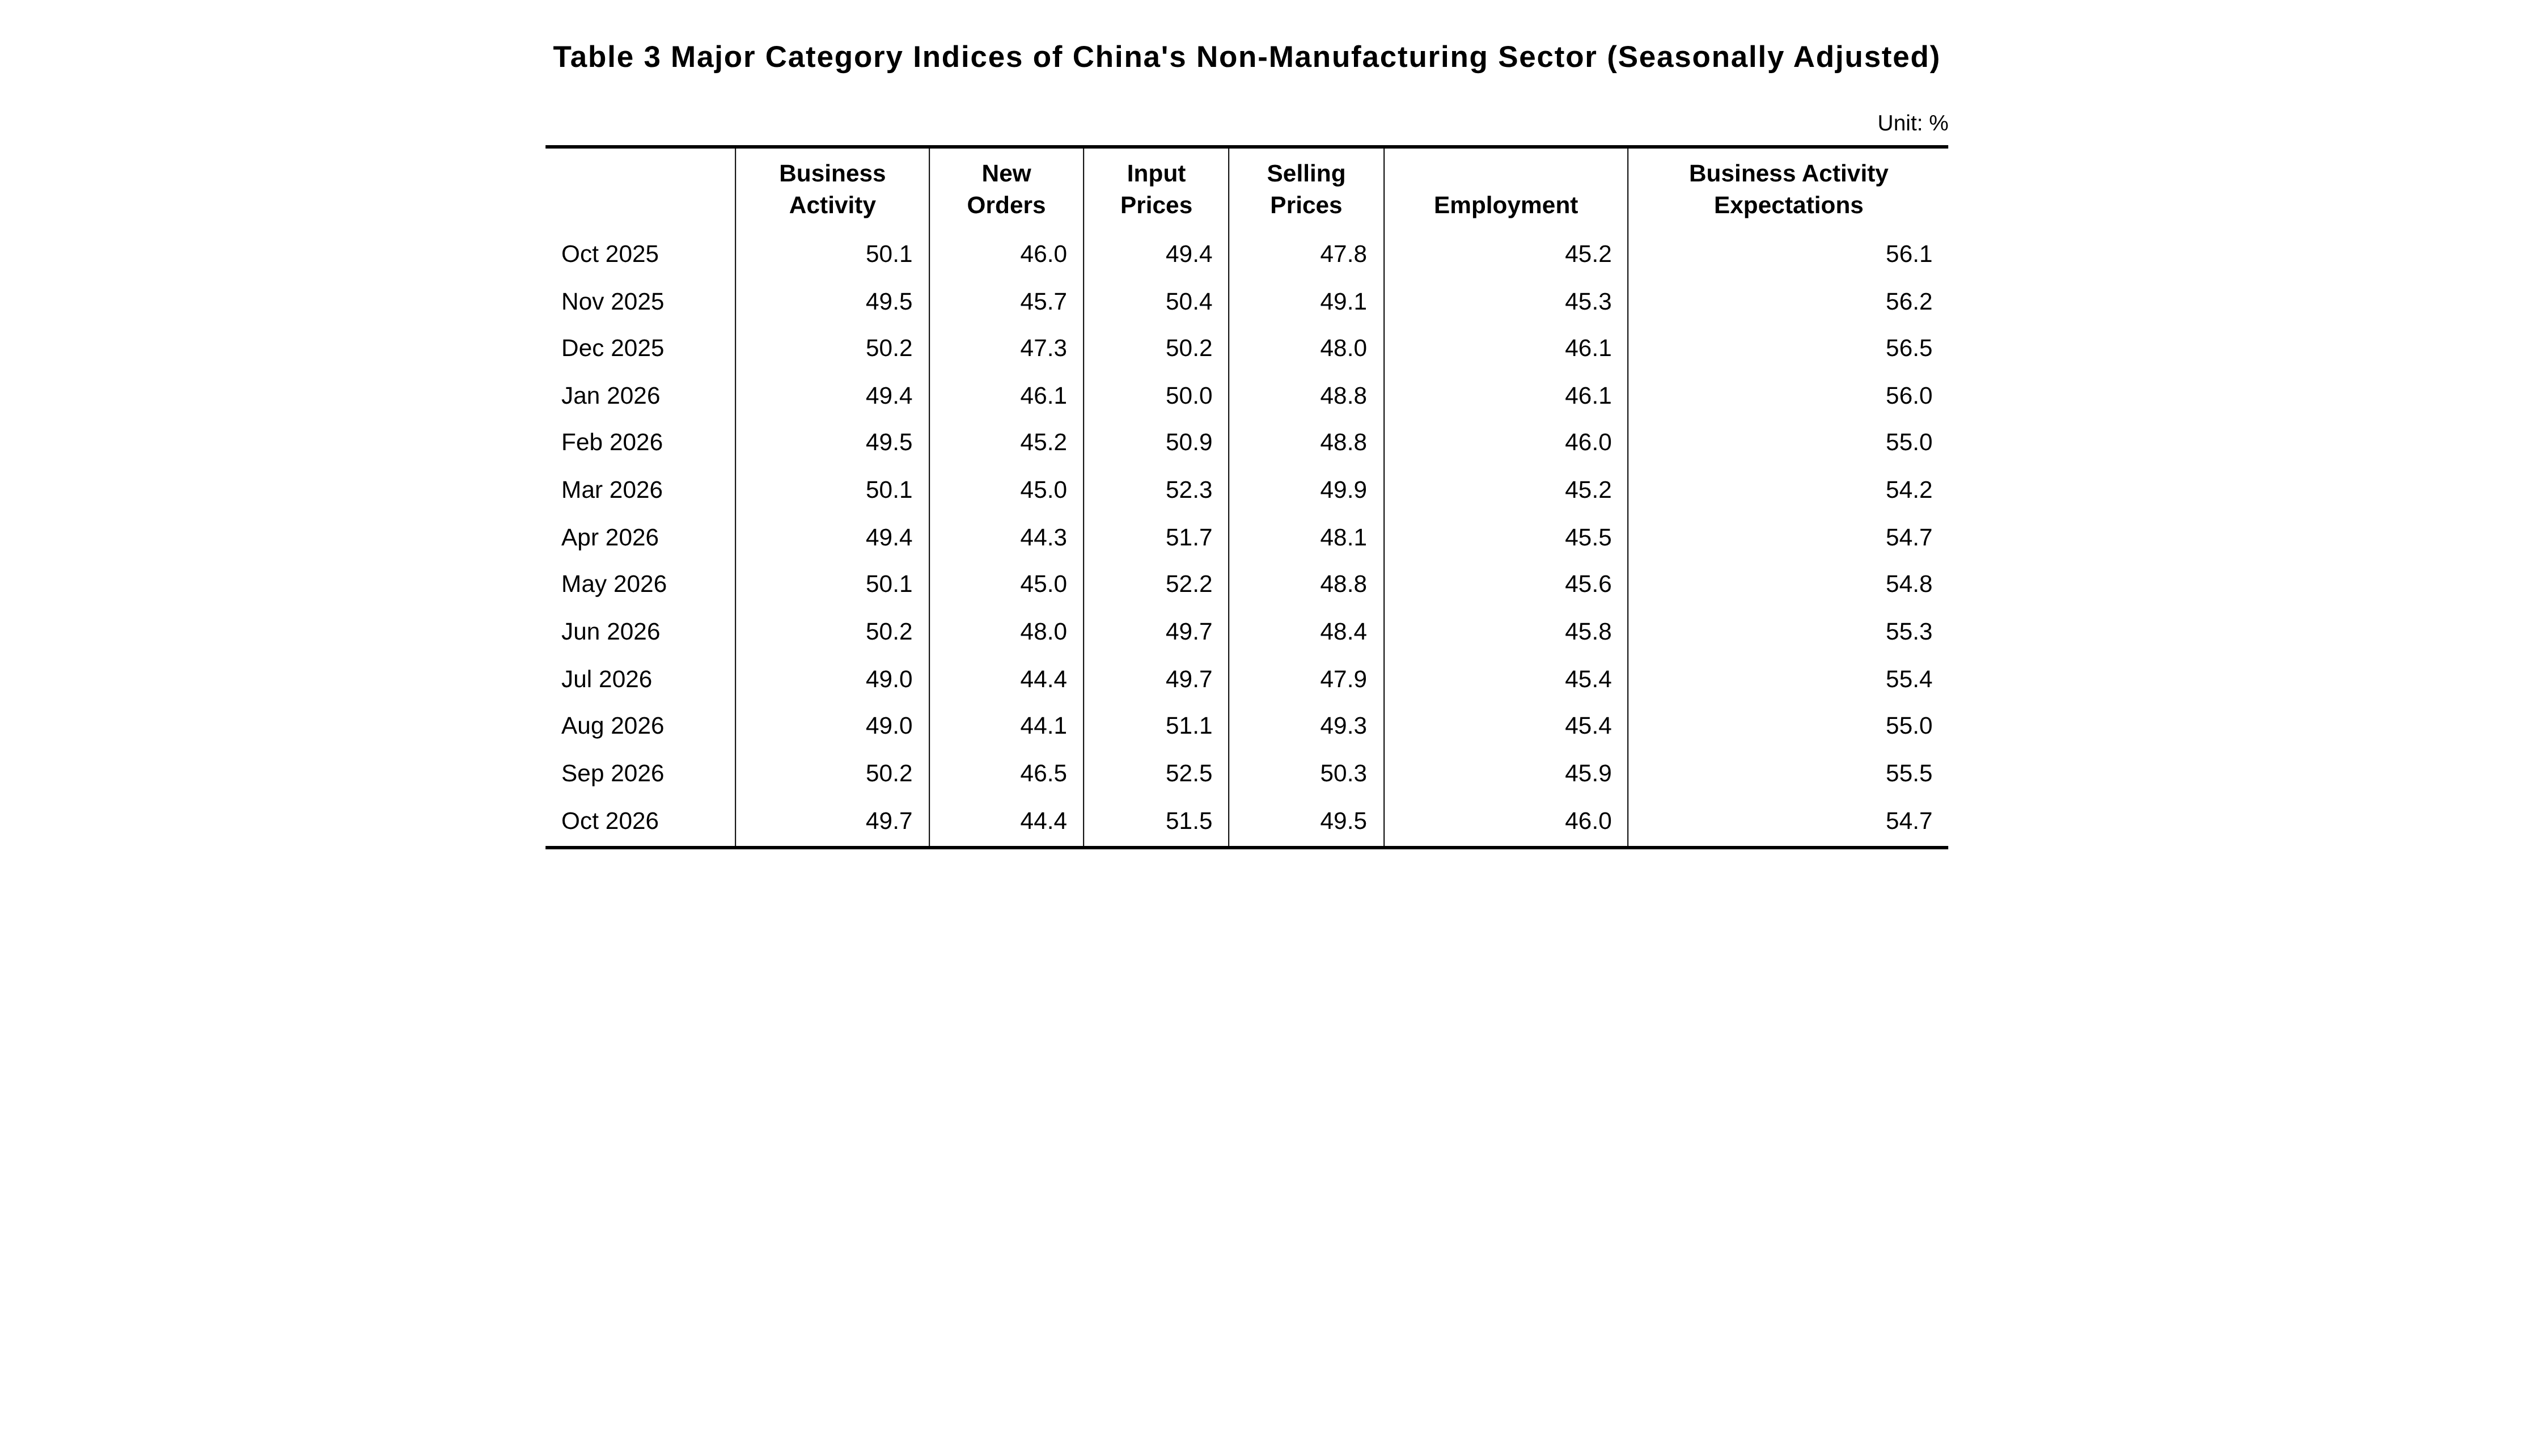
In October, the non-manufacturing business activity index was 49.7%, down 0.5 percentage point from the previous month, indicating a slight decline in the non-manufacturing business climate.
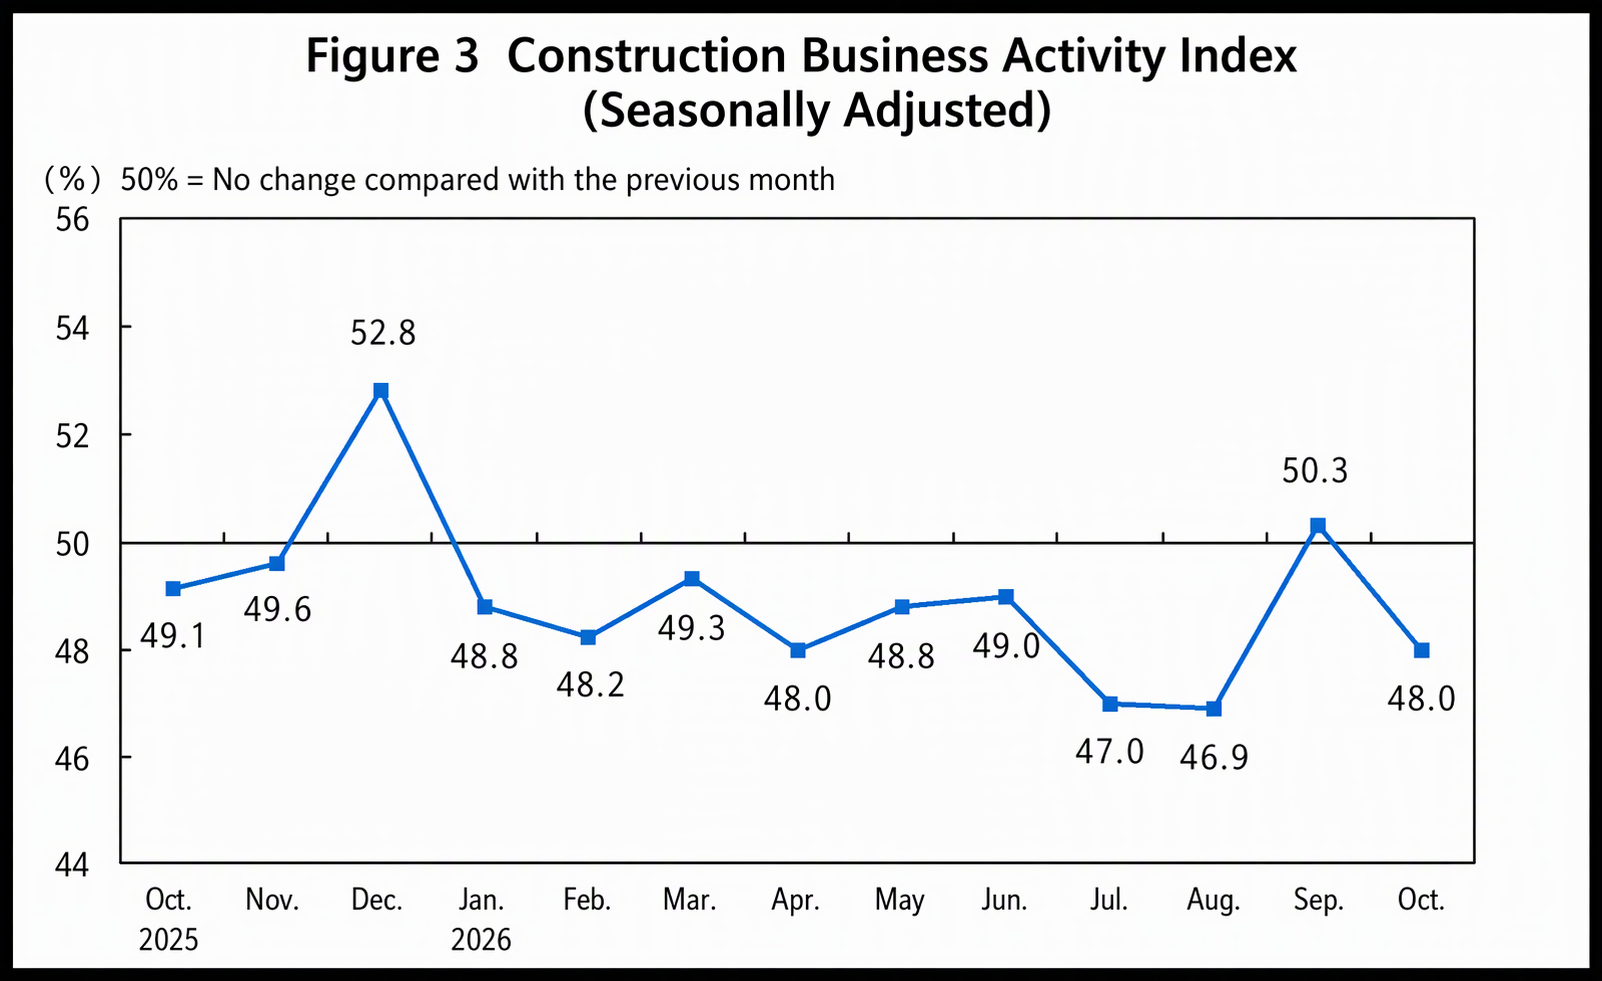
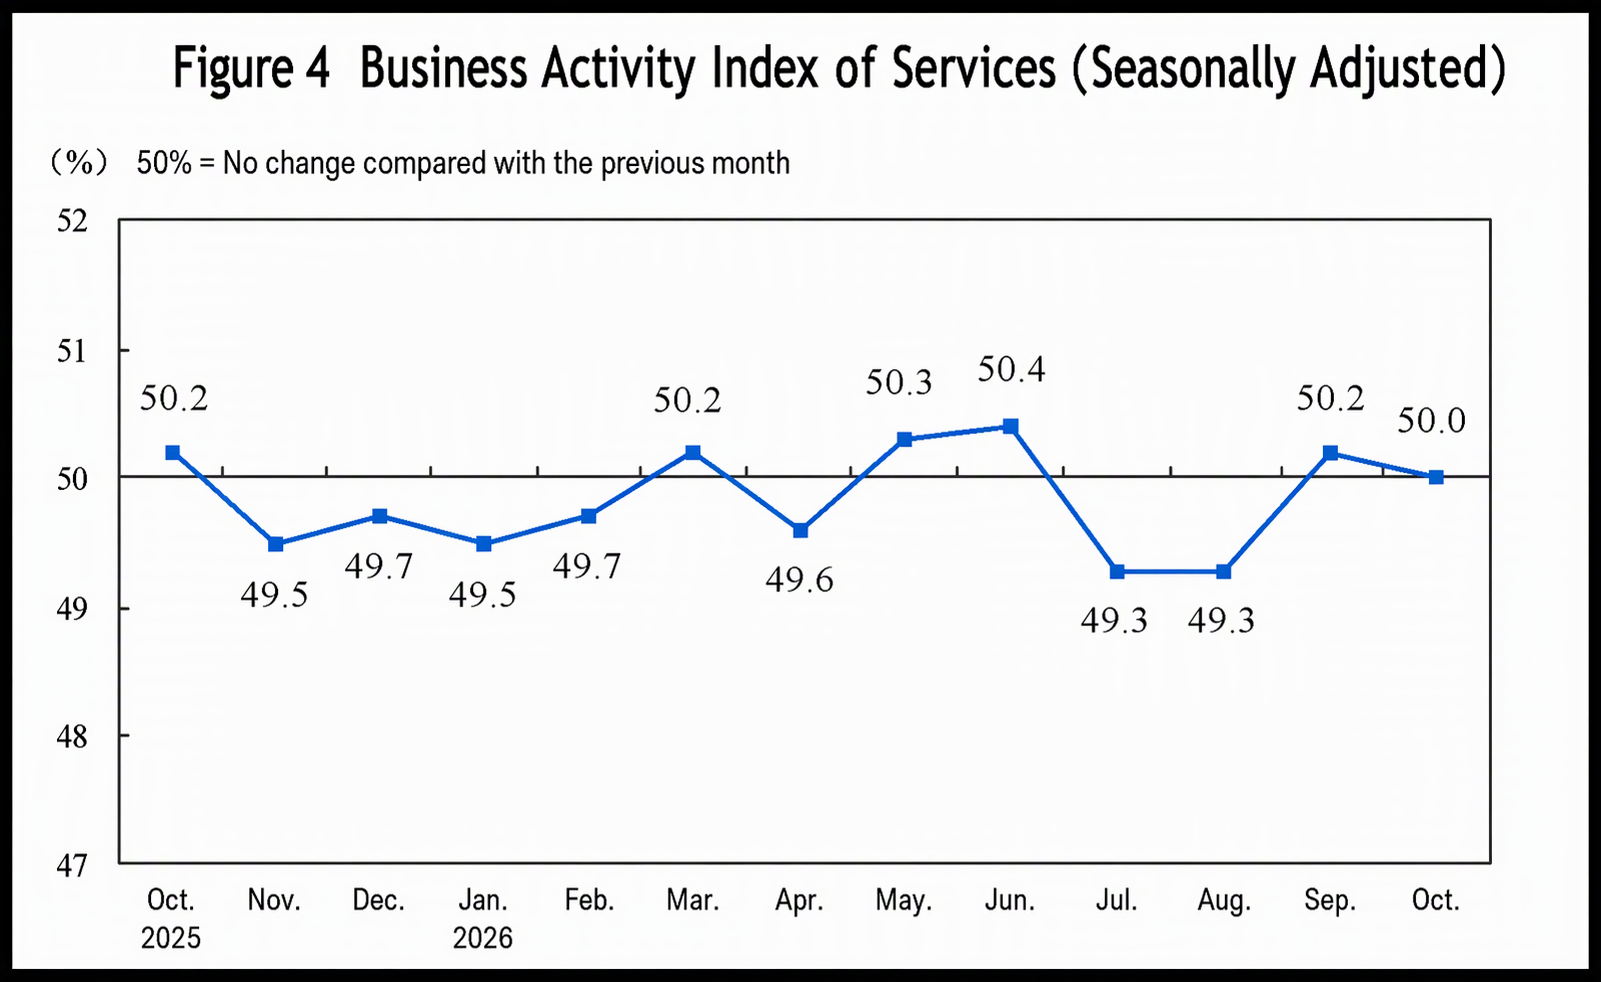
By industry, the construction business activity index was 48.0%, down 2.3 percentage points from the previous month; the services business activity index was 50.0%, down 0.2 percentage point from the previous month. Within the services sector, business activity indices for railway transport, water transport, postal services, and internet, software, and information technology services were all in the relatively high prosperity range above 55.0%; business activity indices for capital market services, insurance, and real estate were all below the threshold.
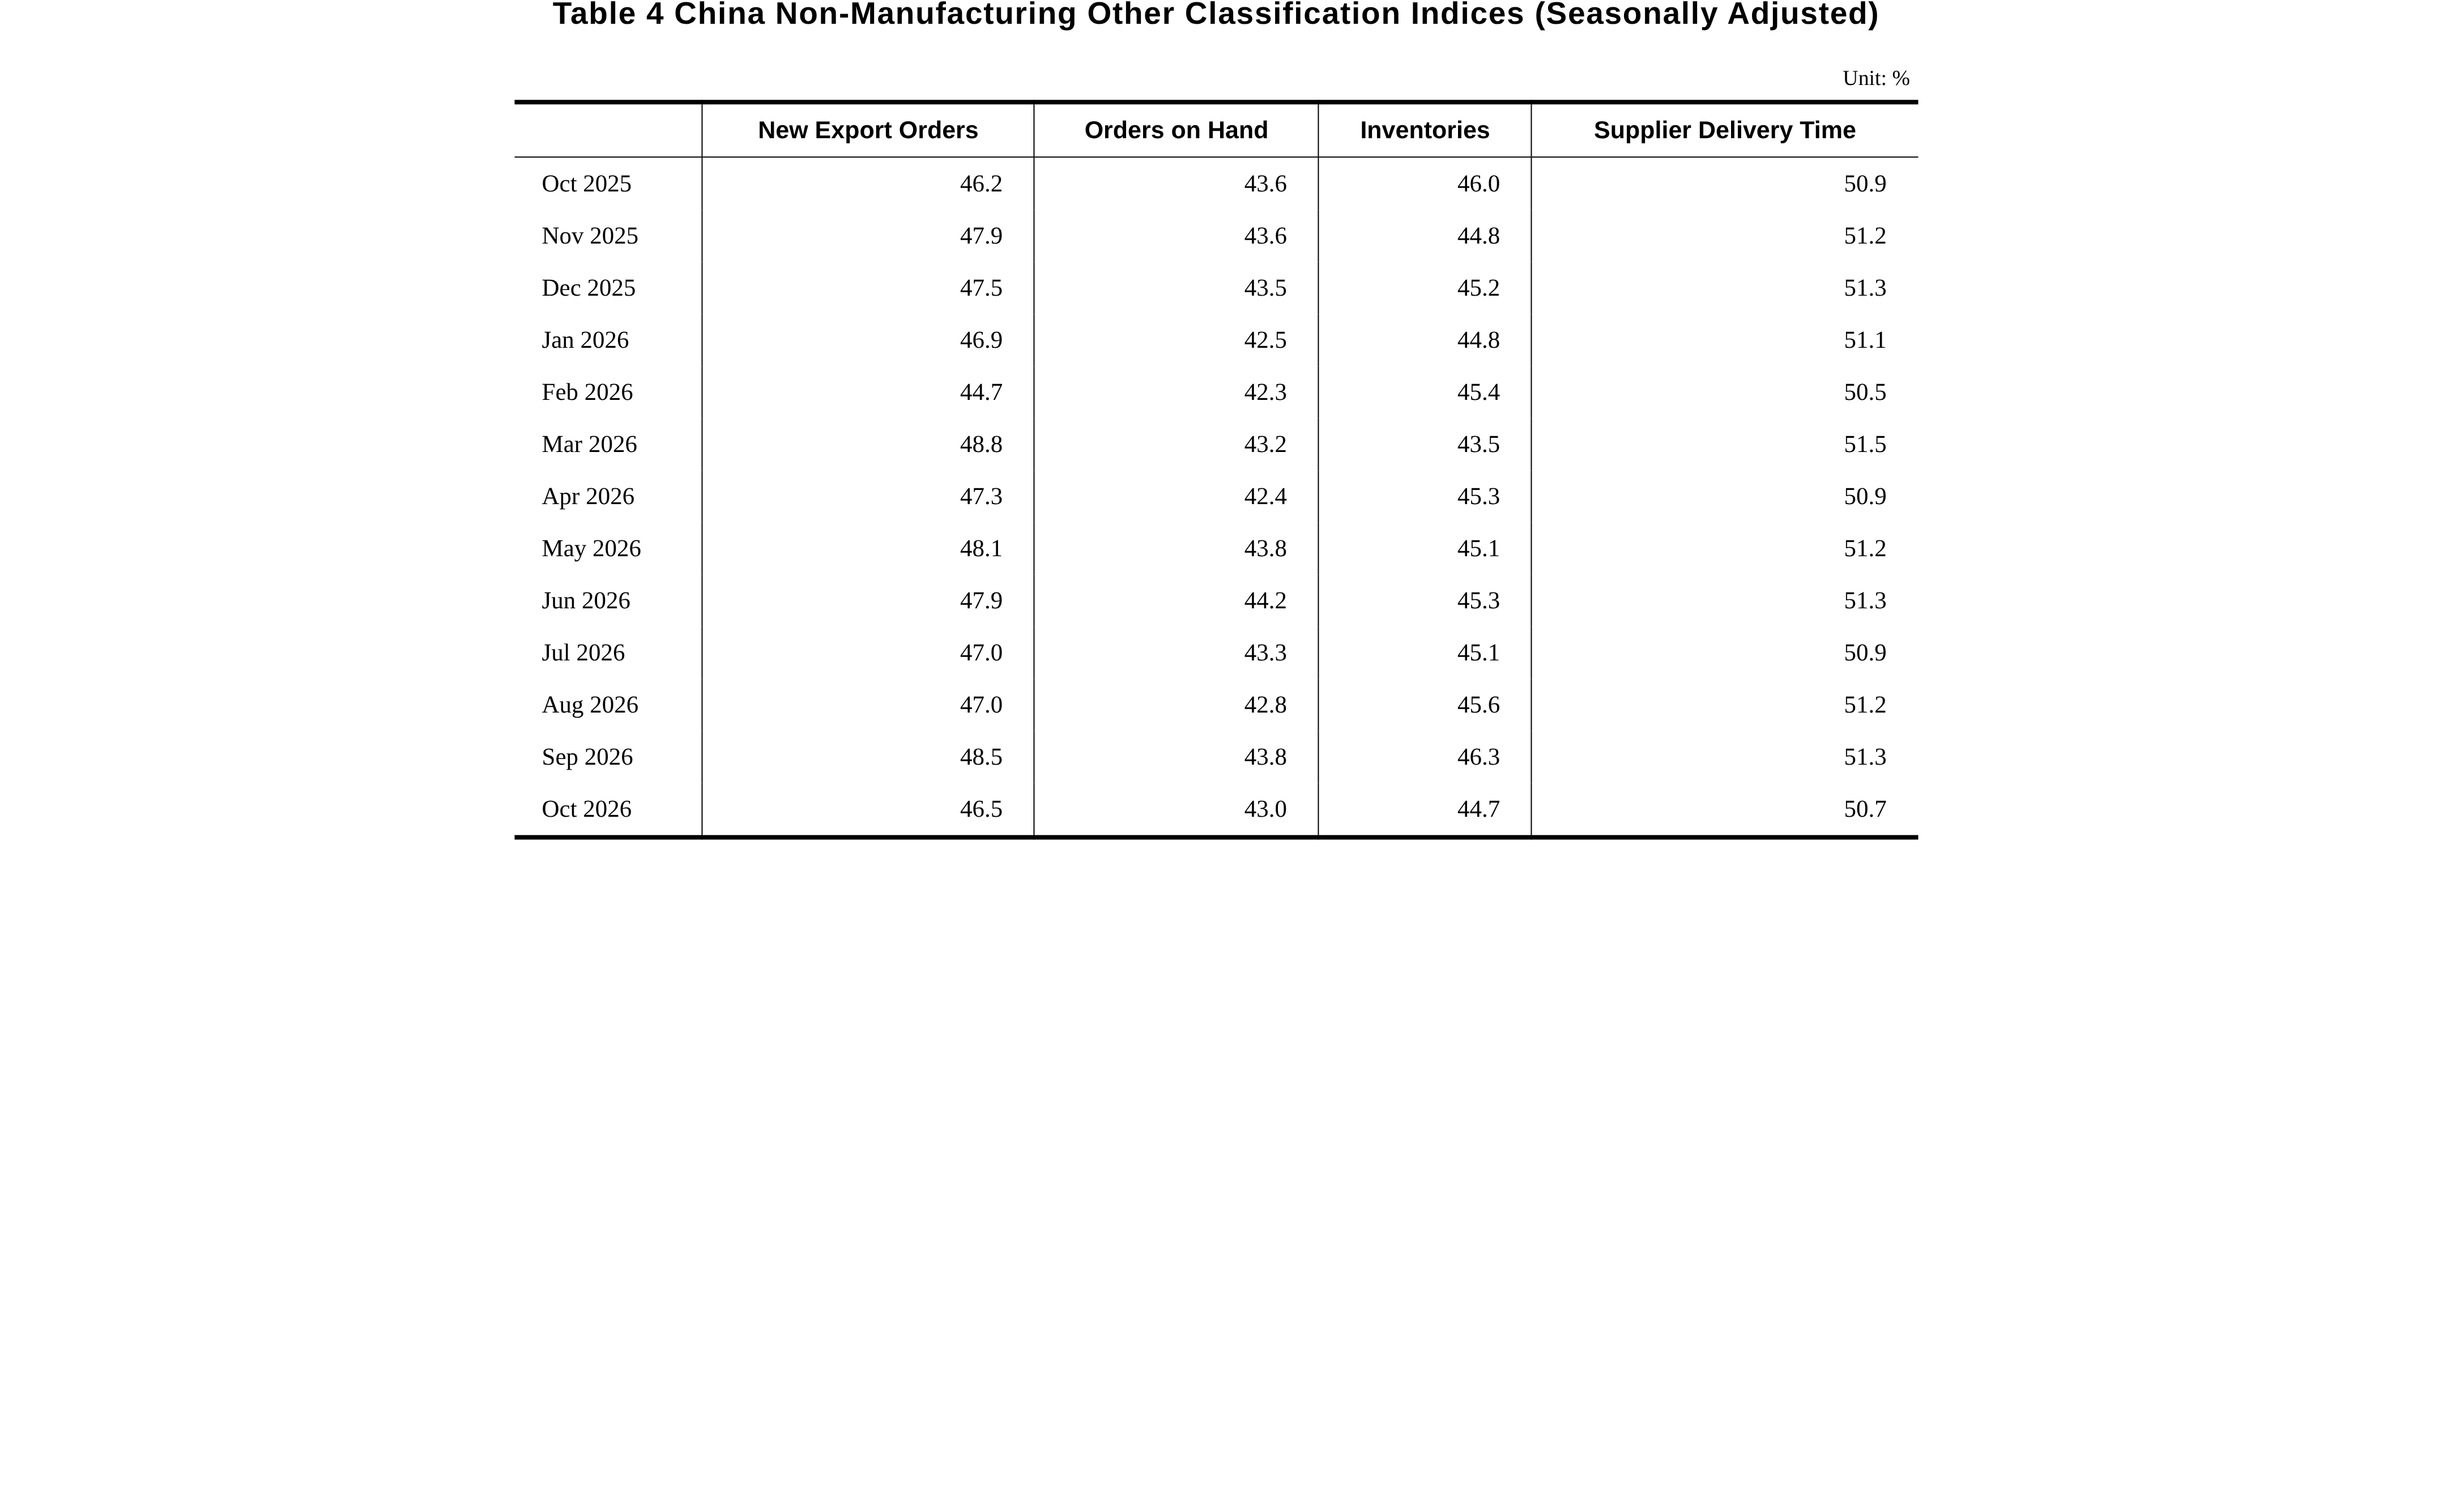
The new orders index was 44.4%, down 2.1 percentage points from the previous month, indicating a pullback in market demand in the non-manufacturing sector. By industry, the new orders index for construction was 40.0%, down 5.7 percentage points from the previous month; the new orders index for services was 45.2%, down 1.5 percentage points from the previous month.
The input price index was 51.5%, down 1.0 percentage point from the previous month, indicating that the overall increase in input prices for non-manufacturing enterprises' operating activities narrowed. By industry, the input price index for construction was 52.4%, down 1.6 percentage points from the previous month; the input price index for services was 51.4%, down 0.8 percentage point from the previous month.
The selling price index was 49.5%, down 0.8 percentage point from the previous month, indicating that the overall level of selling prices for non-manufacturing enterprises pulled back somewhat. By industry, the selling price index for construction was 48.9%, up 0.4 percentage point from the previous month; the selling price index for services was 49.6%, down 1.0 percentage point from the previous month.
The employment index was 46.0%, up 0.1 percentage point from the previous month, indicating a slight improvement in the employment climate of non-manufacturing enterprises. By industry, the employment index for construction was 42.0%, down 2.3 percentage points from the previous month; the employment index for services was 46.7%, up 0.5 percentage point from the previous month.
The business activity expectations index was 54.7%, down 0.8 percentage point from the previous month but still above the threshold, indicating that non-manufacturing enterprises remained confident about market development. By sector, the business activity expectations index for the construction sector stood at 52.3%, down 3.1 percentage points from the previous month; the business activity expectations index for the services sector stood at 55.2%, down 0.3 percentage points from the previous month.
III. China's Composite PMI Output Index
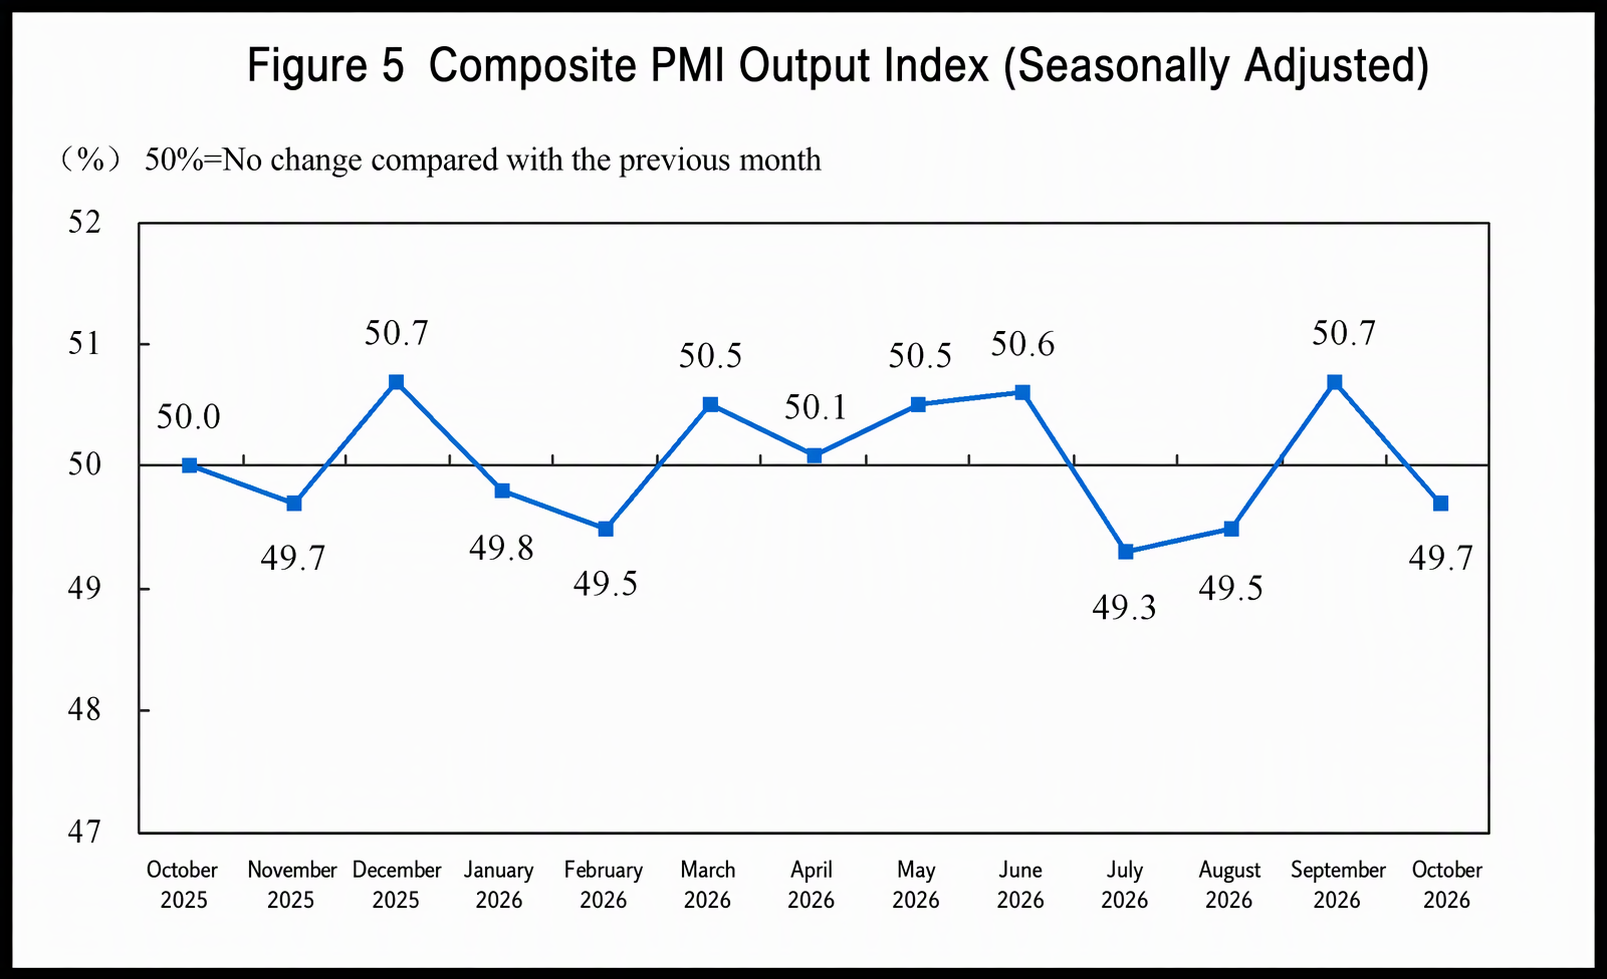
In October, the composite PMI output index stood at 49.7%, down 1 percentage point from the previous month, indicating an overall slowdown in the production and business activities of Chinese enterprises.
PMI Pulls Back in October
—Huo Lihui, Chief Statistician of the Service Industry Survey Center of the National Bureau of Statistics, Interprets China's October 2026 PMI
On October 31, 2026, the Service Industry Survey Center of the National Bureau of Statistics and the China Federation of Logistics and Purchasing released China's PMI. Huo Lihui, Chief Statistician of the Service Industry Survey Center of the National Bureau of Statistics, provided an interpretation.
In October, the manufacturing PMI, non-manufacturing business activity index, and composite PMI output index stood at 49.3%, 49.7%, and 49.7%, respectively, down 0.8, 0.5, and 1 percentage points from the previous month, with the economic prosperity level retreating from the previous month.
I. Manufacturing PMI Declines
In October, affected by factors such as the early release of some demand before the National Day holiday and the complex and volatile international environment, the manufacturing PMI fell to 49.3%.
(1) Both supply and demand slowed down. The manufacturing production index and new orders index stood at 49.8% and 49.4%, respectively, down 1.9 and 1.1 percentage points from the previous month. By sector, the production index and new orders index for railway, shipbuilding, aerospace equipment, computer communication and electronic equipment, and other sectors were both at 53.0% or above, indicating relatively active production and demand; the production index and new orders index for textiles, non-metallic mineral products, non-ferrous metal smelting and rolling processing, and other sectors were both below the threshold, indicating weakness on both the production and demand sides.
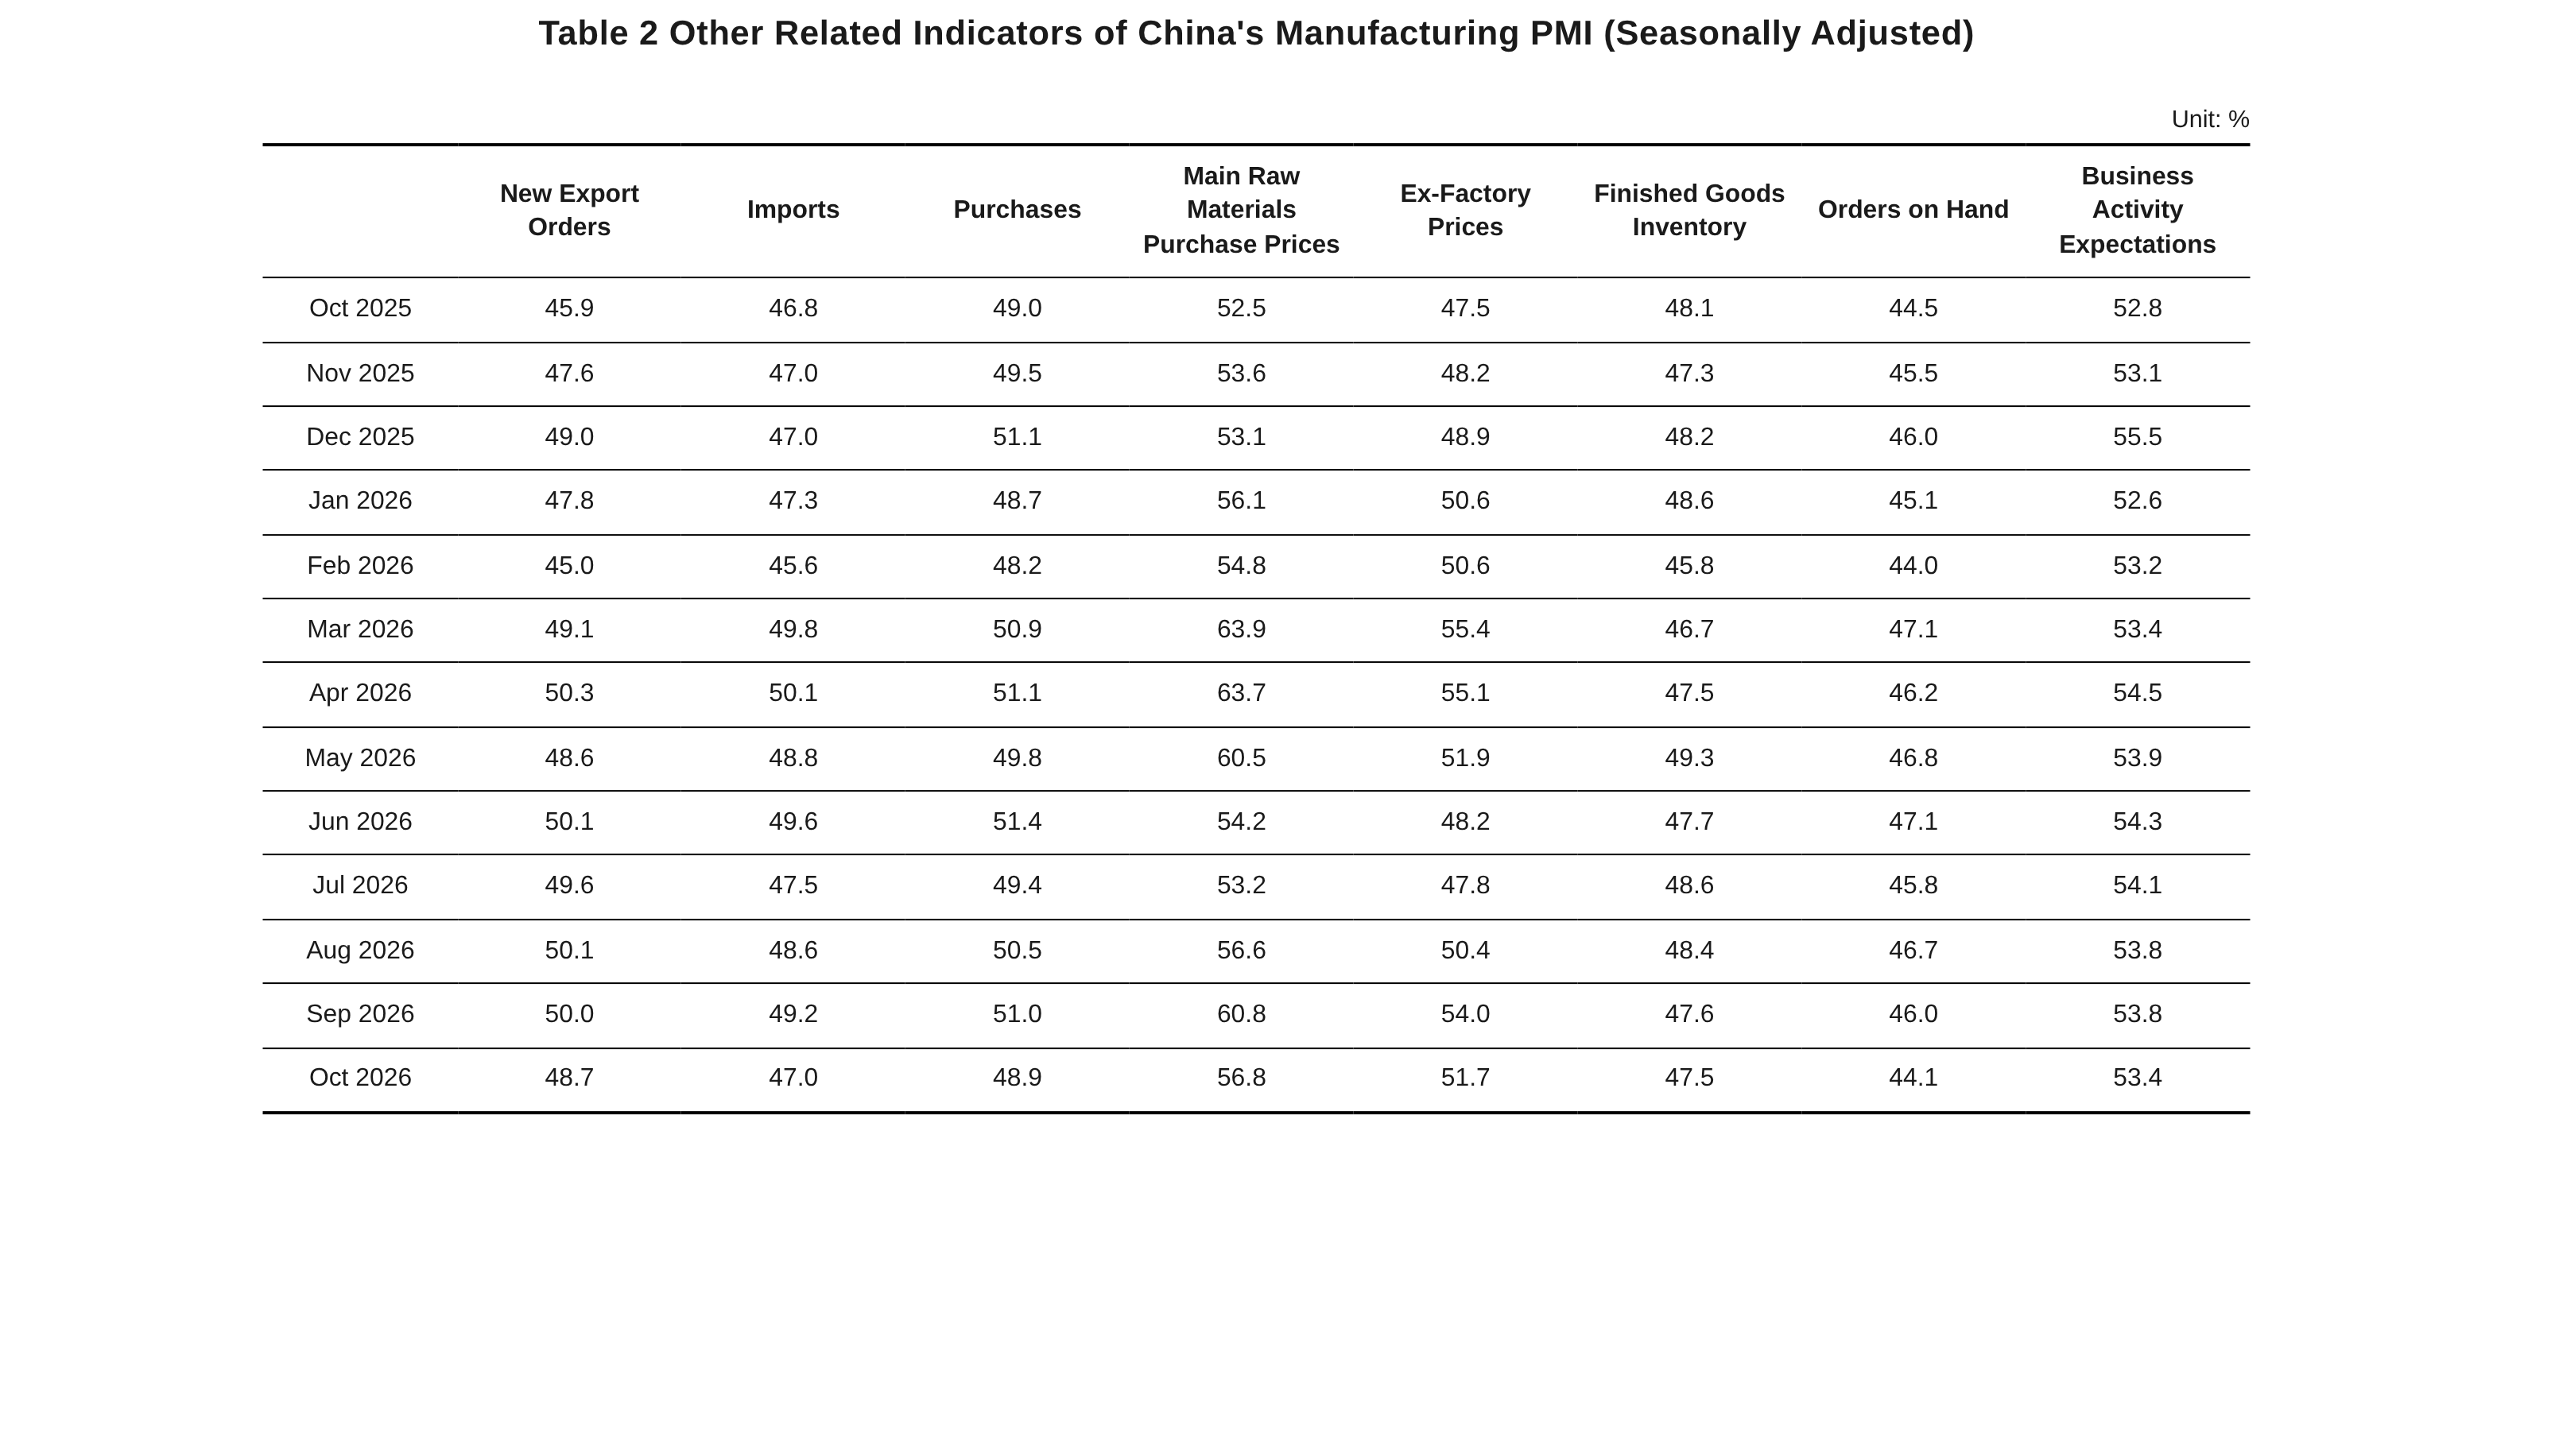
(2) New momentum maintained relatively rapid growth. The PMI for high-tech manufacturing and equipment manufacturing stood at 51.3% and 50.6%, respectively, remaining above the threshold, with production and business activities of related enterprises continuing to expand, and new quality productive forces sustaining a sound development trend. The PMI for the consumer goods sector and high-energy-consuming sector stood at 48.8% and 47.3%, respectively, down 1.9 and 0.7 percentage points from the previous month, with market activity weakening somewhat.
(3) Price indices retreated from highs. The manufacturing main raw material purchase price index and ex-works price index stood at 56.8% and 51.7%, respectively. Affected by the recent decline in prices of some non-ferrous metals and other bulk commodities, they fell 4 and 2.3 percentage points from the previous month, but remained in expansion territory, with the increase in manufacturing market prices narrowing. From an industry perspective, as international crude oil prices continued to climb, the two price indices for sectors such as petroleum, coal, and other fuel processing, as well as chemical fibers, rubber, and plastics products, both remained at high levels above 60.0%.
(4) Large enterprises continued to expand. The manufacturing PMI for large enterprises was 50.2%, down 0.4 percentage points from the previous month, yet still in expansion territory. The PMIs for medium-sized and small enterprises were 48.4% and 47.5%, respectively, down 1.3 and 1.4 percentage points from the previous month, with prosperity levels both pulling back.
II. The Non-Manufacturing Business Activity Index pulled back somewhat.
In October, affected by factors such as declining prosperity in some service sectors, the Non-Manufacturing Business Activity Index was 49.7%, down 0.5 percentage points from the previous month.
(1) The Services Business Activity Index was at the threshold. The Services Business Activity Index was 50.0%, down 0.2 percentage points from the previous month, with services sector prosperity stable with a slight decline. From an industry perspective, business activity indices for major service categories all rebounded. Among them, business activity indices for sectors related to travel and consumption during the National Day holiday, such as railway transport, accommodation, and culture, sports, and entertainment, rebounded notably and were all in expansion territory, with market activity improving. Business activity indices for water transport, postal services, and internet, software, and information technology services were all in the relatively high prosperity range above 55.0%, with business volumes of related enterprises growing relatively fast. Only the financial sector's business activity index pulled back, and by a relatively large margin, which was the main reason for the slight pullback in services sector prosperity this month. The Services Business Activity Expectations Index was 55.2%, remaining in a relatively high prosperity range, with most enterprises maintaining confidence in the development of the services market.
(2) The Construction Business Activity Index declined. The Construction Business Activity Index was 48.0%, down 2.3 percentage points from the previous month, with construction activity slowing down somewhat MoM. The Construction Business Activity Expectations Index was 52.3%, down 3.1 percentage points from the previous month, continuing to remain in expansion.
III. The Composite PMI Output Index pulled back.
In October, the Composite PMI Output Index was 49.7%, down 1.0 percentage point from the previous month, with overall production and business activities of enterprises in China slowing down somewhat. The Manufacturing Production Index and the Non-Manufacturing Business Activity Index, which constitute the Composite PMI Output Index, were 49.8% and 49.7%, respectively.