October 27, 2026
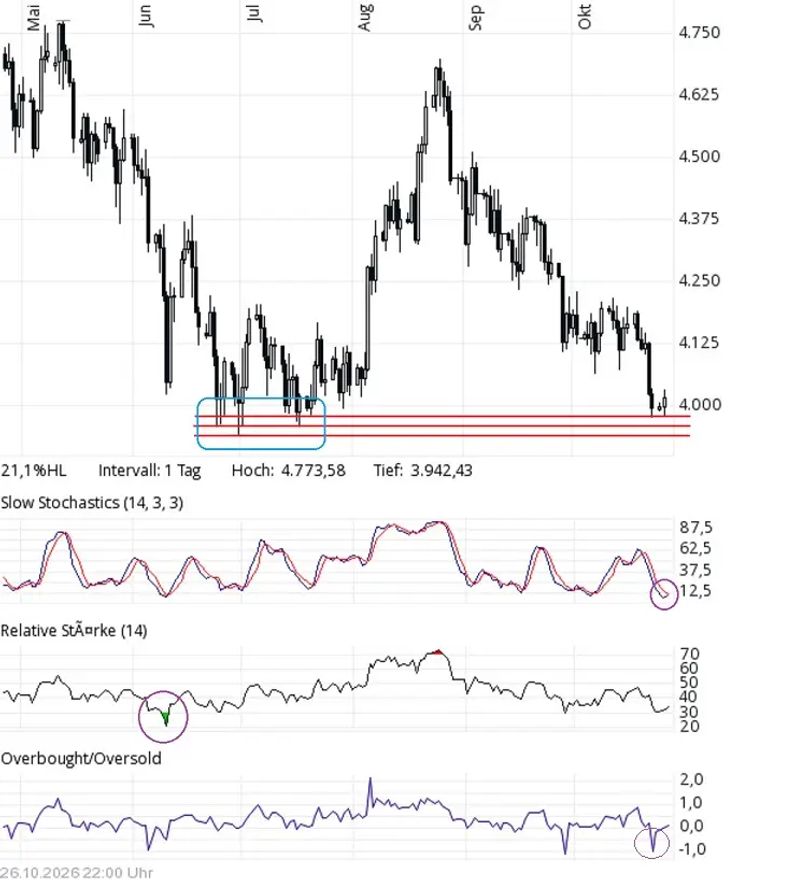
The gold price briefly fell below the US$4,000 mark in recent days and closed back above it today at US$4,016. The lows from the summer have not been reached again or undercut (so far).
Could a new upward move now begin?
A look at the indicators shows the stochastic oscillator close to a buy signal (when the blue line crosses above the red line), while the Relative Strength Index (RSI) is similarly close to a buy signal, trading at levels as low as in June—a reading between 20 and 30 is considered a buy signal here. With a reading near zero, the overbought/oversold indicator shows no excessive move to the upside or downside. The recent plunge into oversold territory was quickly reversed.
Source: Comdirect
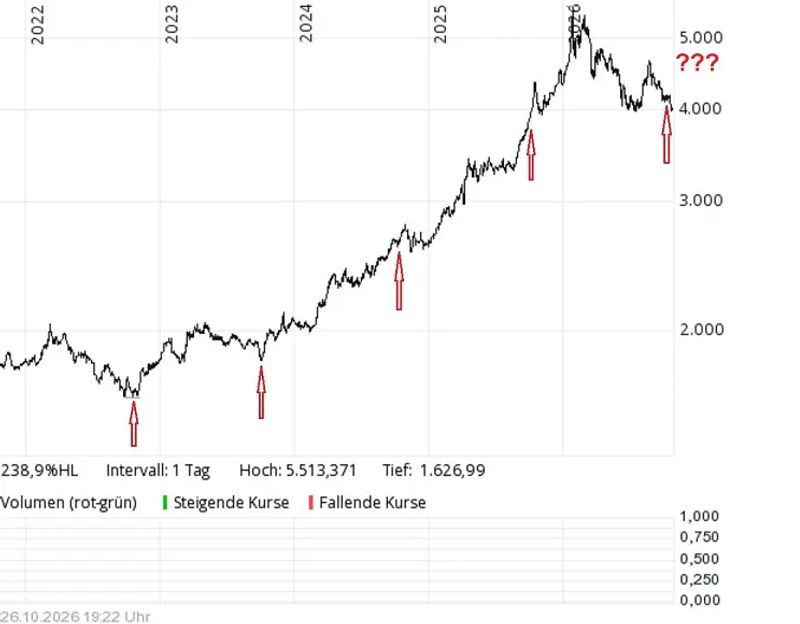
A look at the five-year chart is particularly interesting, as it provides an indication of the cyclical behavior of the gold price.
The red arrows each mark approximately the end of the first third of October. Looking at the subsequent performance of the gold price in each year, two facts stand out:
Source: Comdirect
+ the gold price rose through the end of each respective year (except in 2024, when it declined slightly)
+ after six months, the gold price was higher every year (in some cases significantly).
From this perspective, the prospects for the yellow metal's price to rise again are therefore not so bad.
Source:https://goldinvest.de/en/chartupdate-gold-fungieren-4-000-us-dollar-erneut-als-boden