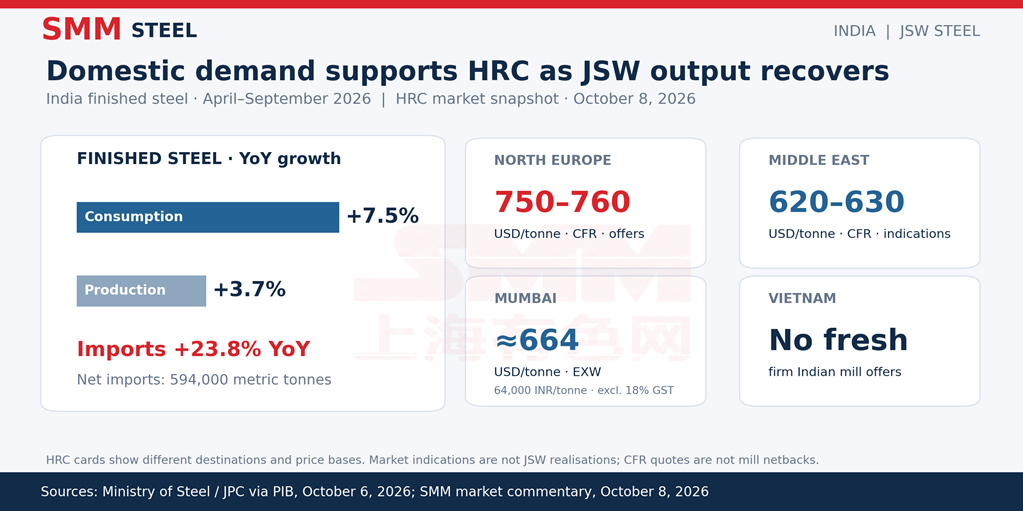
Europe remained the highest quoted outlet per SMM market tracking, with Indian HRC offers at 750–760USD/tonne CFR North Europe. Middle East indications were 620–630USD/tonne CFR, while no fresh firm Indian mill offers were reported to Vietnam. European deal flow remained slow, so the higher quotation does not establish stronger booked export sales.
For mill allocation decisions, the relevant comparison is the export netback after freight, inland movement, port and finance costs. European quota availability and the 50% out-of-quota duty shape market access, while CBAM adds embedded-emissions reporting and carbon obligations. The premium European quotation must therefore be assessed against clearance conditions and landed costs before it can support a realisation advantage.
Domestically, SMM’s October 8 commentary placed Mumbai HRC at approximately 664USD/tonne (64,000INR/tonne), ex-works and excluding 18% GST. This firmer domestic reference provides a supportive commercial setting for JSW’s production recovery, although it remains a market indication rather than the company’s realised price.
The Ministry of Steel’s provisional April–September figures strengthen the demand context. Finished-steel consumption increased 7.5% to 84.9 million tonnes, against production growth of 3.7% to 81.8 million tonnes. However, imports rose 23.8%, leaving India a net importer by 594,000 tonnes. Demand growth supports absorption of additional domestic supply, while imports preserve competition for buyers. These national finished-steel figures are separate from JSW’s crude steel production.
Operational performance: India drives the recovery
Against this market backdrop, JSW Steel’s July–September production recovery brings more supply into an Indian market where domestic HRC prices have strengthened, but export opportunities remain uneven. Consolidated crude steel output reached 7.27 million tonnes in Q2 FY27, up 10% quarter on quarter and 5% year on year on the company’s adjusted comparison. The commercial test now lies in converting this recovery into sales at sustainable realisations while managing input costs.
Indian production increased by approximately 720,000 tonnes sequentially, partly offset by a 40,000-tonne decline in Ohio.
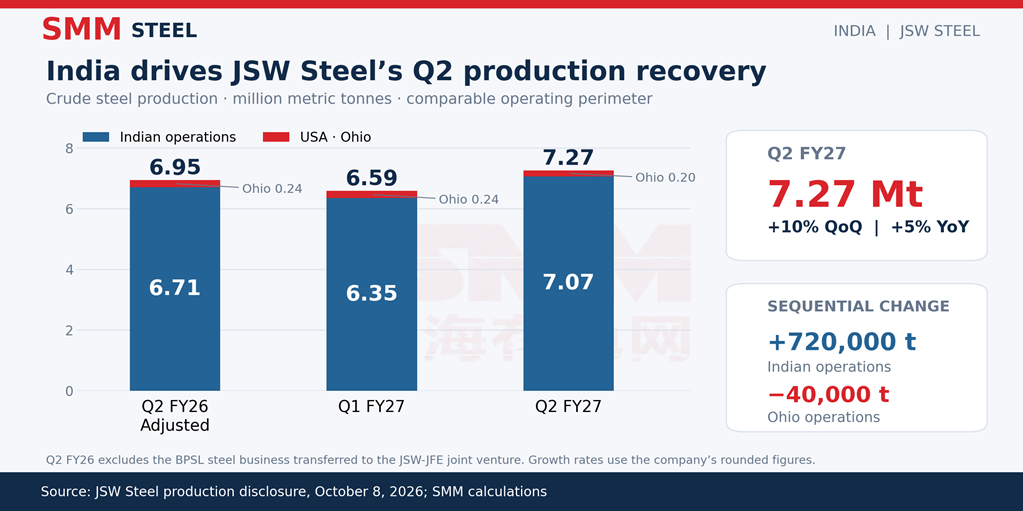
Indian capacity utilisation stood at 88% for the quarter and approximately 90% in September as Vijayanagar BF-3 continued ramping up. Q1’s 94% utilisation excluded BF-3 during its shutdown, preventing a direct comparison. The furnace’s expansion from 3.0 to 4.5 million tonnes per year was completed in June. Prior-year production figures exclude the BPSL business transferred to the JSW-JFE joint venture, preserving a comparable operating perimeter.
Against July’s FY27 production guidance of 29.75 million tonnes, first-half output of 13.86 million tonnes leaves 15.89 million tonnes for H2. Meeting that guidance would require average quarterly production approximately 9% above Q2’s rate—a further step beyond the recovery already achieved.
Financial performance: Realisations remain the critical variable
Q1 FY27 revenue stood at approximately USD4,894.3 million (INR473,640 million), with adjusted EBITDA of USD968.6 million (INR93,730 million). JSW’s bridge from pro forma Q4 FY26 attributed USD404.2 million (INR39,120 million) of EBITDA improvement to higher net sales realisations, offset by USD227.1 million (INR21,980 million) of cost pressure and USD115.9 million (INR11,220 million) of volume pressure. These figures show how selling prices and production costs can outweigh changes in volumes.
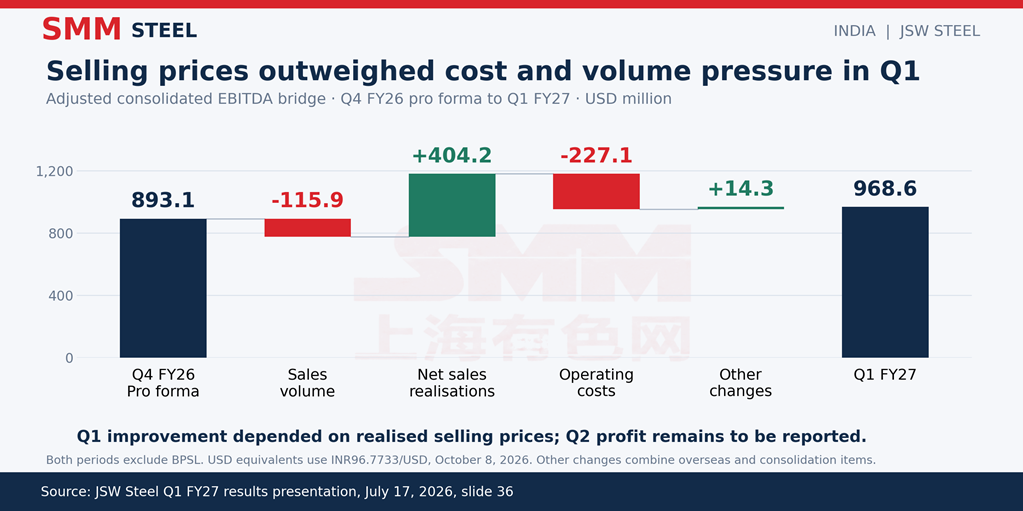
Management explained in July that earlier price increases flowed into Q1 realisations with a lag while input costs increased. That timing matters: October HRC quotations provide a reference for the October–December quarter, rather than evidence of JSW’s average July–September selling price.
The production rebound therefore establishes an operating improvement. Its earnings contribution depends on sales conversion, product mix, realised prices and the cost of producing the additional tonnes.
Business strategy: Domestic demand and product mix support placement
Domestic customers accounted for 89% of Indian operations’ Q1 sales, while value-added and special products represented 61%. Management also reported stronger flat-product sales. This established mix connects additional output with domestic industrial demand and differentiated products, although Q2’s sales split is still needed to assess the quarter’s actual allocation.
Outlook: The next results must connect tonnes with earnings
The October 23 financial results should show whether sales kept pace with production, how domestic and export realisations developed, and how input costs affected EBITDA per tonne. Into Q3, buyer acceptance of higher domestic HRC prices, BF-3’s ramp-up and confirmed export bookings will determine how much of the operating recovery becomes additional earnings.
![[SMM Analysis] Ningbo HRC Inventory Rises, Post-Holiday Demand Lags Expectations](https://imgqn.smm.cn/usercenter/rBCZR20251217171716.jpg)
![[Domestic Iron Ore Brief] Iron ore concentrates prices in the Tangshan area are likely to consolidate on a subdued note](https://imgqn.smm.cn/usercenter/hyiDc20251217171715.jpg)
![[SMM Steel]](https://imgqn.smm.cn/usercenter/fljuJ20251217171715.jpg)