The European Commission announced on 5 October that the CBAM certificate price for the third quarter of 2026 was EUR82.32 per tonne of CO₂ equivalent, up EUR7.04, or 9.35%, from EUR75.28 in Q2. For aluminium imports subject to CBAM, a higher certificate price increases the associated carbon cost when emissions parameters, the free allocation adjustment and other conditions remain unchanged.
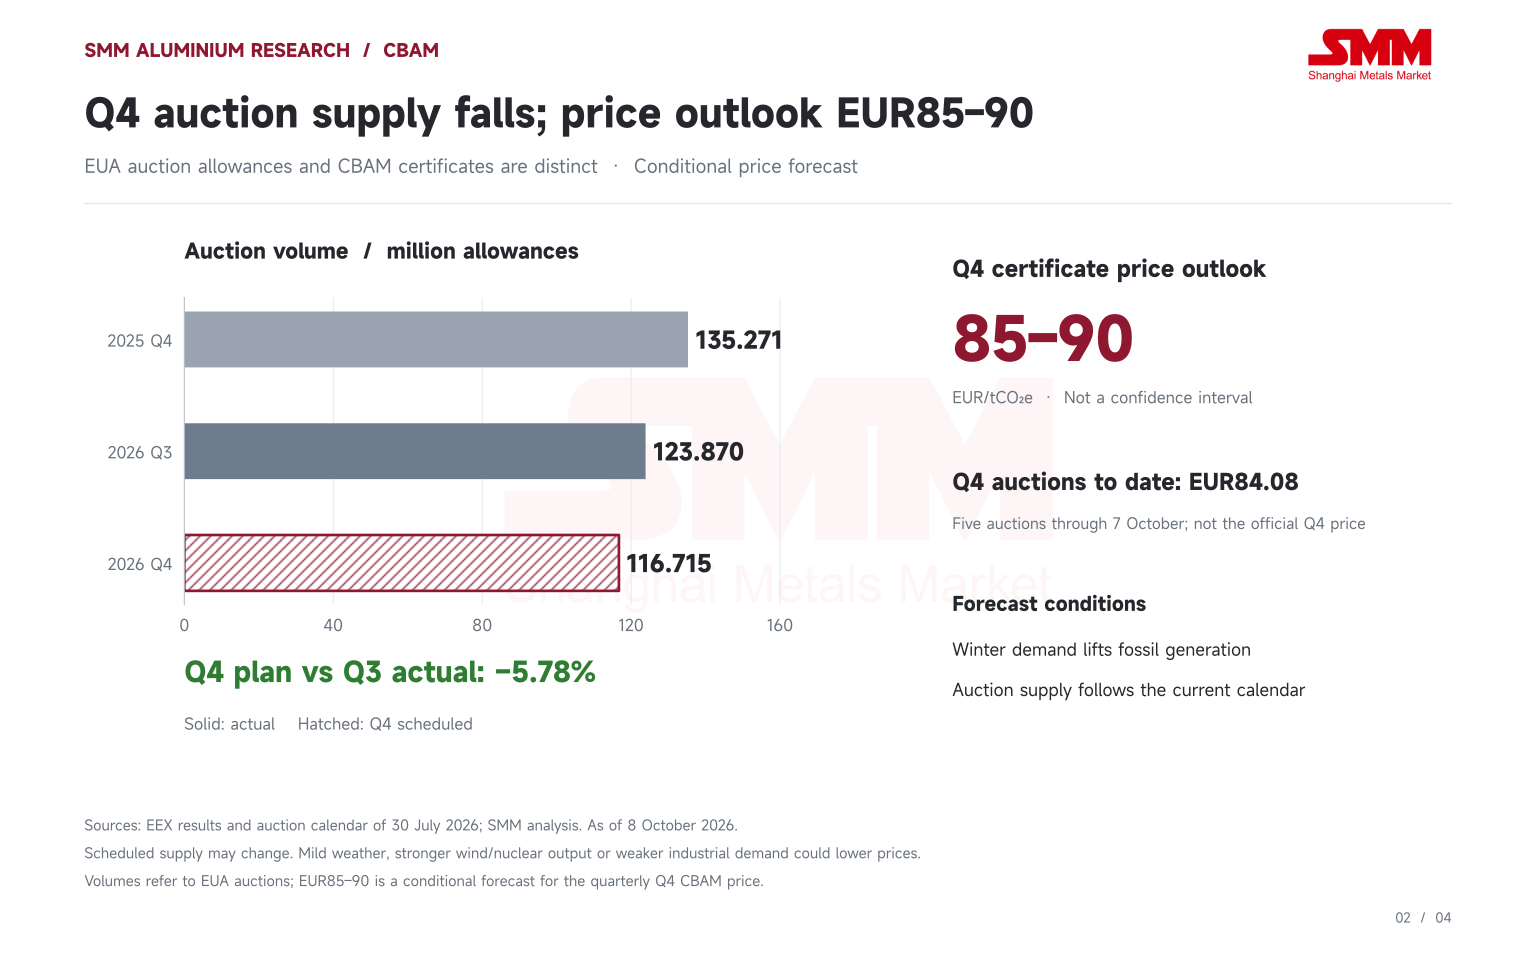
Considering the EU allowance auction schedule, early Q4 auction results and seasonal European electricity demand, SMM expects the Q4 CBAM certificate price could reach EUR85–90/tCO₂e if winter demand increases fossil generation and auction supply follows the current schedule. This conditional forecast is 3.26–9.33% above Q3.
Under the 2026 default-value methodology in SMM's aluminium CBAM calculator, the Q3 cost for Chinese-origin unwrought aluminium is approximately EUR157.44 per tonne of product, while that for an aluminium alloy hollow-profile example is EUR322.15/t. These represent increases of EUR13.46/t and EUR27.55/t from Q2. Products requiring more net certificates per tonne are more sensitive to the same increase in the certificate price.
Auction supply is scheduled to decline further in Q4
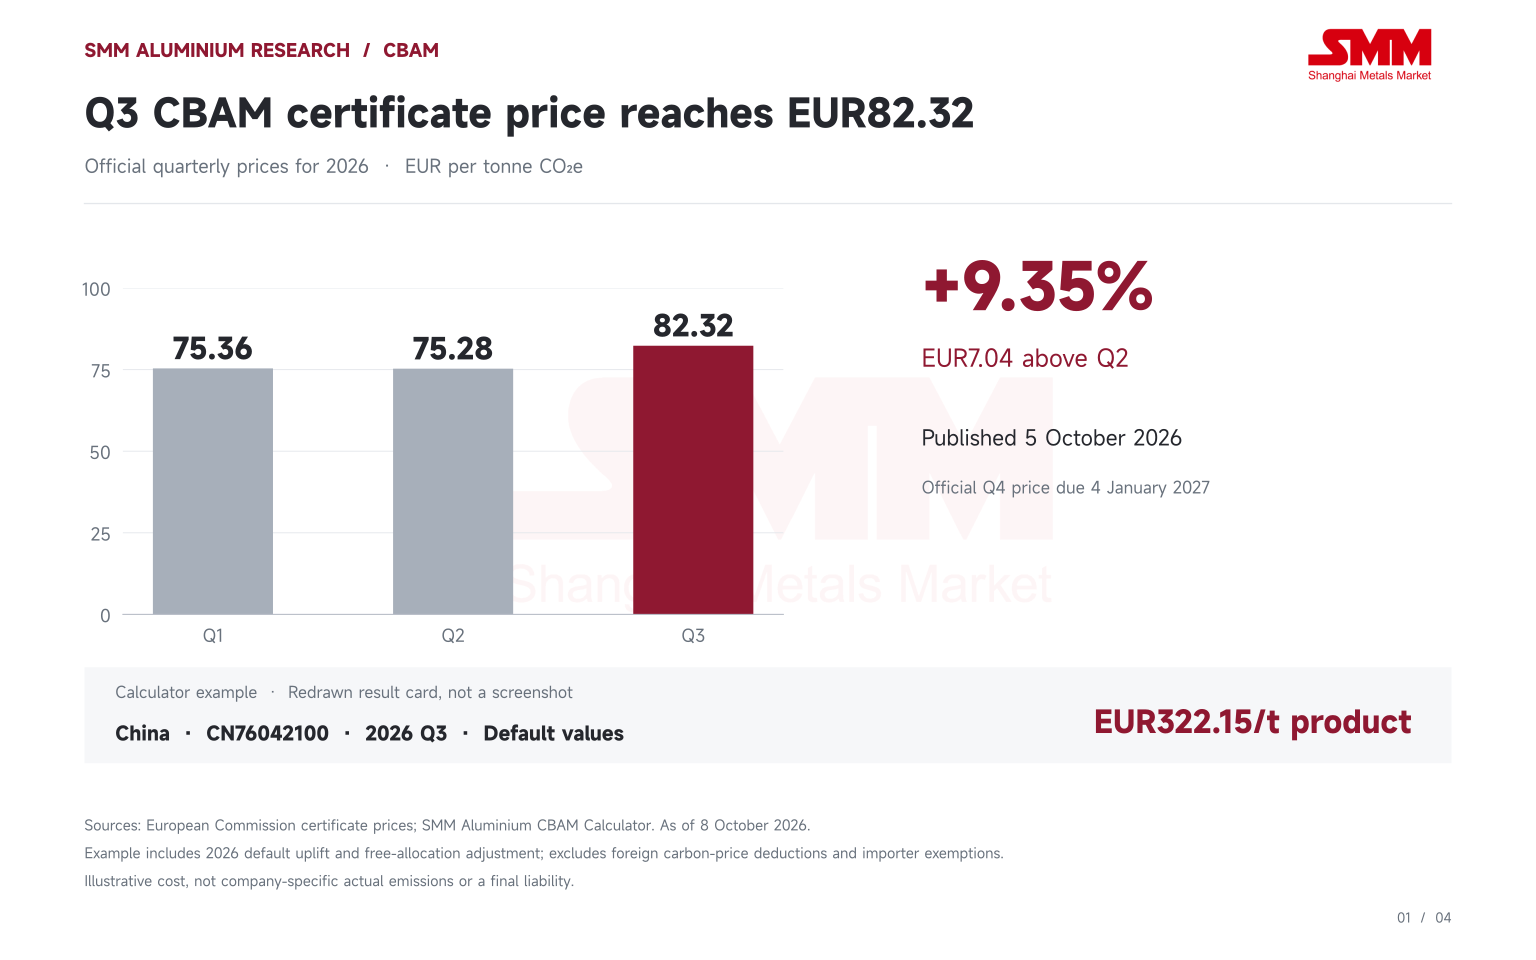
CBAM certificate prices are published quarterly for 2026 and calculated from the weighted average of EU Emissions Trading System allowance auction clearing prices. The price moved from EUR75.36 in Q1 to EUR75.28 in Q2, before rising to EUR82.32 in Q3. The official Q4 price is scheduled for publication on 4 January 2027.
The relevant supply changes concern EU ETS allowances, or EUAs, sold at auction. SMM's aggregation of EEX results shows Q3 2026 auction volume of 123.870 million allowances, down 24.46% year on year. However, it was almost unchanged from Q2, declining by only 1,500 allowances. The cessation of additional auctions was a notable Q3 development. Under REPowerEU, the Member State component, MS-RRF, reached its EUR8 billion revenue target on 22 June, and the Innovation Fund component, IF-RRF, reached its EUR12 billion target on 13 July. From 14 July, the latter's 571,000 allowances per common-platform auction were removed, reducing the scheduled volume per auction through the end of August from 2,817,500 to 2,246,500 allowances. The latest calendar puts Q4 supply at 116.715 million allowances, 5.78% below actual Q3 volume and 13.72% below Q4 2025. This provides support from the supply side. However, the additional RRF auctions were already due to end by August, so their cessation should not be counted again as a newly cancelled Q4 allocation. The Market Stability Reserve, or MSR, also requires a clear comparison baseline. The late-July calendar incorporated the September–December MSR adjustment, reducing volumes relative to the previous provisional schedule. Yet the intake for September 2026–August 2027 is 190.494 million allowances, below 275.532 million in the preceding period.
Winter demand could support prices but the generation mix remains decisive
Higher winter electricity demand may increase power generators' allowance requirements, depending on how the additional electricity is supplied. Cold weather combined with low wind output could increase reliance on fossil generation and strengthen support for carbon prices. Strong wind or nuclear output could alleviate that pressure.
Commission electricity reports show EU consumption rising from 583TWh in Q3 2025 to 636TWh in Q4, an increase of approximately 9.09%. The fossil generation share rose from 27% to 32%, while the European Power Benchmark increased from EUR78/MWh to EUR88/MWh, or approximately 12.82% using the reports' rounded figures. This illustrates how winter demand and the generation mix can jointly affect electricity and carbon markets. Seasonality is not a one-way rule. The Commission's original reports showed the Q4 power benchmark increasing by only about 2% quarter on quarter in 2023, while falling by 45% in 2022. Falling energy prices, weather and broader supply-demand adjustments can outweigh winter demand growth.
By 7 October, five Q4 EUA auctions had produced a volume-weighted average price of approximately EUR84.08, already above Q3. Assuming the remaining volumes follow the current calendar, the remaining auctions would need to average approximately EUR85.09 for the full-quarter price to reach EUR85, or EUR90.59 for it to reach EUR90. The lower end is therefore closer to current auction levels, while the upper end requires sustained further strength.
Against this supply schedule and the possibility of higher winter demand, SMM uses EUR85–90 as a conditional Q4 forecast range. A mild winter, recovering wind output, improved nuclear availability or weaker industrial demand could push prices below it. Persistent cold and low wind could create stronger upside pressure. The early-Q4 EUR84.08 figure is an interim auction average, not an official quarterly CBAM certificate price.
Chinese aluminium products face differing increases per tonne
The effect of higher carbon prices depends on default emissions, production routes and the free allocation adjustment. This calculation uses the 2026 default-value methodology: a 10% uplift is applied to default direct emissions, followed by a deduction based on the relevant route's benchmark B, the 97.5% free allocation factor and a cross-sectoral correction factor of 1.00. The resulting net certificate requirement is multiplied by the quarterly certificate price.
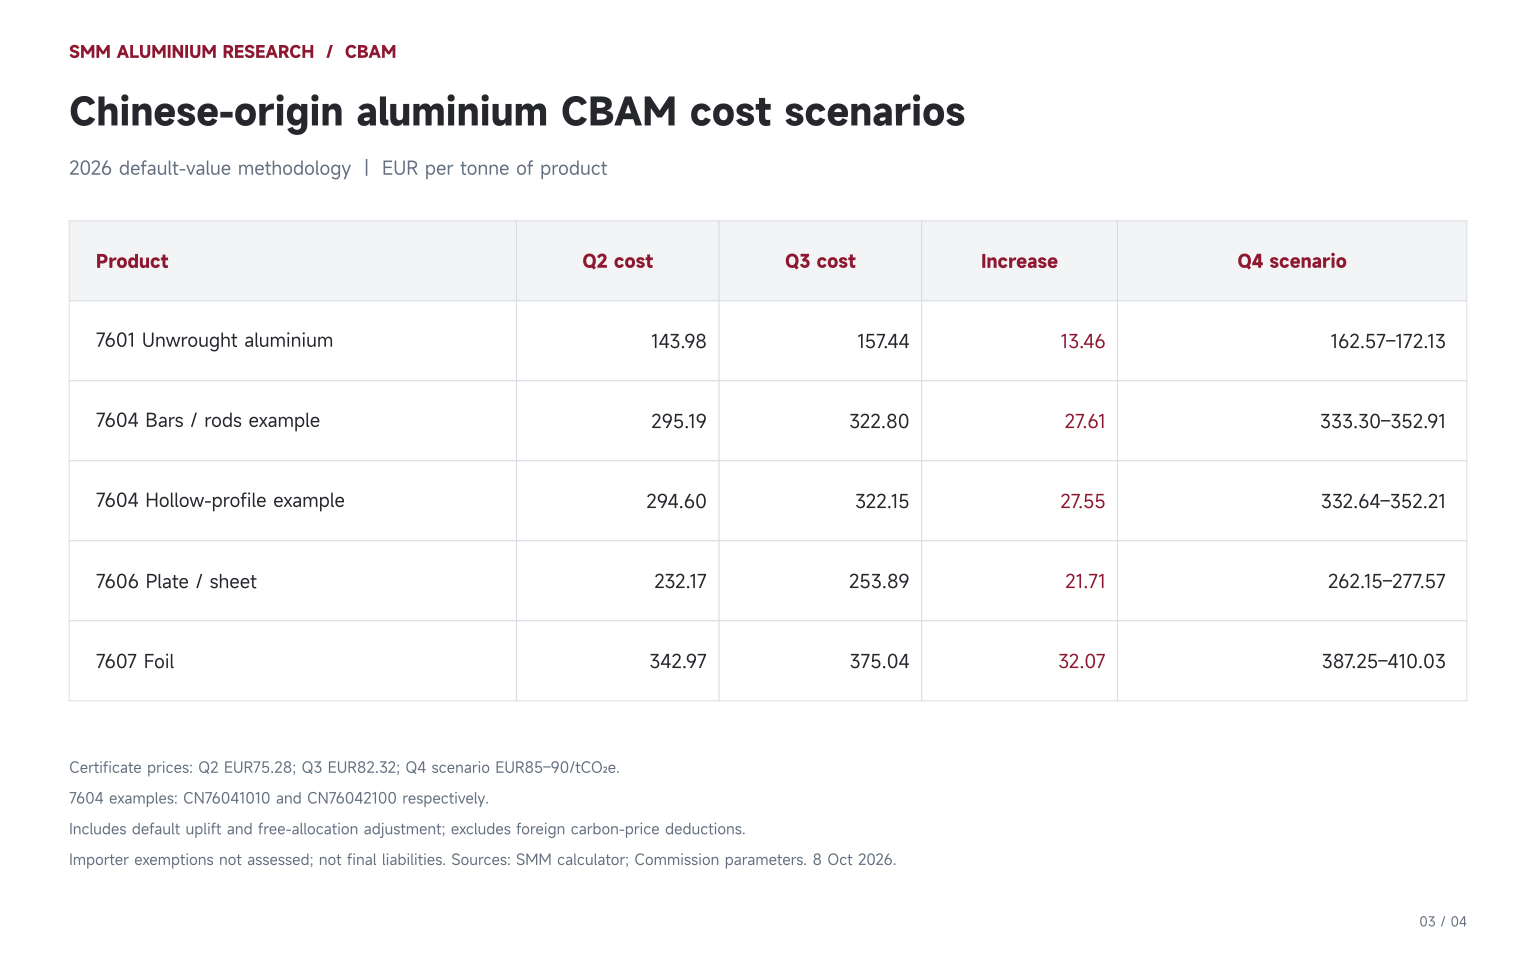
For the Chinese hollow-profile example, the net requirement is approximately 3.9134 certificates per tonne, compared with 1.9126 for unwrought aluminium. The same EUR7.04 increase in certificate prices consequently produces roughly twice the cost increase per tonne for the profile. For a static 1,000-tonne example, the increases from Q2 are approximately EUR27,600 and EUR13,500 respectively.
This measures sensitivity under the specified defaults and benchmark adjustments. It does not establish an equivalent increase in actual emissions from processing, nor do country defaults describe an individual plant's real carbon intensity. The direct emissions used in the definitive-period aluminium calculation must also be distinguished from the indirect influence of European electricity conditions on EUA prices.
Country costs and import volumes determine the scale of exposure
China is not the EU’s largest external supplier of unwrought aluminium. In 2025, EU imports from China were approximately 11,700 tonnes, compared with 593,100 tonnes from Canada, 573,800 tonnes from Mozambique, 476,100 tonnes from Bahrain and 454,300 tonnes from the UAE. Under the same default-value approach, Q3 unit costs are EUR63.27/t for Canada, EUR175.37/t for Mozambique and EUR55.12/t for both Bahrain and the UAE, compared with EUR157.44/t for China.
Holding 2025 trade volumes constant and applying 2026 parameters and the Q3 price gives scenario costs of approximately EUR100.6 million for Mozambique's 7601 supply, EUR37.52 million for Canada and EUR1.85 million for China. High unit cost and high aggregate exposure are different measures; import volumes matter alongside cost per tonne.
The pattern differs for 7604. EU imports from Türkiye were approximately 210,700 tonnes in 2025, compared with 24,900 tonnes from China and 24,000 tonnes from Bosnia and Herzegovina. Weighting by each origin's actual CN-level import volumes gives the following results:
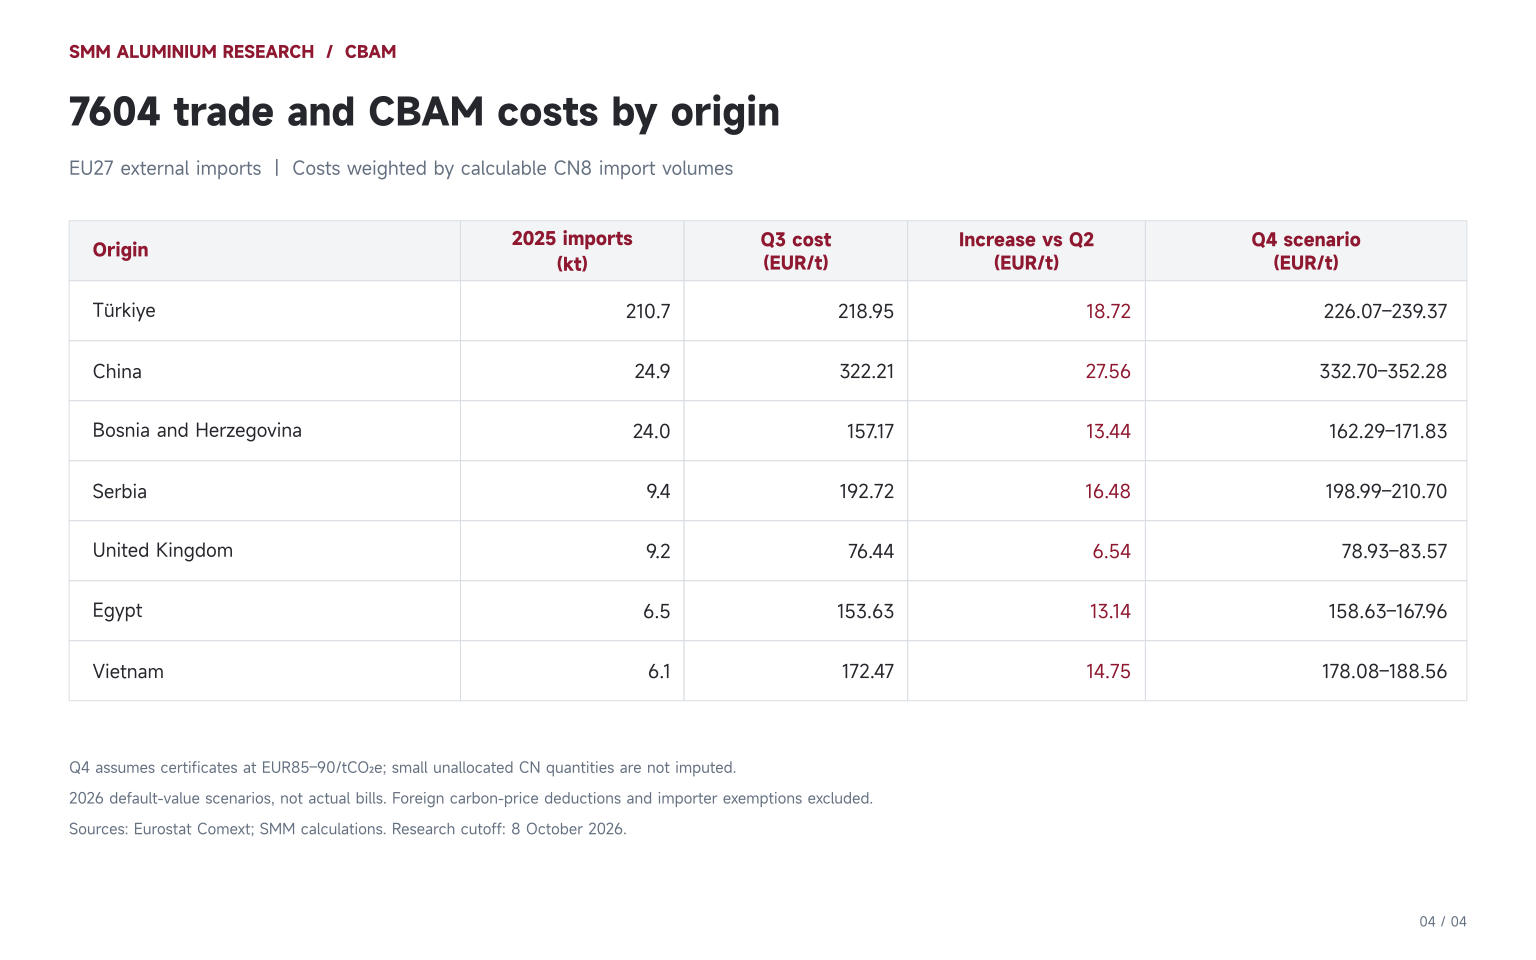
With 2025 trade held constant, Türkiye's 7604 scenario cost at the Q3 price is approximately EUR46.14 million, compared with EUR8.02 million for China. The price increase alone from Q2 to Q3 adds approximately EUR3.95 million and EUR0.69 million respectively. China has the higher unit cost, but Türkiye's larger trade volume produces a higher aggregate amount.
Southeast Asian origins also cannot be treated as a single cost group. For the same CN76042100 hollow-profile example, Q3 default-value costs are approximately EUR67.61/t for Indonesia, EUR104.61/t for Thailand, EUR126.47/t for Malaysia and EUR172.53/t for Vietnam. These differences arise from applicable defaults, routes and benchmark deductions. They do not establish individual suppliers' actual emissions or overall delivered competitiveness.
Lower import volumes sharpen the need for product and supplier data
Eurostat data show EU external imports of 7601 at approximately 6.335 million tonnes in 2025, up from 5.823 million tonnes in 2024. Imports of 7604 declined from 391.8kt to 388.1kt, while 7606 rose from 969.6kt to 1,083.3kt and 7607 increased from 265.1kt to 282.6kt.
In January–July 2026, EU external imports of 7601, 7604, 7606 and 7607 were 2,937.0kt, 219.4kt, 606.6kt and 137.3kt respectively, down 14.09%, 6.35%, 7.78% and 22.24% year on year.
These trade figures use Eurostat Comext DS-045409 for EU27 external imports, with SMM calculations. January–July 2026 is the latest complete comparable cumulative period; the source data were updated on 15 September.
Imports declined across all four headings in the latest comparable period. This alone does not establish that CBAM caused the contraction: demand, inventories, product mix and other trade measures may also affect trade. Approximately 101,900 tonnes of 7601 imports in the period have unallocated origins and should not be assigned to particular countries.
Exempt origins also affect the market denominator. In 2025, approximately 2.116 million tonnes of 7601 imports came from exempt origins, alongside 41.8kt of 7604, 328.9kt of 7606 and 21.9kt of 7607. Origins such as Norway, Iceland and Switzerland must be separated from those included in the cost calculation. Applying a single carbon cost to all external imports would overstate the relevant base.
Holding the calculable 2025 trade structure across the four headings constant, applying 2026 default parameters and changing only the certificate price from EUR75.28 to EUR82.32 increases the combined scenario cost by approximately EUR47.73 million. The contribution is approximately EUR26.50 million from 7601, EUR5.75 million from 7604, EUR10.74 million from 7606 and EUR4.75 million from 7607. This is a price-sensitivity comparison, not a 2025 CBAM bill or expenditure already incurred on Q3 2026 imports.
European buyers and aluminium exporters therefore need to track both certificate prices and net requirements per tonne in Q4. Quotes and contract assessments should identify the customs code, origin, import quarter and calculation methodology. Eligible actual-emissions data, precursor information and verification documentation can help establish how a company's circumstances differ from the default scenario. Whether the additional carbon cost can be passed through into sales prices will also depend on contracts and bargaining conditions.
SMM CBAM Aluminum Calculator here: Aluminum CBAM Calculator - Shanghai Metals Market (SMM)