Around September 20, 2026, August import and export data for cobalt and lithium battery industry chain products were released in a concentrated manner. The data showed that China's spodumene imports in August 2026 were 906,600 mt in physical content, up about 22.6% MoM from 739,300 mt in July, equivalent to about 76,000 mt of LCE, up about 18% from 64,200 mt of LCE in July. However, although August spodumene imports in physical content hit a new high, the actual incremental supply of lithium chemicals that could be converted from imported ore was relatively mild due to the high proportion of low-grade raw ore. In terms of lithium carbonate, China imported 30,391 mt of lithium carbonate in August, up 14% MoM and up 39% YoY...... SMM has compiled the import and export data for battery materials, January-August, as follows:
Upstream
Lithium Concentrates
According to China Customs data, China's spodumene imports in August 2026 were 906,600 mt in physical content, up about 22.6% MoM from 739,300 mt in July, equivalent to about 76,000 mt of LCE, up about 18% from 64,200 mt of LCE in July.
By source country, major suppliers showed divergent performance: imports from Australia were 326,400 mt, down about 5.4% MoM, remaining the largest source country with a share of about 36%; imports from South Africa were 222,900 mt, up about 104.5% MoM, making it the second-largest source country; imports from Nigeria were 135,500 mt, up about 29.4% MoM; imports from Zimbabwe were 74,600 mt, up about 245% MoM, with port arrivals largely in line with expectations due to transportation impacts. Imports from Mali were 64,700 mt, up about 68.9% MoM; imports from Brazil were 62,000 mt, down about 46.6% MoM, as the pace of concentrated arrivals of low-grade ore fines from the earlier period slowed down. In addition, imports from Canada were about 16,700 mt, with sporadic arrivals from the UAE, Mozambique, Rwanda, and other places at relatively small volumes.
Overall, although August spodumene imports in physical content hit a new high, the actual incremental supply of lithium chemicals that could be converted from imported ore was relatively mild due to the high proportion of low-grade raw ore.
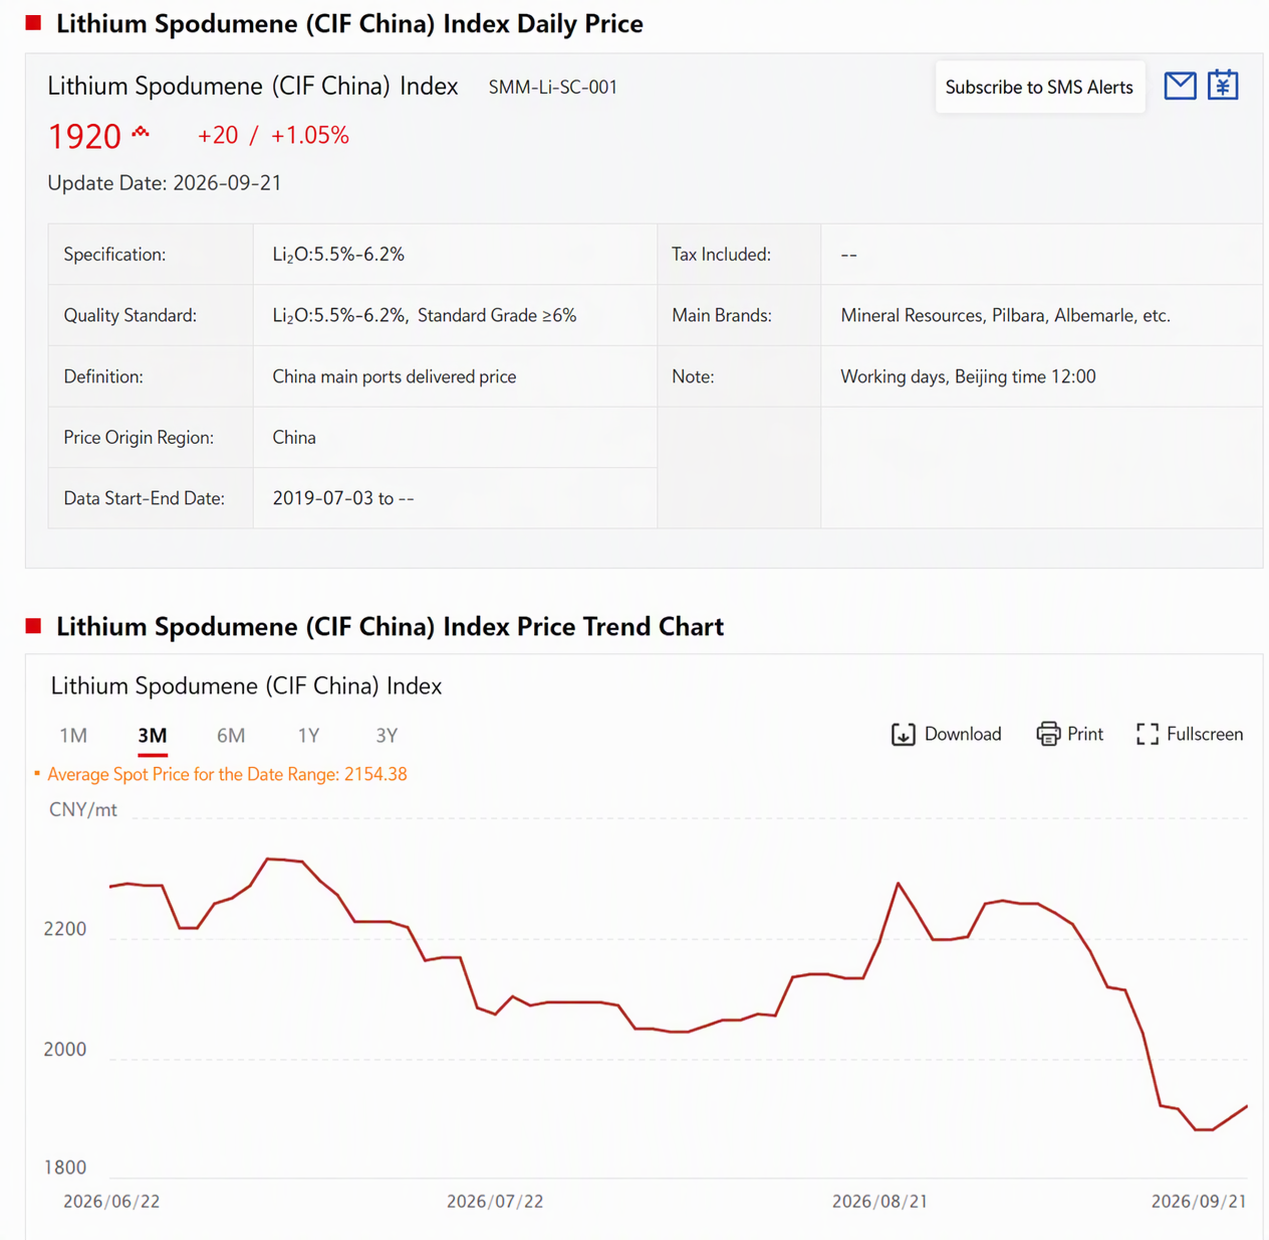
In terms of spodumene concentrate (CIF China) prices, according to SMM spot price data, August spodumene concentrate (CIF China) spot prices showed a trend of rising first and then pulling back, peaking at $2,295/mt during the month before a slight pullback. As of August 31, the average spot price of spodumene concentrate (CIF China) was reported at $2,260/mt, up $210/mt from $2,050/mt at the beginning of the month, an increase of 10.24%. The average spot price in August was $1,417.55/mt, down $59.28/mt from $1,476.83/mt in July, a decline of 4.01%.
According to SMM, in August, the spot theoretical profit for externally purchased spodumene concentrates remained in loss-making territory throughout the month, staying in a cash inversion range. Although there were periods of narrowing, the overall loss remained relatively deep. Ore prices were relatively firm while lithium chemical prices were under pressure, causing the price spread in the processing segment to be continuously squeezed. In August, the spot theoretical profit for externally purchased lepidolite concentrates showed a gradually narrowing trend. At the beginning of the month, there was still relatively ample marginal profit space, but in the middle and late part of the month, affected by weakening lithium chemical prices, profits were significantly compressed. By month-end, the break-even line was essentially reached, and the spot economics for non-integrated enterprises purchasing lepidolite concentrates externally were already at a critical state.
Entering September, spot prices for spodumene concentrates (CIF China) declined all the way, only rebounding somewhat in recent trading days. As of September 21, spot prices for spodumene concentrates (CIF China) stood at $1,920/mt, a notable decline from August.
According to SMM's recent understanding, the lithium ore market overall maintained a fluctuating trend this week, with ore prices still relatively stronger than lithium carbonate. Currently, there is no obvious spot selling pressure on the ore side. Australian mainstream mines have a relatively high proportion of long-term contracts and formula pricing, and the willingness to hold prices firm remains strong. Some traders also lack the motivation to proactively cut prices and sell after the price pullback. Meanwhile, lithium chemical price fluctuations continue to squeeze smelting profits for externally purchased ore, and lithium chemical plants are still mainly purchasing to meet production needs through essential restocking, with limited acceptance of high-priced ore. The profit game between ore and lithium chemicals remains the core of short-term price movements. On the supply side, overseas project production and shipments are generally in a recovery process, and African resource growth is also gradually entering the Chinese market, but project ramp-up, transportation, and shipping schedules still cause fluctuations in actual arrival pace. Domestically, expectations for a recovery in Jiangxi lepidolite supply are strengthening, but new production release still requires time. Overall, short-term lithium ore supply is improving marginally but has not yet become clearly ample. Ore prices are expected to continue consolidating in line with lithium carbonate. Going forward, if lithium chemical prices continue to weaken while ore prices maintain resilience, smelting profits will be further compressed, and lithium chemical plants' resistance to high-priced ore may strengthen, with pressure for ore prices to converge back toward the lithium chemical side gradually rising.
Lithium carbonate
According to customs data , China imported 30,391 mt of lithium carbonate in August, up 14% MoM and up 39% YoY. Among this, imports from Chile were 19,950 mt, accounting for 66% of total imports; imports from Argentina were 8,719 mt, accounting for 29% of total imports; and imports from Indonesia were 1,040 mt, accounting for 3% of total imports. China's cumulative imports of lithium carbonate in January-August were 236,000 mt, up 54% YoY.
China's exports of lithium carbonate in August were 260 mt, up 23% MoM and down 30% YoY. China's cumulative exports of lithium carbonate in January-August were 2,820 mt, down 12% YoY.
China's imports of lithium sulfate in August were 8,785 mt, down 46% MoM and down 9% YoY. China's cumulative imports of lithium sulfate in January-August were 109,600 mt, up 72% YoY. Of this, imports from Chile were 8,344 mt and imports from Zimbabwe were 441 mt.
On lithium carbonate prices, according to SMM spot quotes, battery-grade lithium carbonate spot quotes in August drifted higher, with the monthly high climbing to 160,500 yuan/mt. As of August 31, the average spot price of battery-grade lithium carbonate was 158,500 yuan/mt, up 18,500 yuan/mt from 140,000 yuan/mt at the start of the month, an increase of 13.21%.
Overall, SMM believes that in August, China's spot lithium carbonate prices consolidated with the midpoint edging slightly lower, and the monthly average price fell 2% MoM. From a fundamental perspective, supply-side disruptions continued to build as maintenance at multiple lithium chemical plants ran through the entire month. On the demand side, downstream production schedules stayed high, and as month-end approached, buyers actively stockpiled for September production. The phased supply-demand mismatch remained unresolved. Upstream lithium chemical plants, affected by maintenance, focused on long-term contract supply, with limited capacity for spot order sales, and sentiment to hold prices firm and hold back from selling persisted. Downstream showed divergence: below 150,000 yuan/mt, dip-buying interest was relatively strong, but after prices shot up above 160,000 yuan/mt, willingness to chase higher was insufficient, with purchases mainly just-in-time procurement.
Entering September, spot lithium carbonate quotes fell all the way, with the monthly low briefly dropping to 132,200 yuan/mt. In recent trading days, prices rebounded slightly. As of September 22, battery-grade lithium carbonate spot quotes rose to 130,300-138,600 yuan/mt, with an average price of 134,450 yuan/mt.
Lithium hydroxide
According to China Customs data, China's lithium hydroxide imports in August 2026 were 5,115.17 mt, down 38.5% MoM from 8,322.16 mt in July. Exports were 4,789.36 mt, down 25.4% MoM from 6,419.51 mt in July. Lithium hydroxide remained a net import in the month, with net imports of about 325.81 mt, notably narrower than 1,902.65 mt in July.
On the import side, Indonesia remained the main source in August, with China importing 2,592.19 mt from the country, accounting for 50.7% of total imports, but down 41.7% MoM from 4,444.37 mt in July, as the impact of concentrated arrivals of previously accumulated cargoes visibly faded. Imports from South Korea were 1,058.42 mt, accounting for 20.7%; imports from Australia were 524.43 mt; imports from China's domestic bonded supervision venues were 514.12 mt; and imports from Germany were 420.00 mt, up 42.4% MoM, one of the few sources to post a MoM increase in the month.
On the export side, China's lithium hydroxide exports in August were still mainly destined for South Korea and Japan. Exports to South Korea totaled 3,142.11 mt, accounting for 65.6% of total exports, down 34.3% MoM; exports to Japan totaled 1,087.45 mt, accounting for 22.7%, down 16.6% MoM; exports to Poland totaled 360.04 mt, making it a newly emerging major export destination for the month. Other export destinations included India at 59 mt, Singapore at 40 mt, Turkey at 23 mt, and the Netherlands at 20 mt, all of relatively small volume.
Battery materials
LiPF6
According to China Customs data, in August 2026, China's cumulative LiPF6 exports totaled approximately 1,130.8 mt, down about 14.6% MoM, while cumulative LiPF6 imports totaled approximately 24 mt.
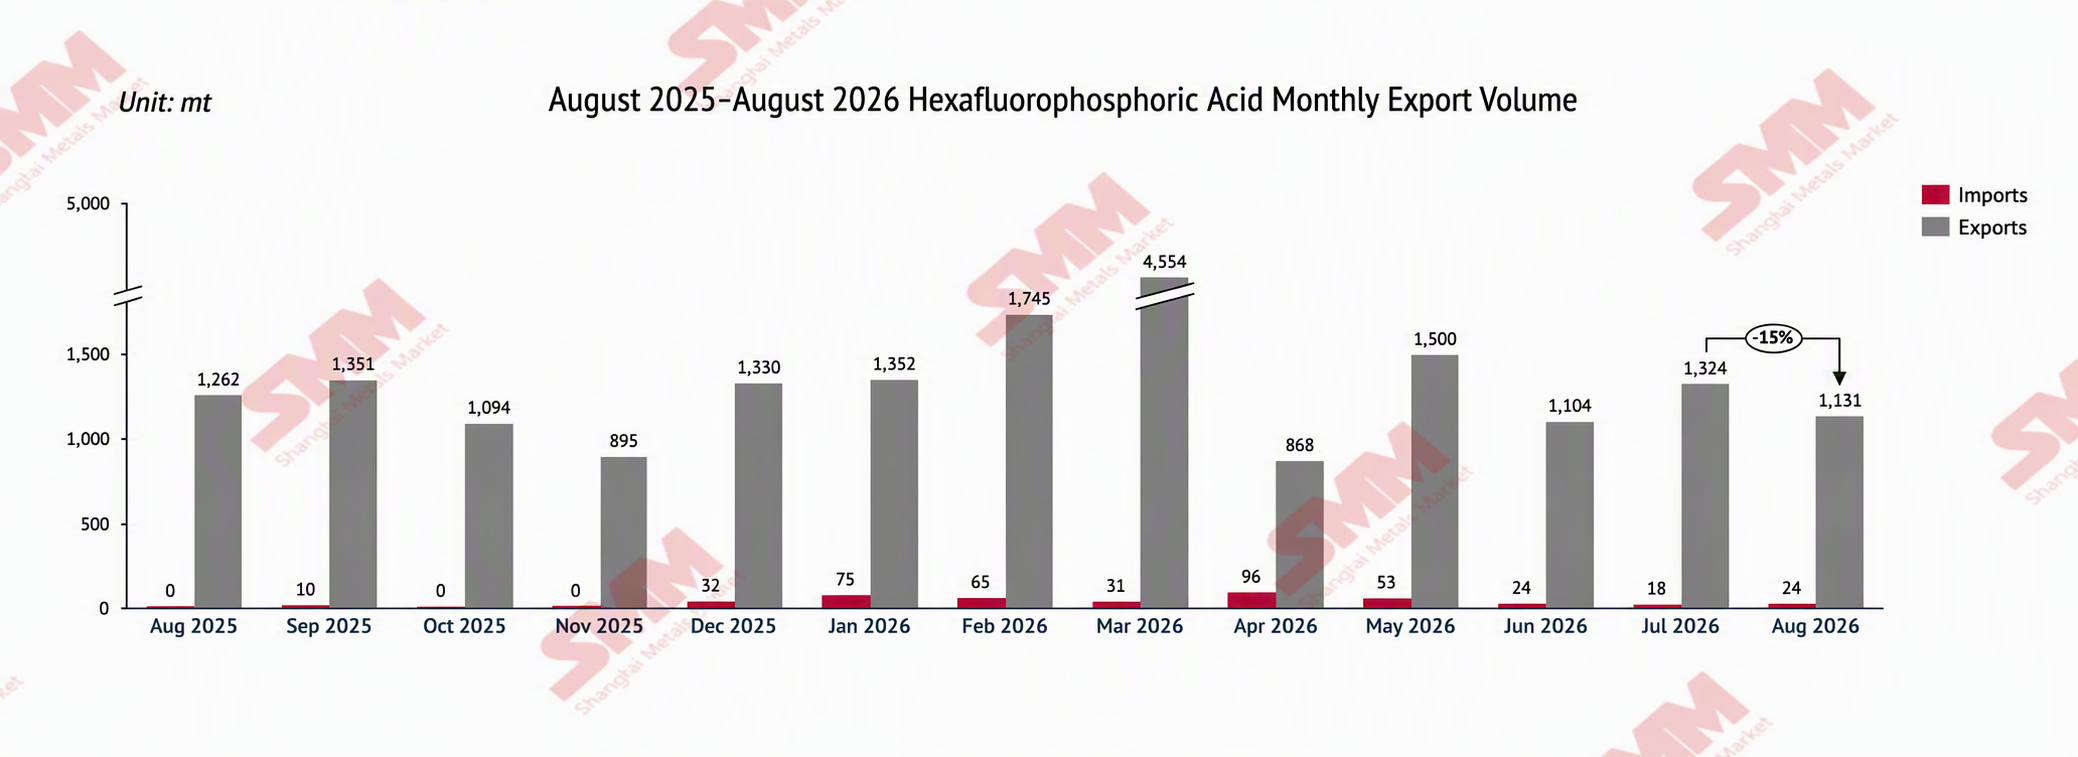
On the export side, China's LiPF6 exports in August 2026 totaled approximately 1,130.8 mt, down about 14.6% MoM from July and down about 10.4% YoY. Specifically, LiPF6 exports this month were mainly destined for South Korea, Poland, the US, and Japan, among others. Exports to the US were 247.526 mt, up about 105.53% MoM; exports to South Korea were 287.626 mt, down about 32.87% MoM; exports to Poland were 185.81 mt, down about 39.56% MoM; exports to Japan were 111.555 mt, down about 40.98% MoM.
Overall, overseas procurement volume of LiPF6 edged down in August.
Flake graphite
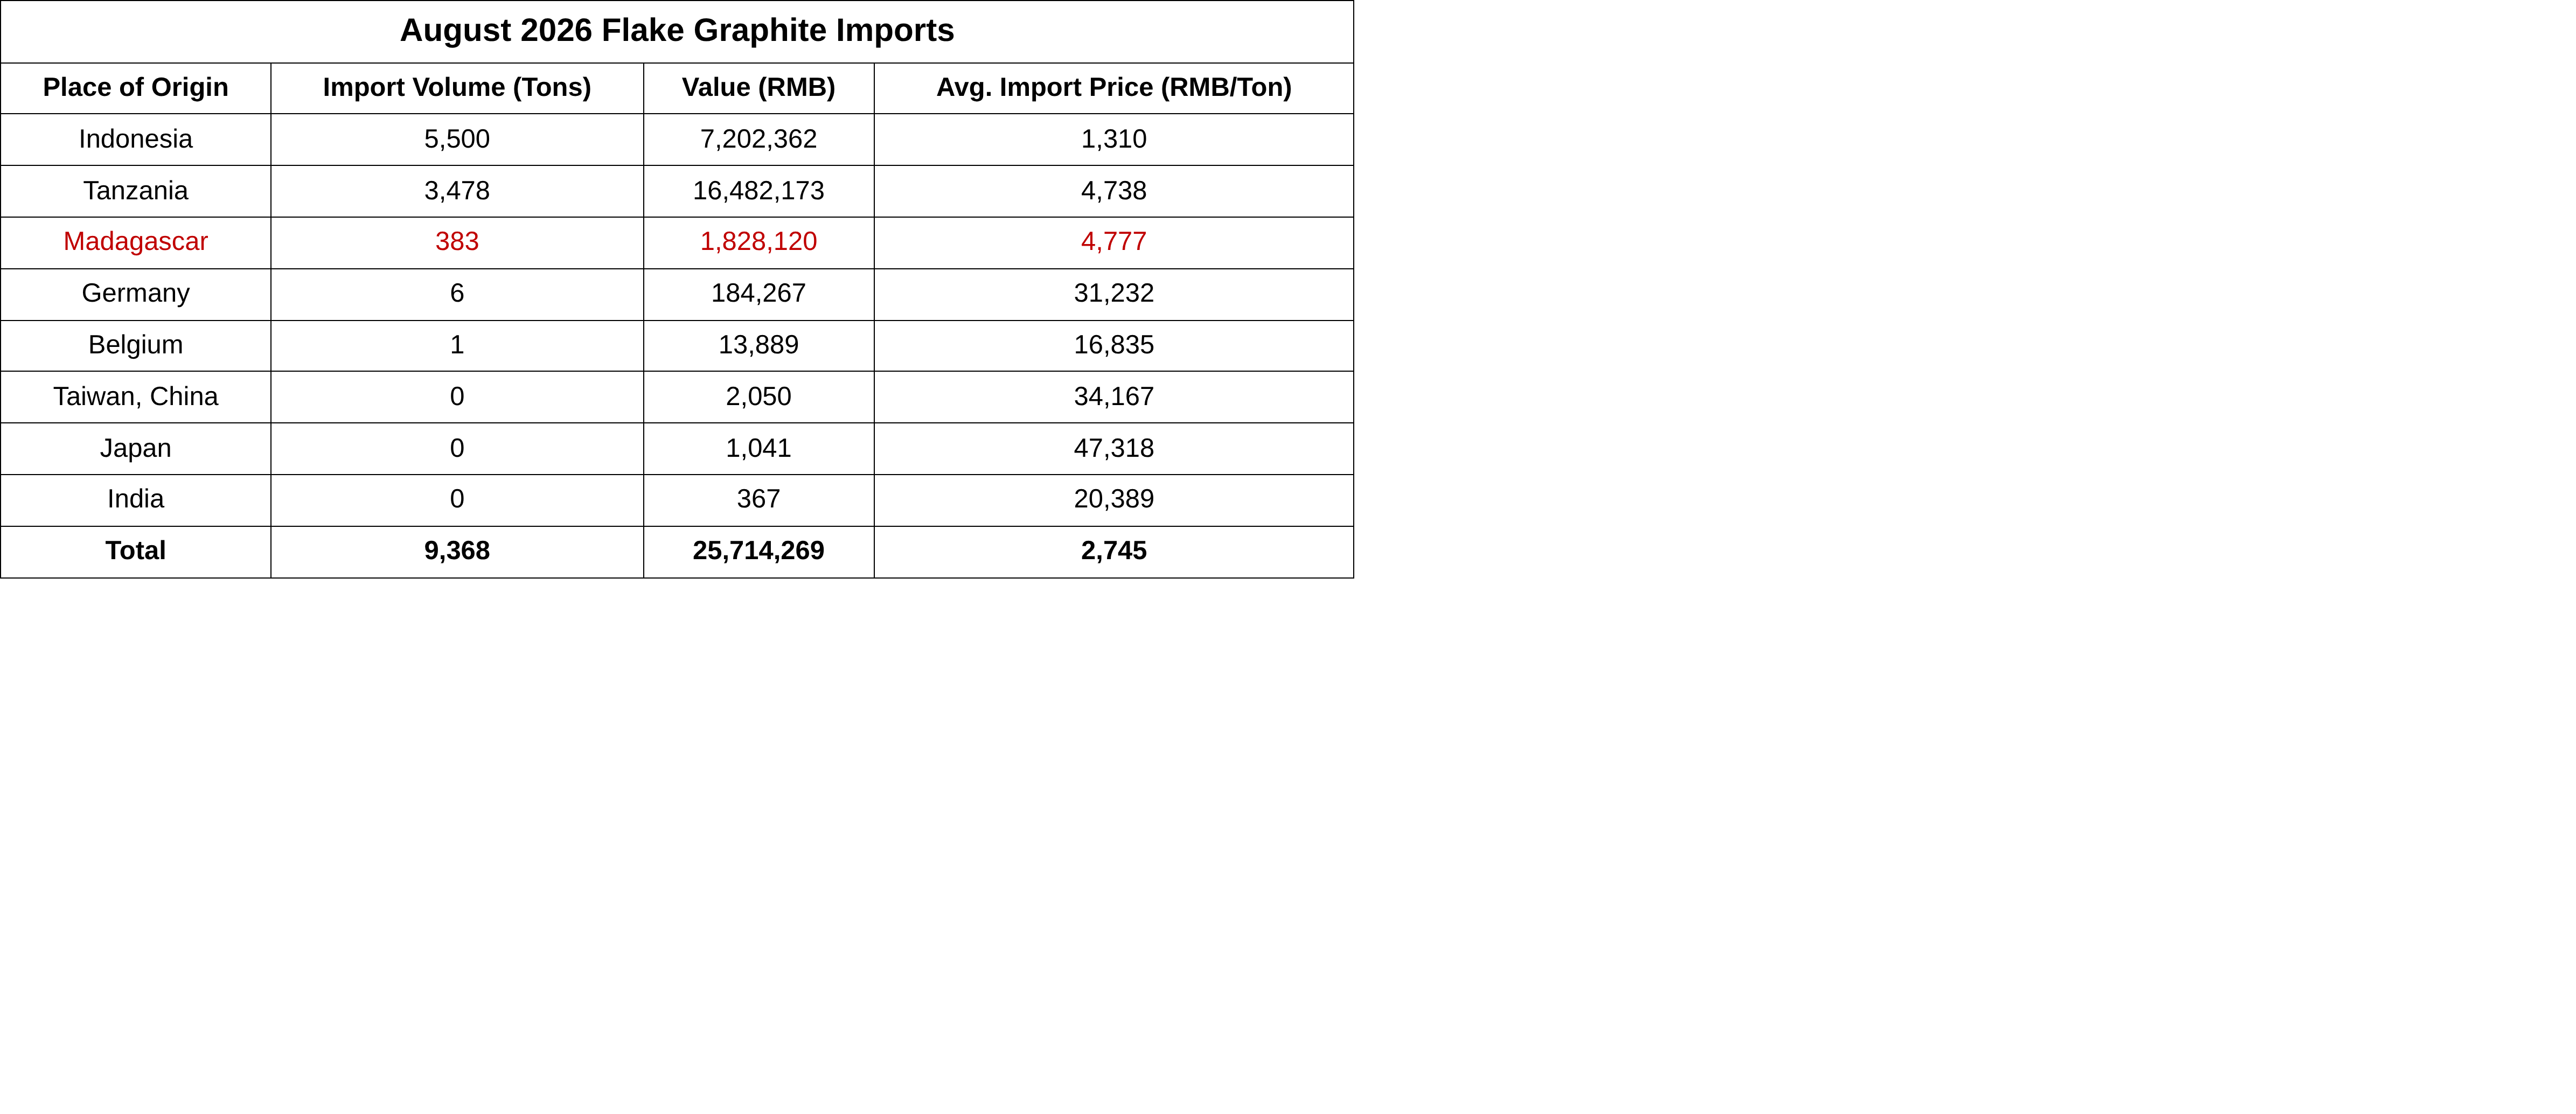
In August 2026, China's flake graphite imports reached 9,368 mt, up 62% MoM and up 425% YoY.
Source: China Customs, SMM
In August 2026, on the export side, monthly exports totaled 6,360 mt, down 14% MoM and down 2% YoY.
From the perspective of export destination structure, market patterns diverged significantly: on the growth side, South Korea increased by 523,000 mt MoM (1.033 million mt → 1.556 million mt, +51%), jumping to become the largest export market; Japan grew 85%; Spain surged 540% but from a low base; Iran grew 87%; Vietnam increased by 37,000 mt. On the drag side, Germany decreased by 966,000 mt MoM (-61%), the US fell 32% MoM, Turkey fell 74% MoM, and Russia decreased by 48,000 mt.
Artificial graphite
In August 2026, China's artificial graphite imports totaled 637 mt, down 18.3% MoM and down 7.2% YoY. In terms of average import price, in August 2026, China's average import price of artificial graphite was 80,201 yuan/mt, up 22.0% MoM and up 27.8% YoY.
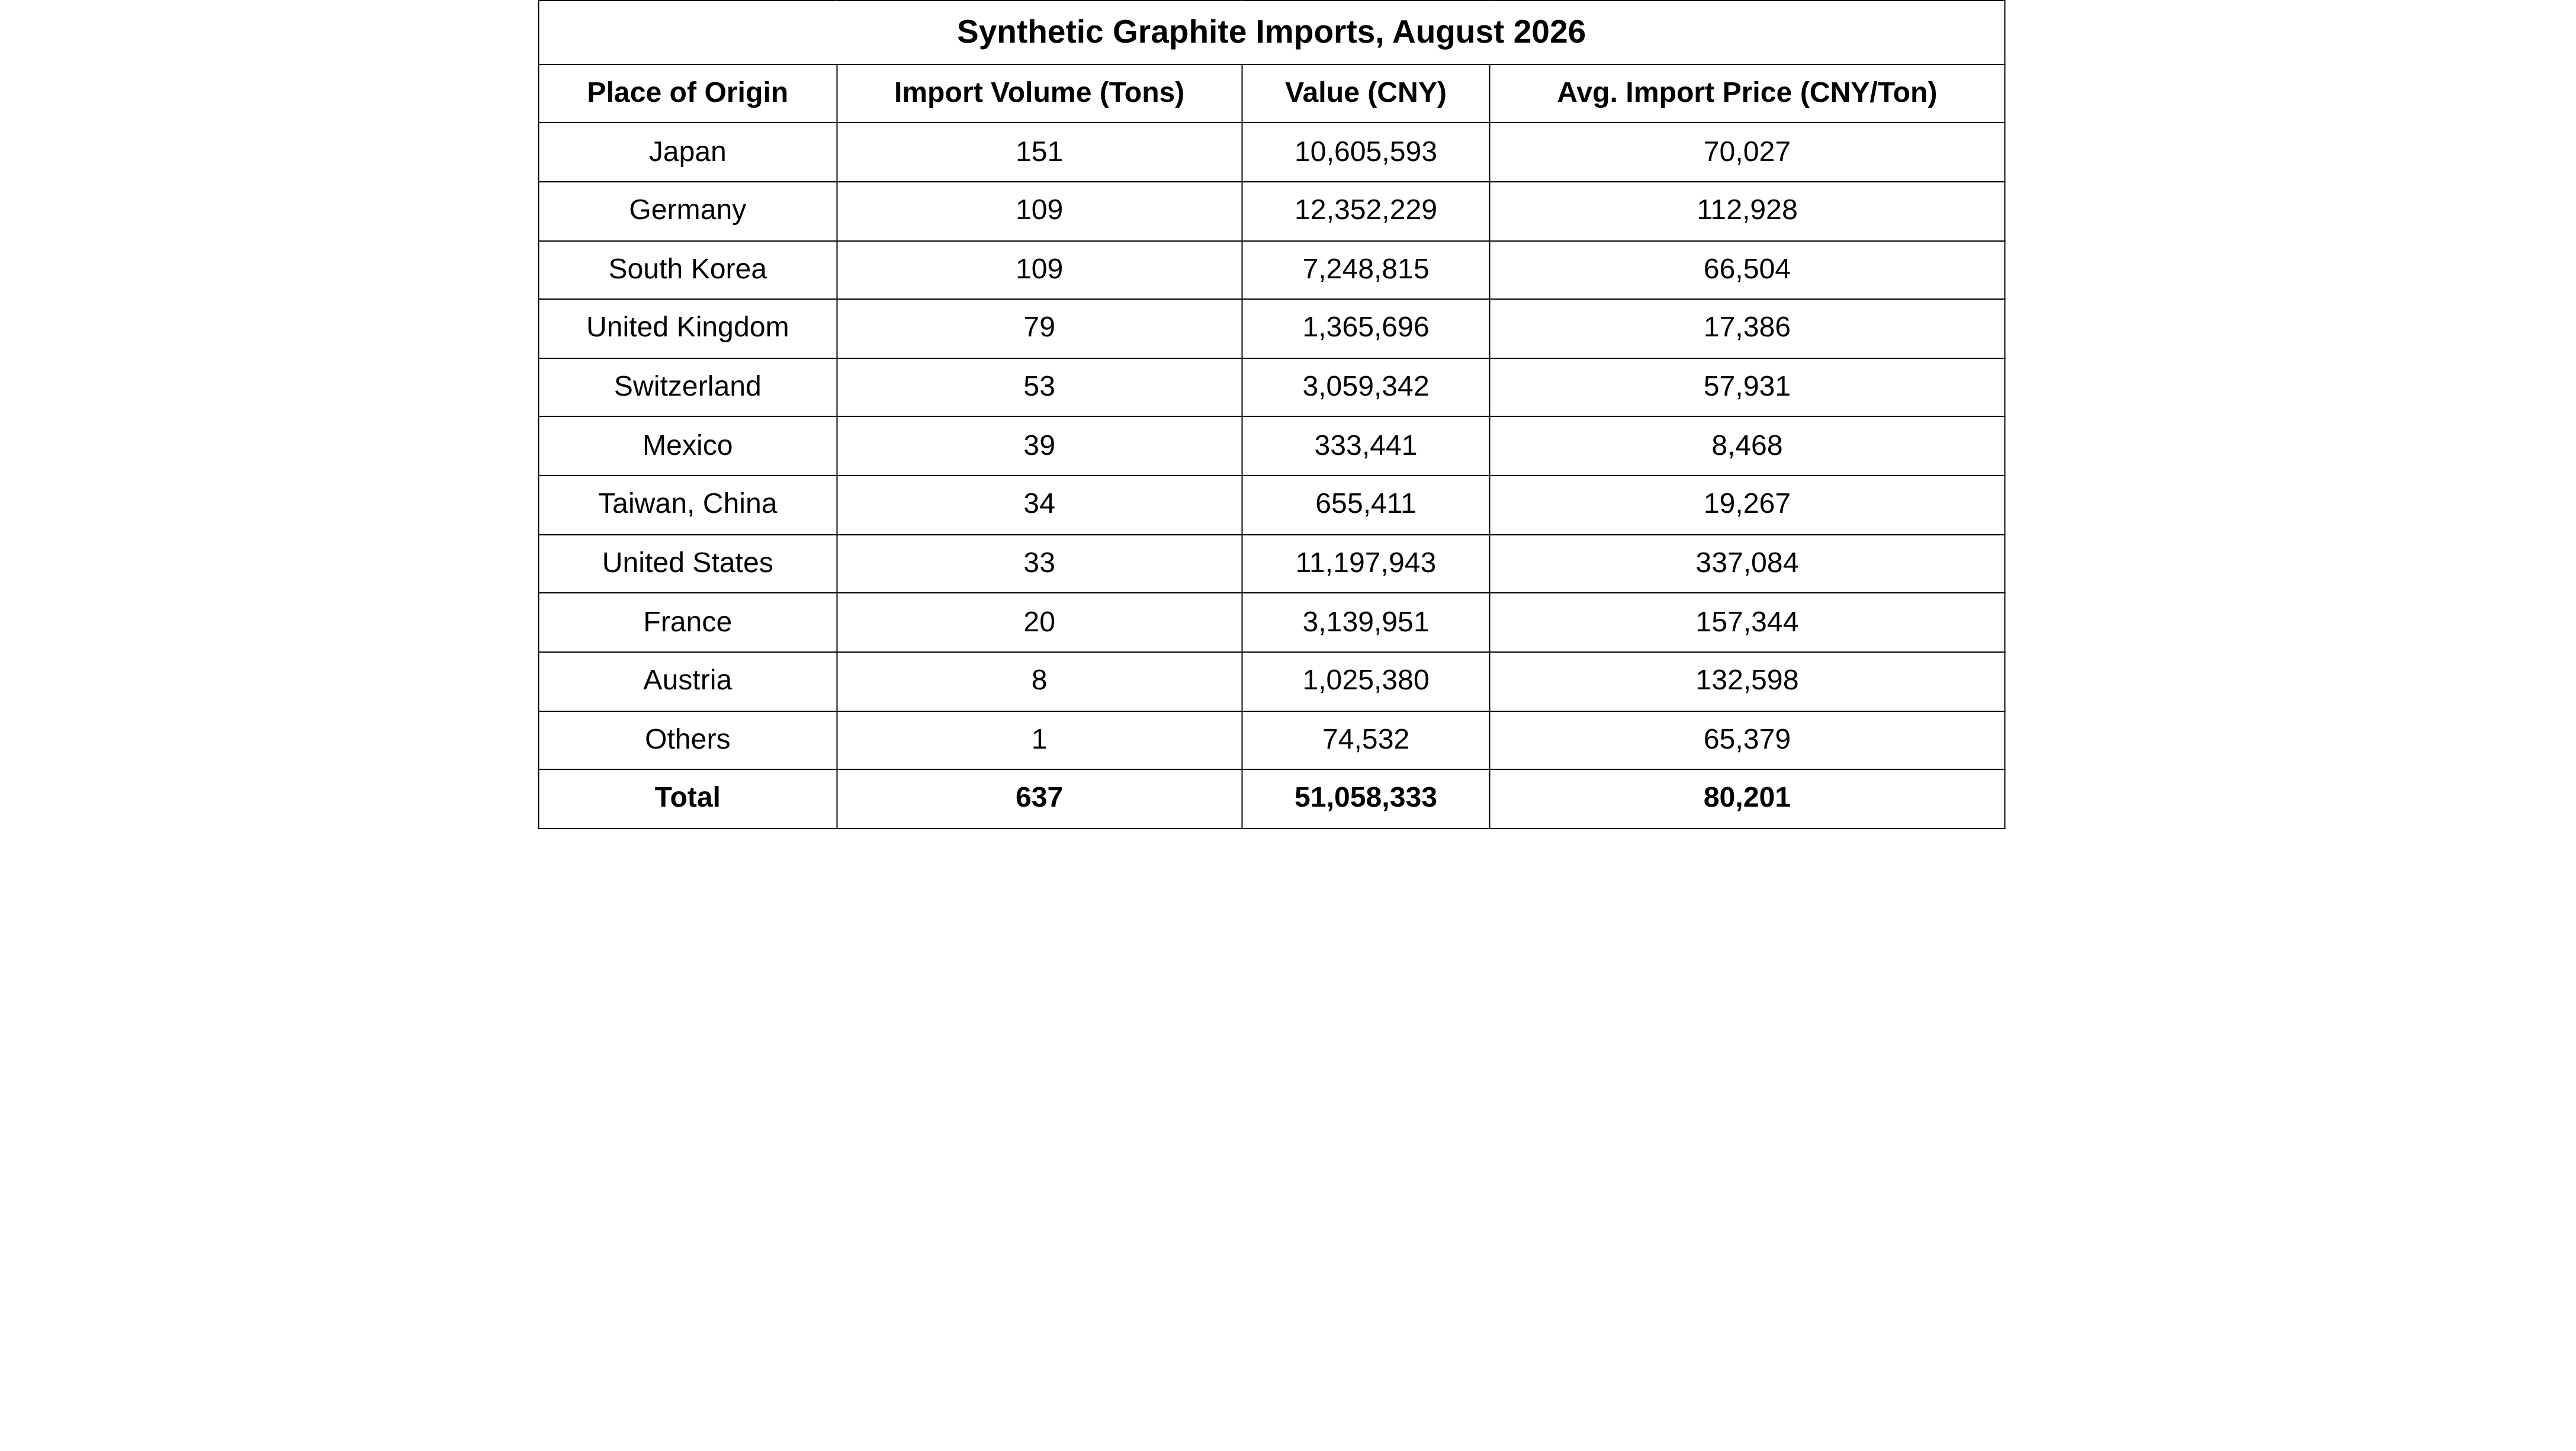
Data source: China Customs, SMM
In August 2026, China's artificial graphite exports were 57,867 mt, up 17.9% MoM and up 3.1% YoY. In terms of average export price, in August 2026, China's average export price of artificial graphite was 8,224 yuan/mt, down 10.9% MoM and down 4.0% YoY.
On the export side, Europe was the largest growth engine, with the Netherlands doubling MoM (4,839 mt→10,060 mt, up 108% MoM), making it the largest single-market contributor to the monthly increase; the UK was up 150% MoM, Spain up 113% MoM, and Belgium up 203% MoM, with gains across the board; Asia showed South Asia leading the gains, with India (7,141 mt→11,117 mt, up 56% MoM), Bangladesh up 409% MoM, and Pakistan up 32% MoM, while Turkey fell 50% MoM to become the largest drag in Asia; East Asia: Japan up 51% MoM, South Korea up 7% MoM, Thailand up 12% MoM, and Indonesia down 36% MoM; Africa saw intensive breakthroughs from zero, including Angola (0→160 mt), Zimbabwe (0→26 mt), Nigeria (0→18 mt), Ethiopia (0→2 mt), and Tanzania (0→48 mt); in North America, the US was the largest declining major market in North America (2,805 mt→589 mt, down 79% MoM); Canada (0.002 mt→260 mt, up 1,157% MoM), and Mexico was basically flat.
Phosphate Ore
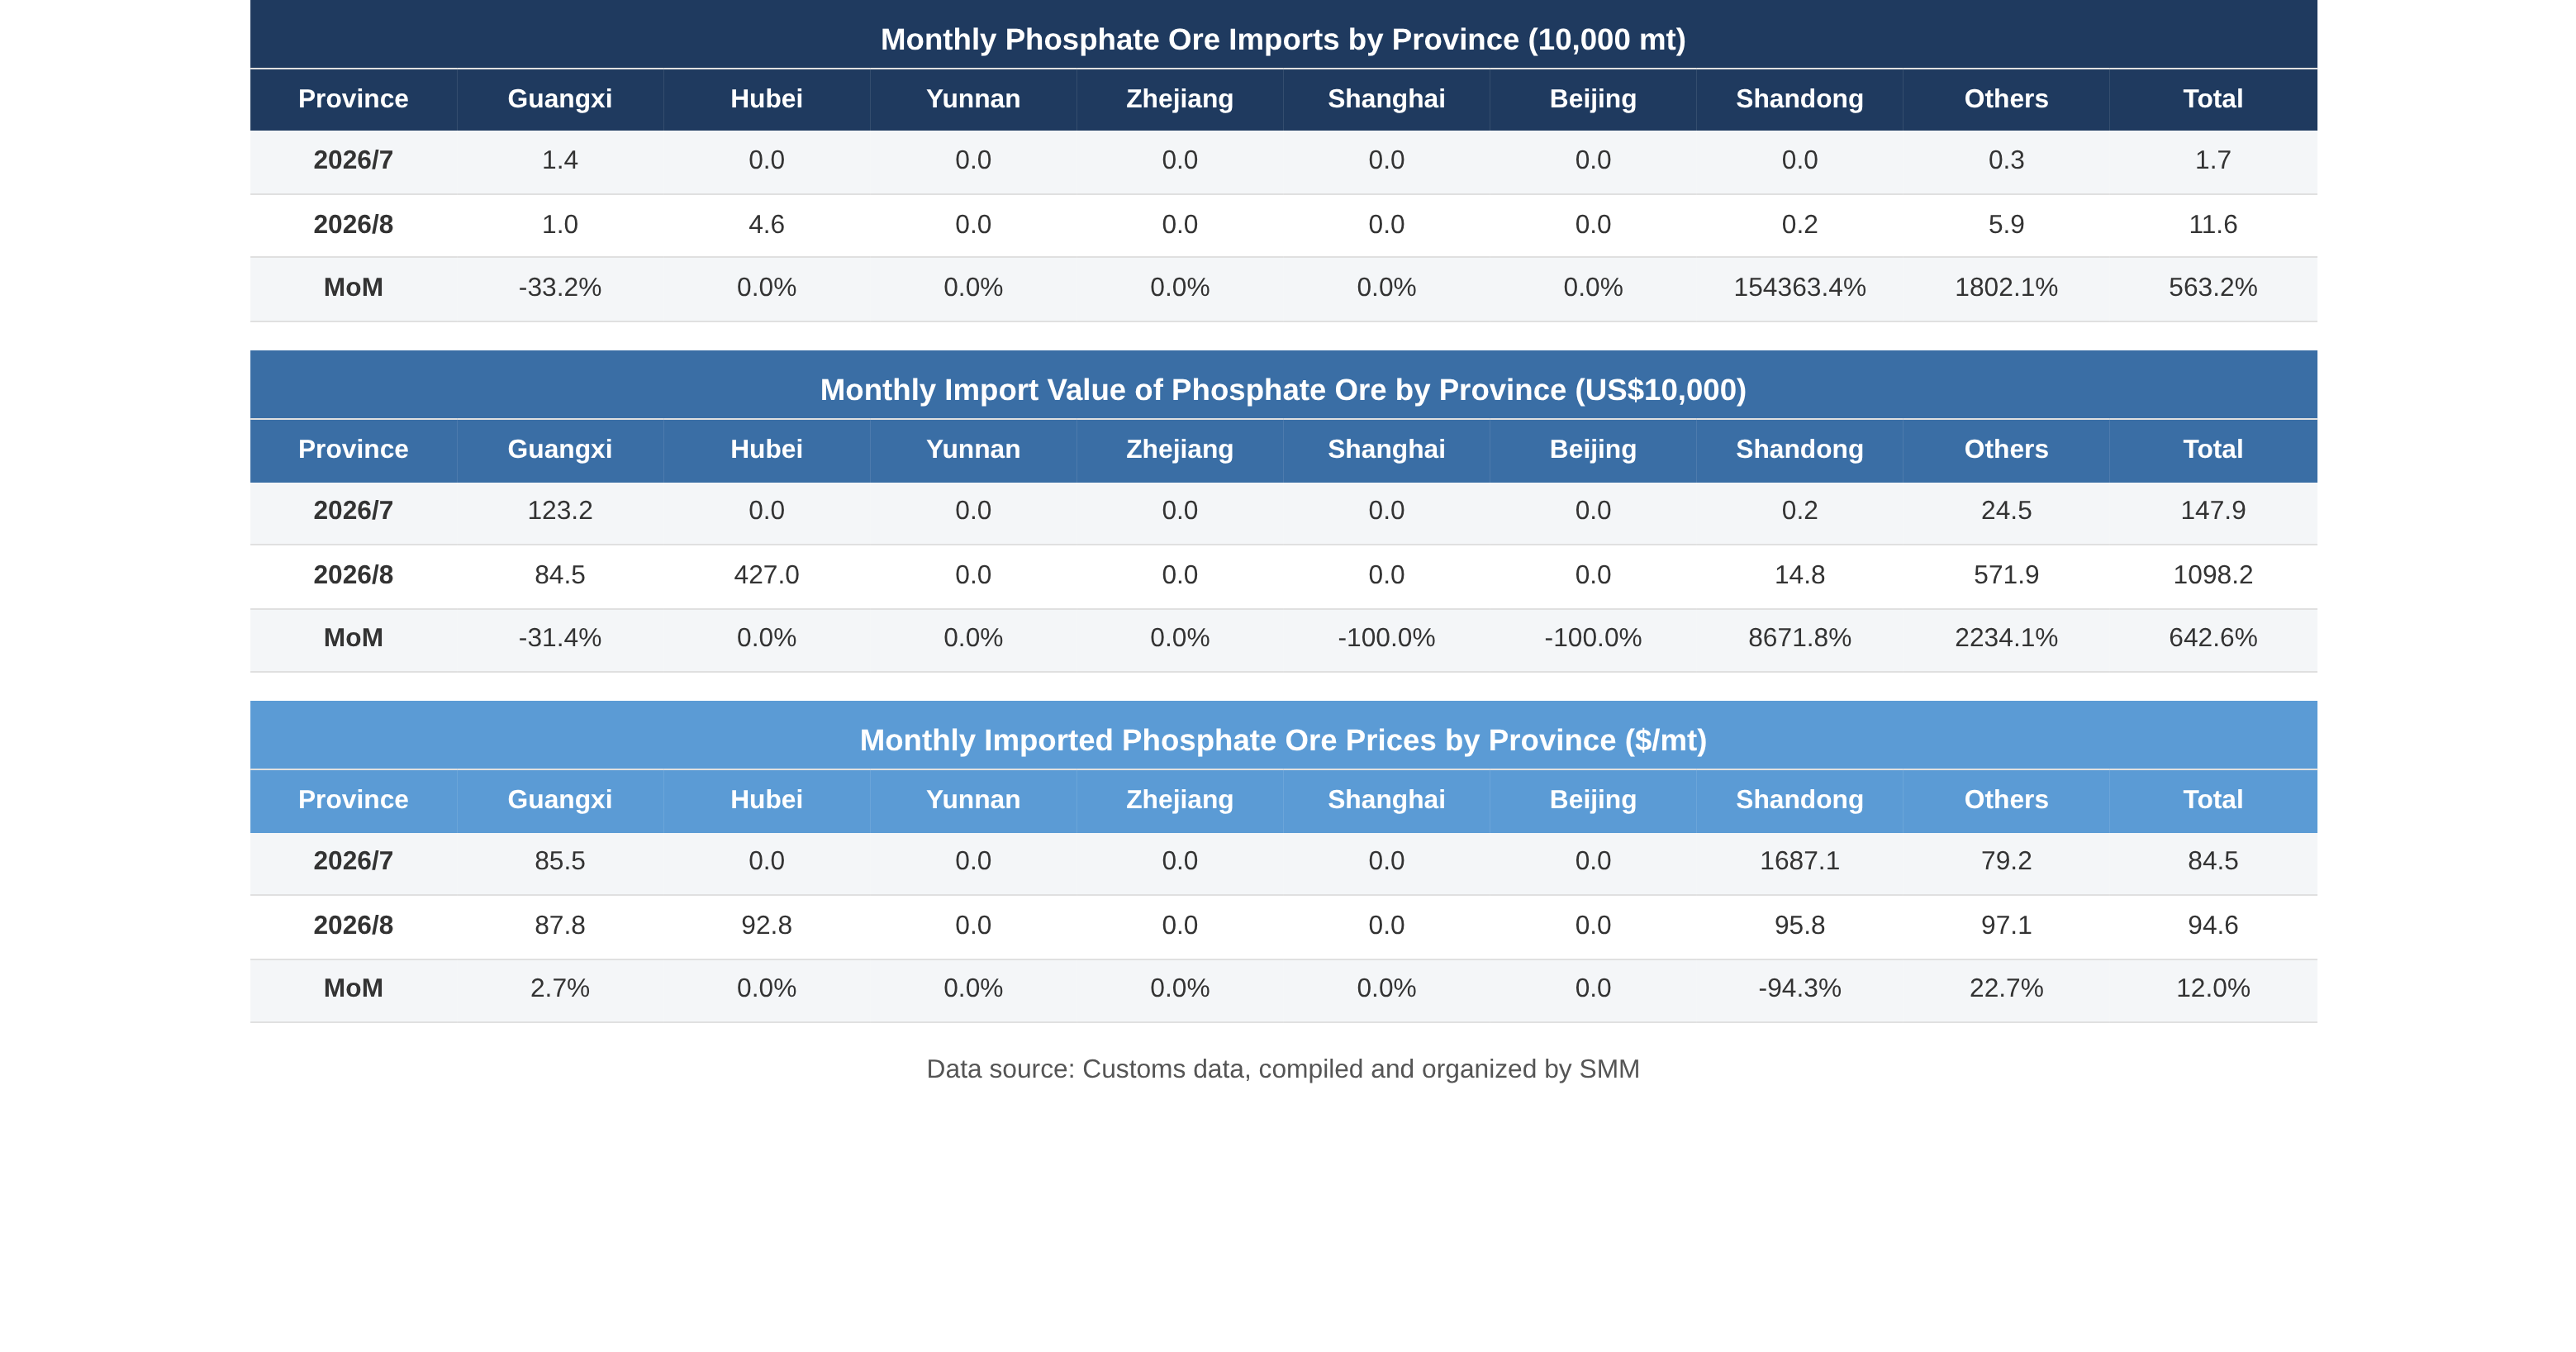
In August 2026, China's phosphate ore imports surged MoM and the price center shifted upward. Monthly imports totaled 116,000 mt, up 563.2% MoM, largely repairing the extremely low base caused by the export ban in July; the average import price rebounded to $94.6/mt, up 12.0% MoM; Egypt and Jordan together accounted for as much as 98.3%, further intensifying source concentration; meanwhile, on the export side, after consecutive zero transactions, August suddenly saw a surge to 61,000 mt, marking market preheating before the end of the phosphate fertiliser export ban window.
......
In August, phosphate ore imports were 116,000 mt, up 563.2% MoM; exports jumped from zero to 61,000 mt, and the average price rebounded to $94.6/mt. The data were impressive, but mainly due to the repair of the extremely low base under the July export ban, as well as advance stockpiling before the resumption of phosphate fertiliser exports in September. Autumn fertilizer stockpiling is gradually getting underway, with just-in-time procurement providing support, but import sources remain highly concentrated in Egypt and Jordan, and absolute volumes are still at low levels. Whether the peak season has truly arrived will depend on whether September export orders and downstream operating rates can continue to rebound. A short-term rebound is expected, but a trend-driven peak season still needs confirmation.
Sulphur & Sulphuric Acid
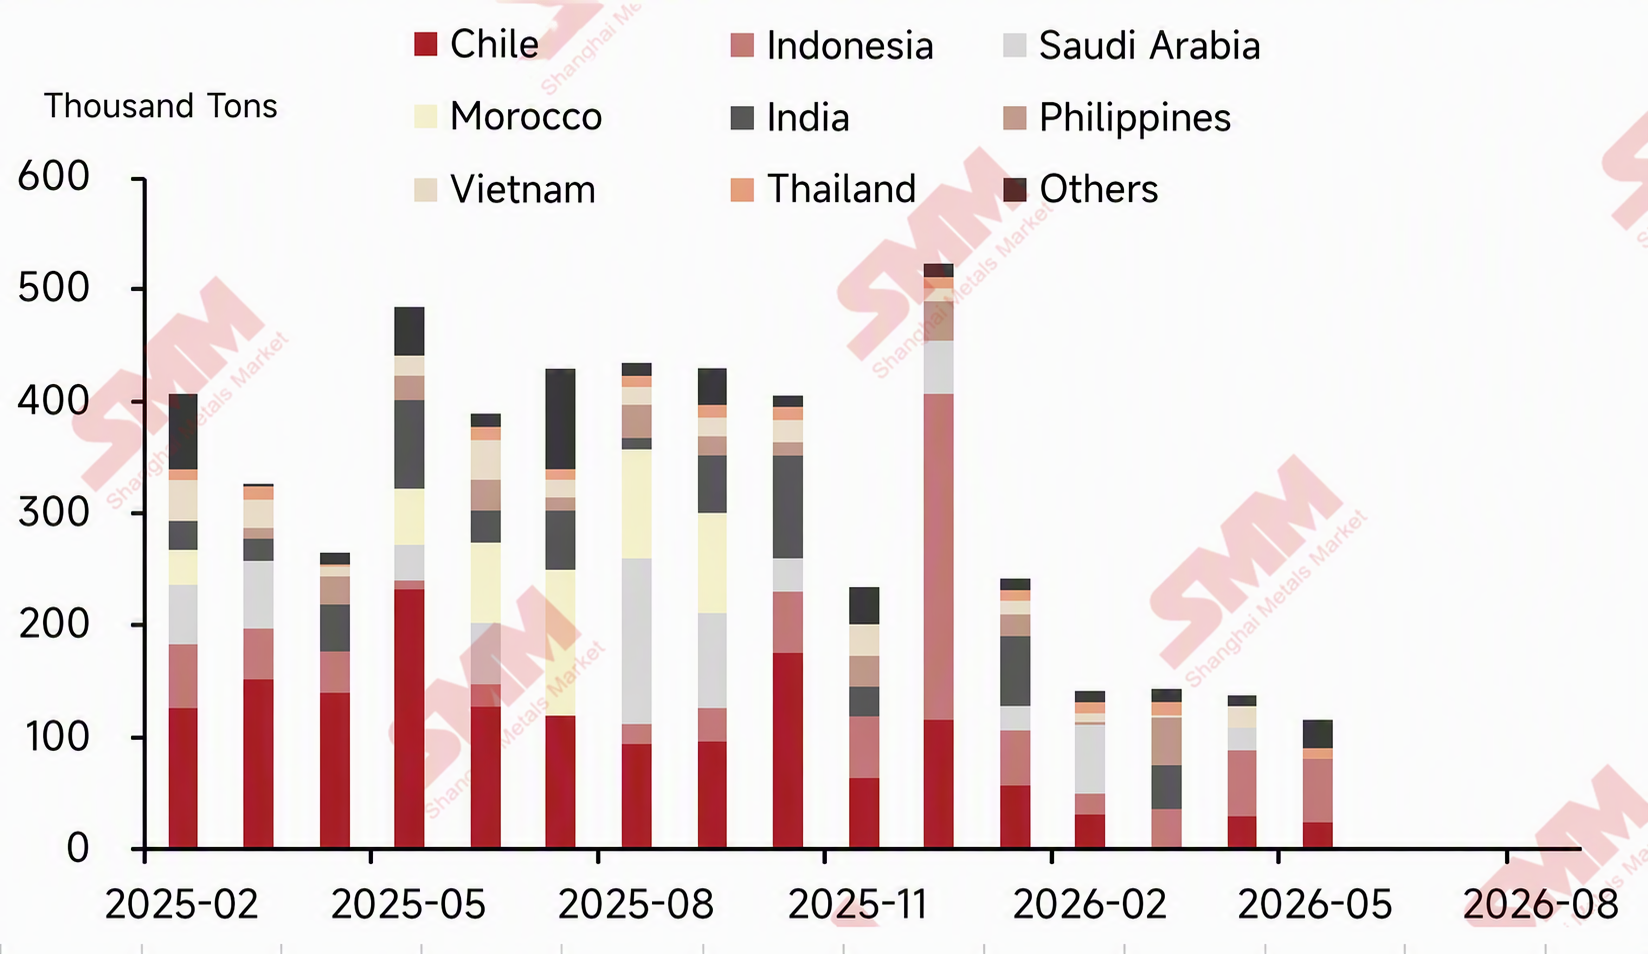
In August 2026, China's monthly sulphur imports totaled 272,323.414 mt in physical content, down 29.34% MoM and down 65.03% YoY, with major import sources including the UAE, South Korea, Canada, Japan, Kazakhstan, Vietnam, Singapore, and the Philippines;
China's monthly sulphur exports totaled 48 mt in physical content, down 96.34% MoM and up 26.32% YoY, with major export destinations being Indonesia and South Korea;
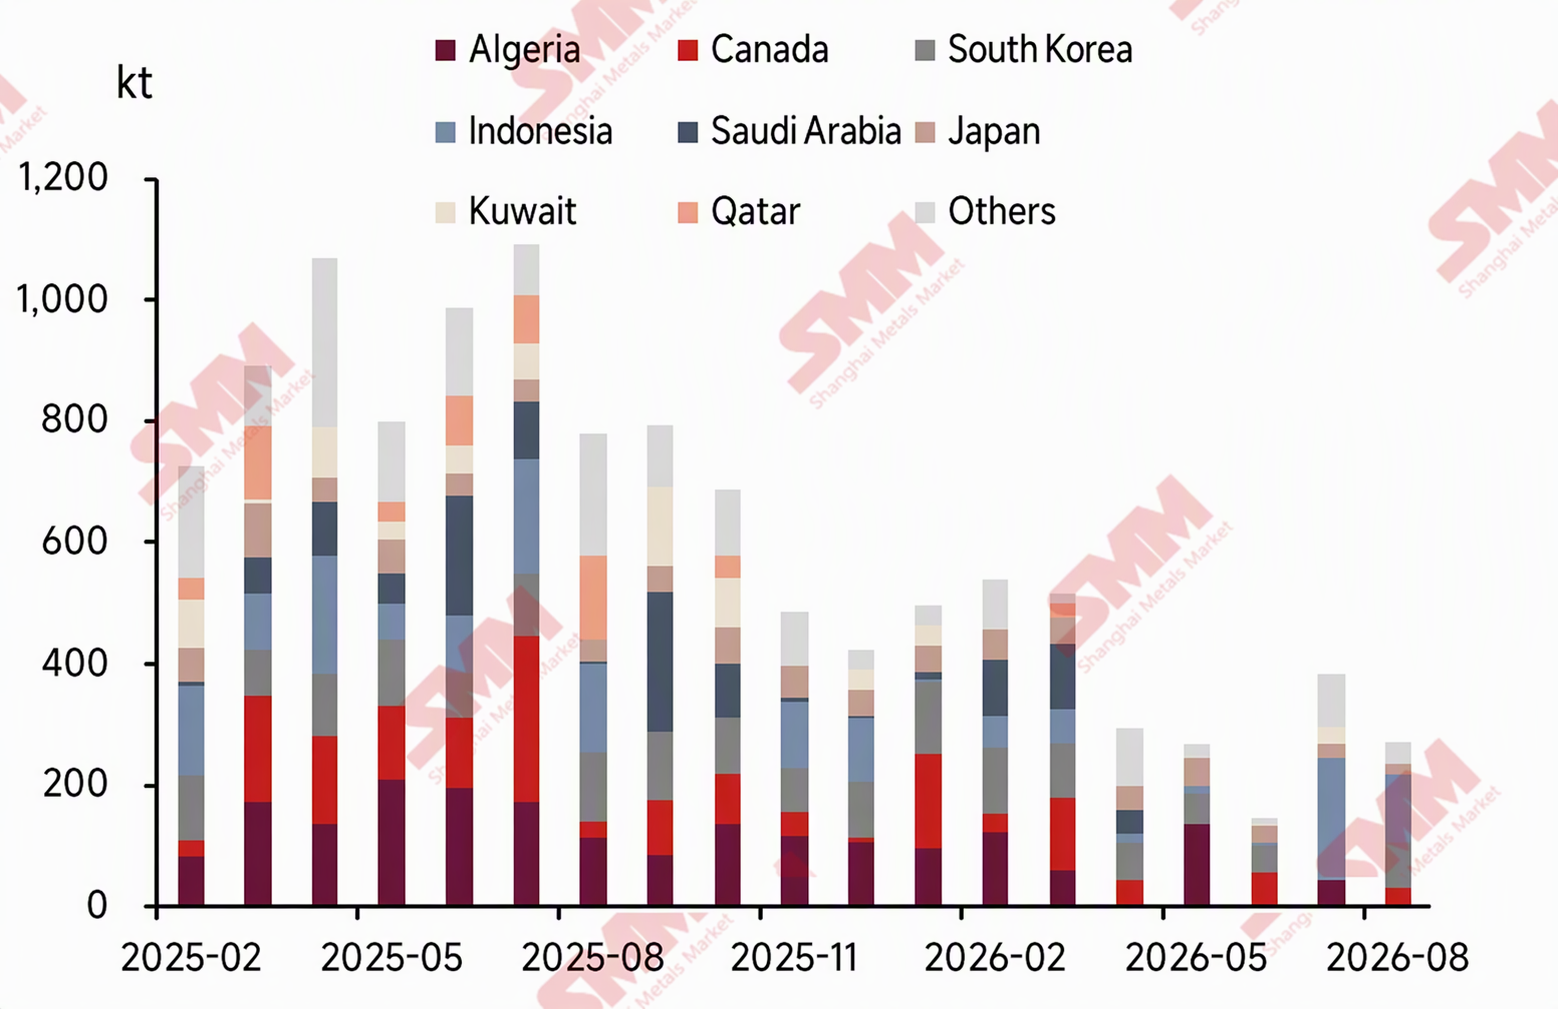
China's monthly sulphuric acid imports totaled 9,938.436 mt in physical content, up 831.85% MoM and up 1,051.37% YoY, with major import sources including South Korea, Taiwan, China, Germany, and the US;
China's monthly sulphuric acid exports totaled 2,474.46 mt in physical content, up 153.47% MoM and down 99.43% YoY, with major export destinations including Angola, Ghana, Cambodia, Hong Kong, China, Vietnam, Singapore, Malaysia, and Tanzania.
China sulphuric acid export data
China sulphur import data
Cobalt
Cobalt Hydrometallurgy Intermediate Products
Imports: Typhoon disruptions to port arrivals; bonded cargo volumes shrink notably
This month, approximately 3,682 mt in physical content of intermediate products imported by China from the DRC entered Zhejiang and Guangdong provinces via Entrepot Trade by Customs Special Control Area, accounting for 46.8% of China's total imports; Ordinary Trade accounted for approximately 3,913 mt in physical content, or 49.7%; and processing trade with imported materials accounted for approximately 179 mt in physical content, or 2.3%. In addition, China imported a total of 101 mt in physical content of intermediate products from South Africa, Vietnam, and Zambia via Ordinary Trade this month. In terms of structural changes, the decline in imports this month was mainly reflected in shrinking bonded logistics cargo volumes: bonded imports in August fell by approximately 63% from 10,046 mt in physical content in July, with the share pulling back from 62.9% to 46.8%; meanwhile, Ordinary Trade imports were basically flat MoM, holding at around 3,900 mt in physical content, indicating that just-in-time procurement by smelters remains intact, but willingness to stockpile bonded cargoes has clearly cooled.
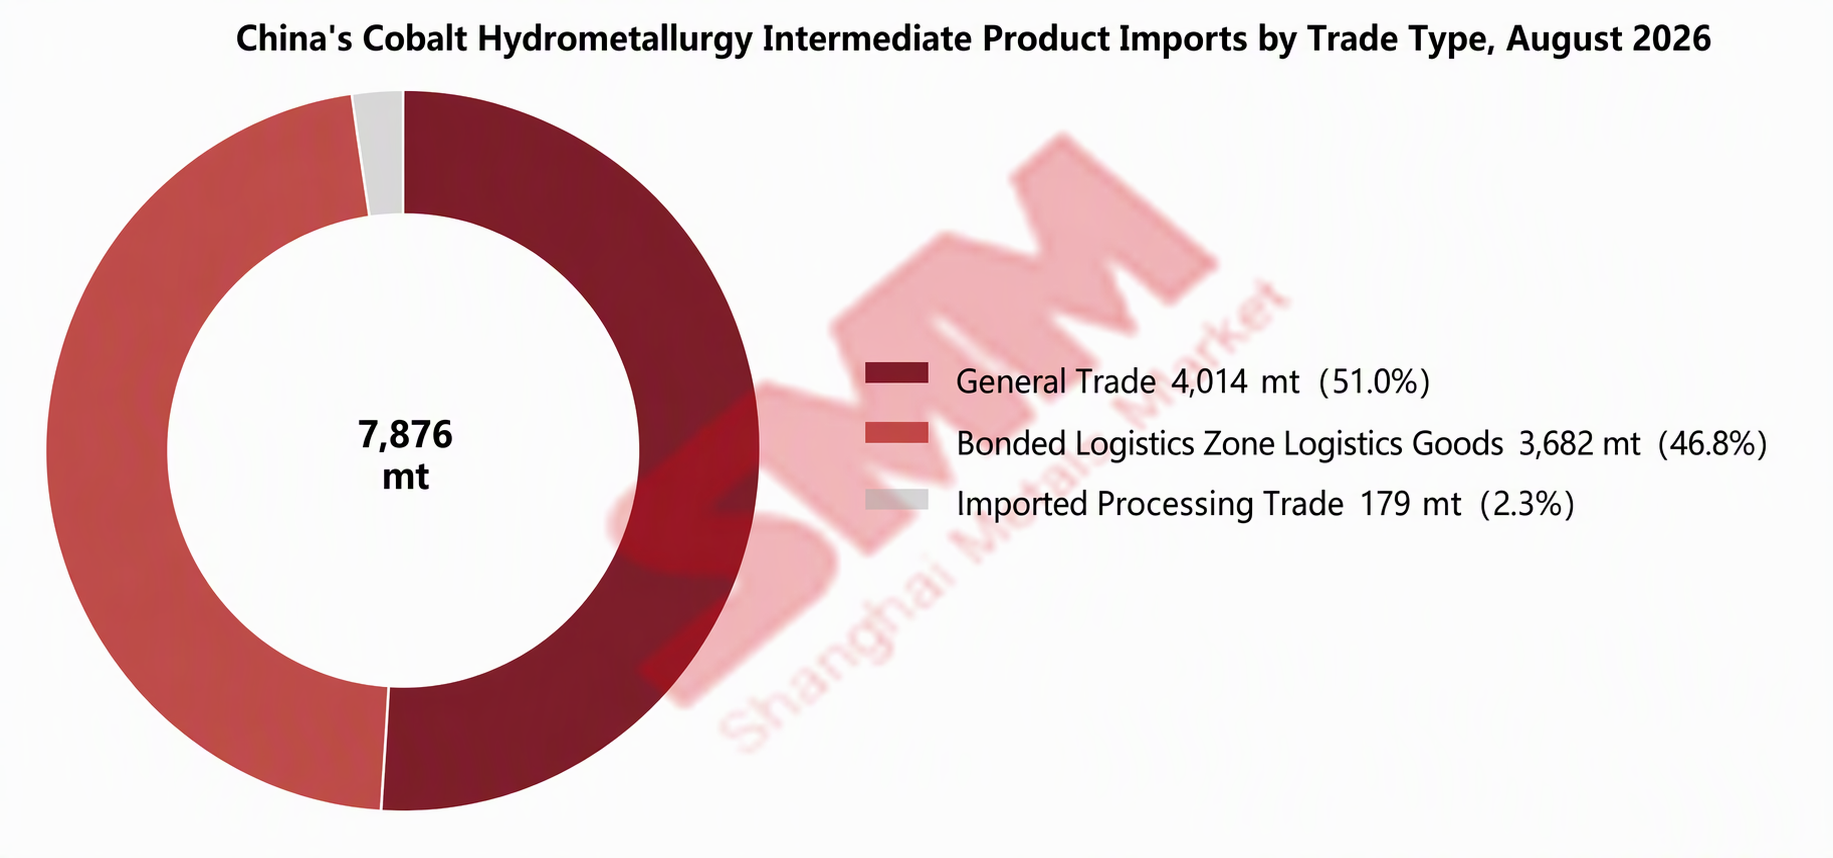
The decline in imports this month was mainly attributable to two factors. First, typhoons disrupted port arrival schedules. In August, Typhoon "Baiji" made landfall twice in Zhejiang, and "Saudel" successively affected the east China coast, with multiple ports closed for more than a week, disrupting vessel loading and unloading schedules and delaying some cargoes originally scheduled to arrive in August until September. Second, cobalt salt prices fell steadily in August, reducing smelters' willingness to purchase raw materials. New tenders by miners were difficult to conclude, and some miners opted to store cargo in other regions outside China, waiting for demand to recover before shipping. In addition, the 50% YoY increase in imports this month was mainly due to a low base last year—August 2025 imports were only 5,241 mt in physical content due to DRC export policy impacts, and current import volumes have yet to return to normal-year levels.
.....
Market outlook: Growth and limiting factors in play; September actual arrivals remain highly uncertain
Looking ahead, September intermediate product imports are expected to see some growth, but actual arrivals will still depend on the supply-demand tug-of-war. On the growth side, first, actual shipments from the DRC were high. According to DRC CTCPM data, DRC cobalt exports in H1 2026 reached 41,100 mt in metal content, with June alone exporting about 11,800 mt in metal content, up 92.9% MoM and accounting for 48.9% of Q2 exports. Shipping from Durban to China typically takes about two months, so the concentrated June shipments will gradually show up in arrivals from September onward. Second, shipments delayed by typhoons in August will be concentrated in September. On the limiting side, cobalt salt prices have yet to stop falling, smelters' willingness to purchase raw materials remains low, and miner tenders continue to struggle to conclude. If the price standoff between buyers and sellers persists, some miners may still choose to store cargo outside China and delay shipments. Overall, China's cobalt intermediate product imports may rebound in September, but the extent of the rebound remains uncertain.
Unwrought cobalt
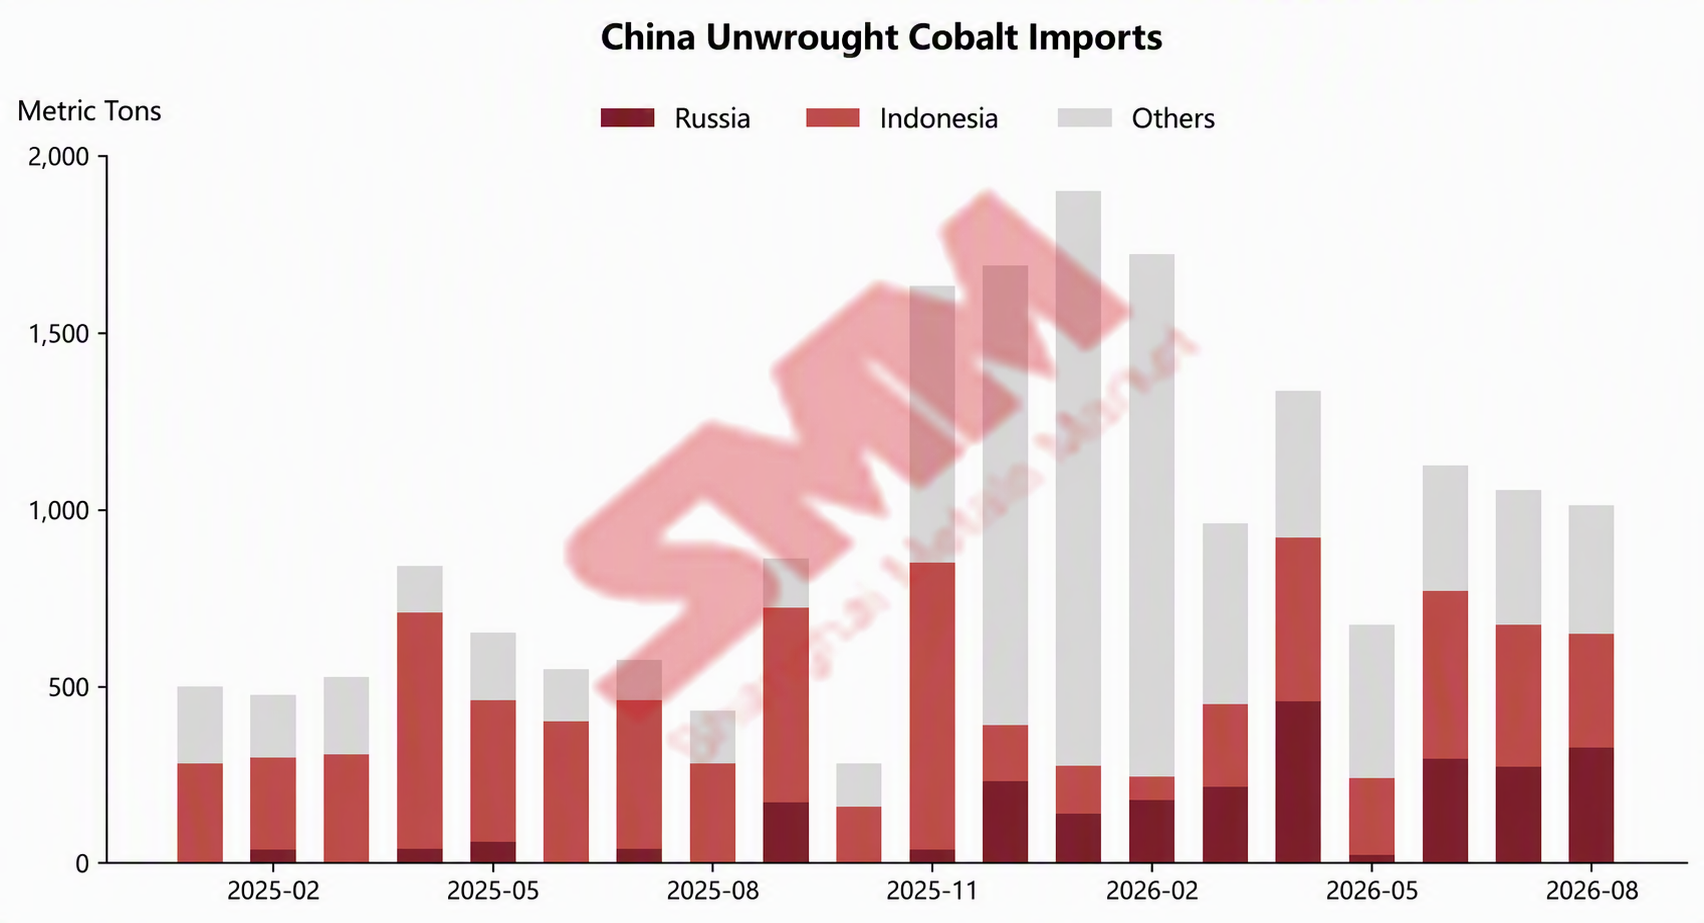
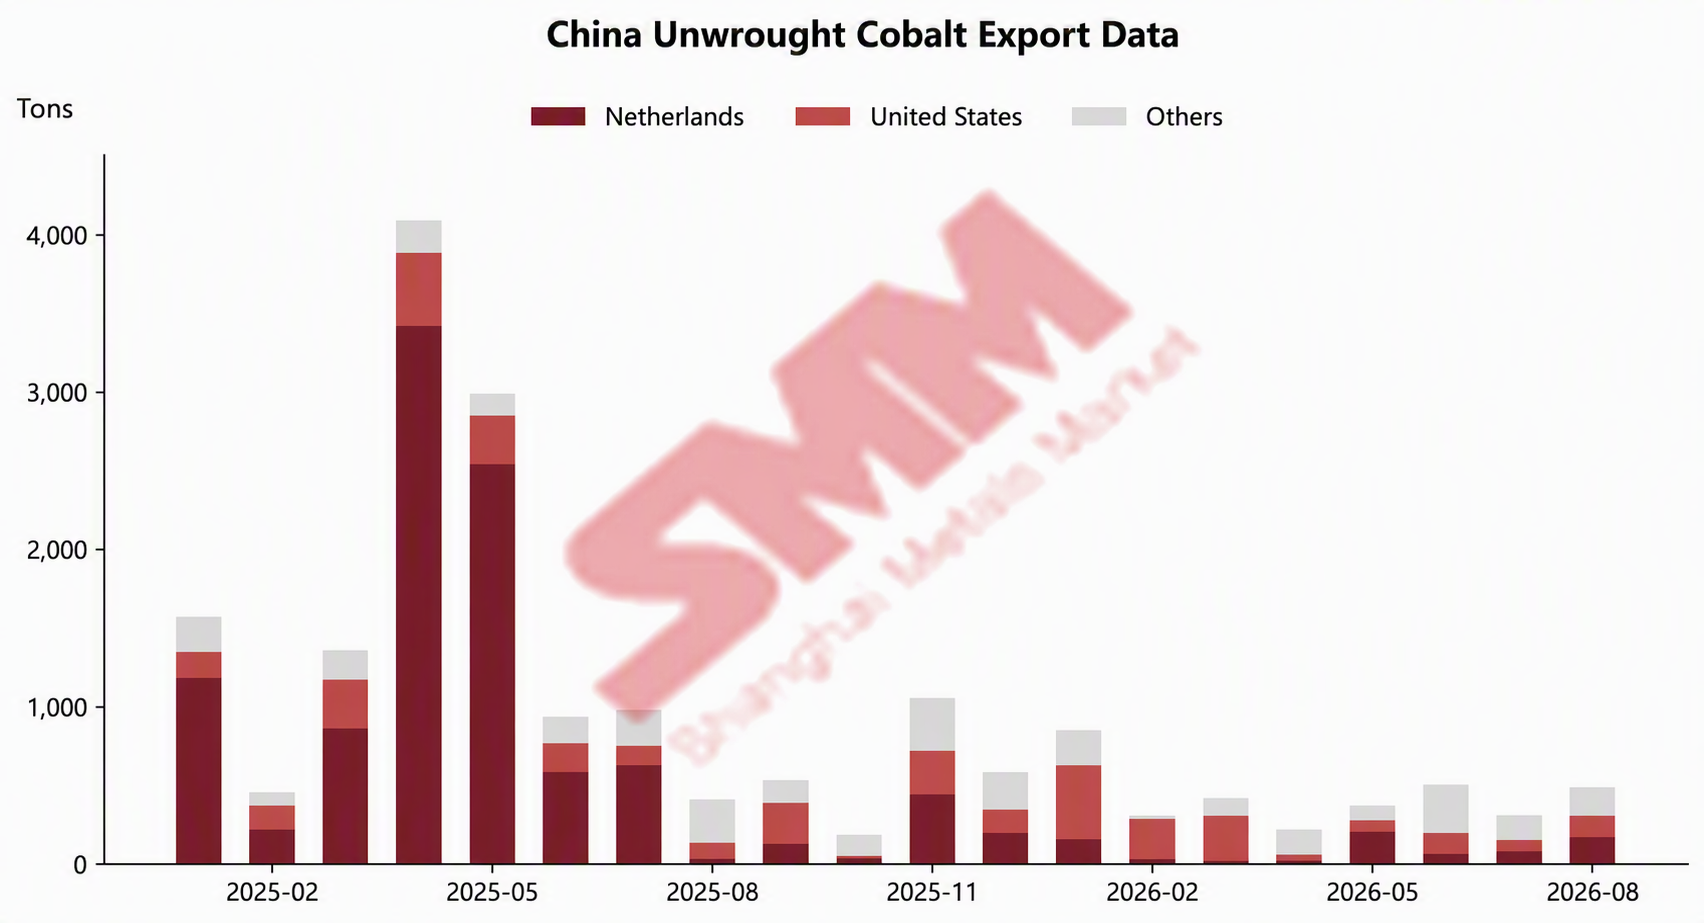
China's unwrought cobalt imports in August 2026 were about 1,011 mt, down 4% MoM and up 134% YoY; China's unwrought cobalt exports in August 2026 were about 486 mt, up 55% MoM and up 18% YoY.
Import window deeply closed; thousand-ton-level imports sustained by long-term contracts
China's unwrought cobalt imports in August 2026 were about 1,011 mt, down 4% MoM and up 134% YoY. By country, the top three sources of refined cobalt imports in August were Russia, Indonesia, and Madagascar, with import volumes of 325 mt, 321 mt, and 51 mt, respectively. Imports from Russia rose 20% MoM, and all Indonesian cargo entered through Zhejiang ports under bonded logistics.
By trade mode, imports under Entrepot Trade by Customs Special Control Area in August were about 591 mt, accounting for 58.4%, a notable pullback from 75.4% in July. Ordinary Trade imports were about 420 mt, with the share rising to 41.6%. The pace of bonded "reservoir" inflows slowed, and the share of cargo cleared into domestic circulation increased.
In August, China’s refined cobalt prices continued to pull back sharply. The low-end SMM refined cobalt price fell from 338,000 yuan/mt at the beginning of the month to 300,000 yuan/mt at month-end, a decline of about 11% during the month. Over the same period, the low-end refined cobalt price in the Rotterdam warehouse outside China fell from $25.35/lb to $24.6/lb, a relatively limited decline. The price spread between Chinese and overseas markets continued to widen, with the theoretical import loss for refined cobalt expanding from about 98,000 yuan/mt at the beginning of the month to about 130,000 yuan/mt mid-month, leaving the import window deeply closed. However, as some brands of refined cobalt still needed to be shipped to China due to long-term contracts or operational requirements, imports remained above 1 kt for the second consecutive month. Imports doubled YoY, mainly because August 2025 was affected by the DRC export ban, leaving a low base of only 431 mt that month.
In terms of average import prices, China’s average import price of unwrought cobalt in August 2026 was $51,752/mt, down 12.72% MoM. Cumulative imports in January-August 2026 reached 9,775 mt, up 115% YoY.
......
Market outlook: imports still reliant on long-term contract support, export momentum expected to continue
Entering September, China’s refined cobalt prices continued to edge lower from low levels. As of September 18, the low-end SMM refined cobalt price had fallen to 275,000 yuan/mt, while the low-end Rotterdam price outside China fell to $23/lb. The price spread between Chinese and overseas markets widened further: the theoretical import loss expanded to about 140,000 yuan/mt, with little sign of the import window opening in the near term. September imports are expected to remain supported by long-term contracts and bonded cargoes. Although theoretical export profits fluctuated, they remained in positive territory, at about 13,000-23,000 yuan/mt in mid-September. The export window remained open, and September exports are expected to stay at a relatively high level.