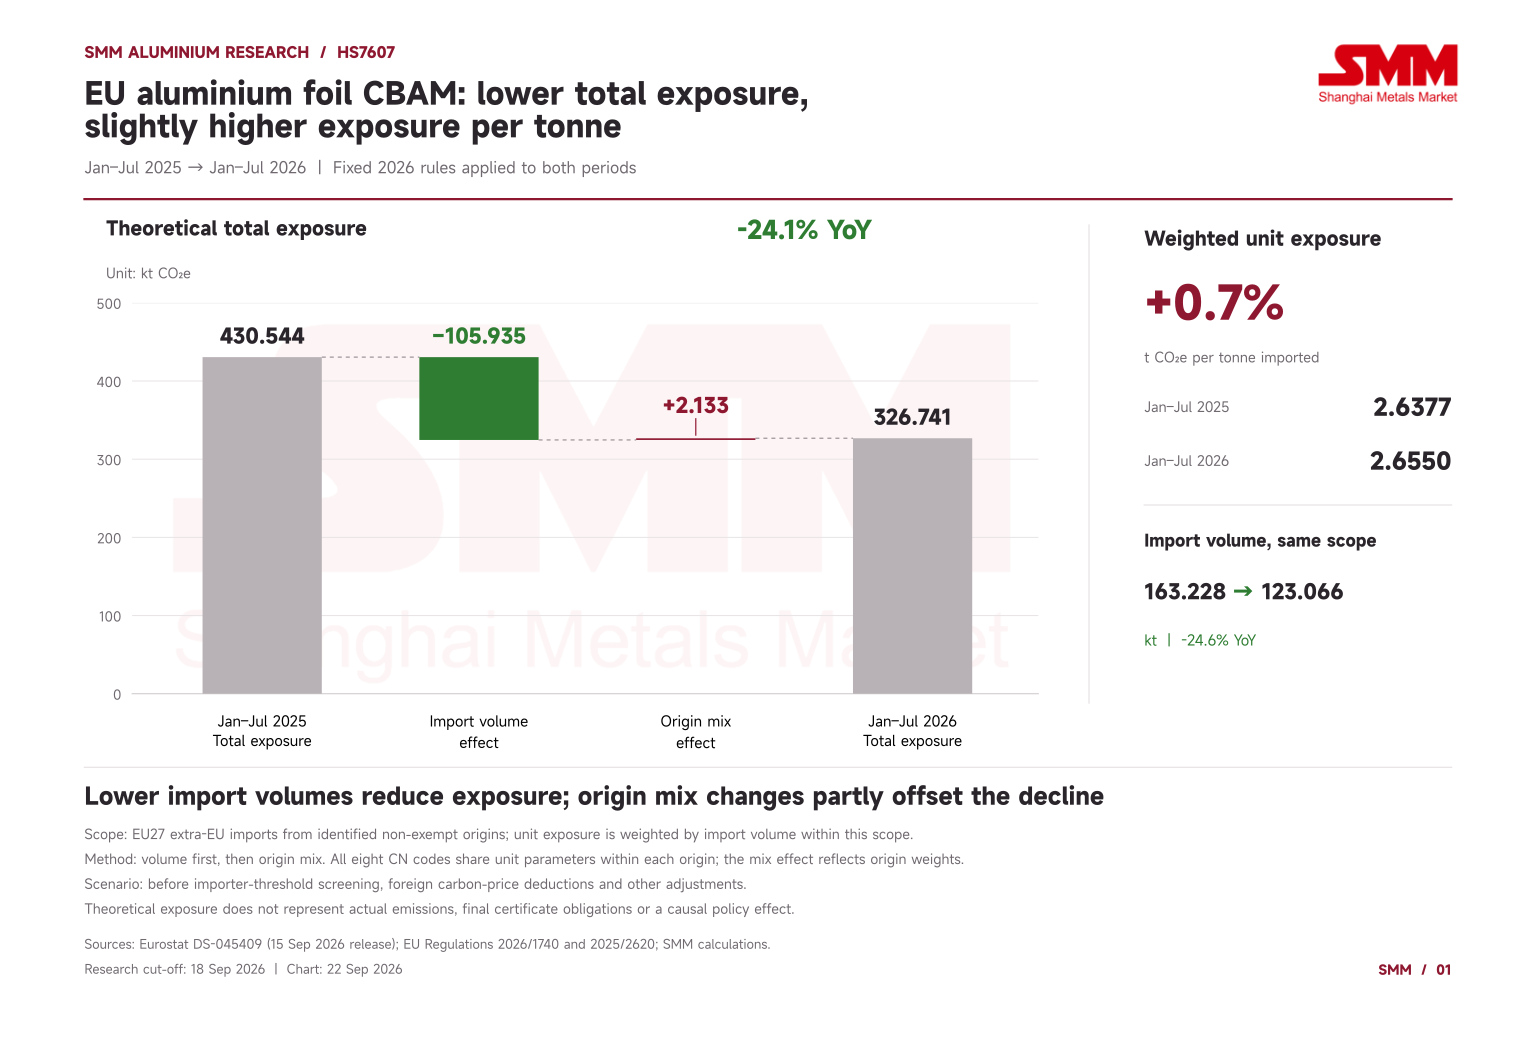
The EU's aluminium foil imports are contracting, but the unit CBAM exposure associated with its import mix is not falling alongside volumes. Eurostat Comext data updated on 15 September show extra-EU imports of HS7607 at 137.28 kt in January–July 2026, down 22.2% year on year. Applying a common set of 2026 default values, production routes and free allocation adjustments, theoretical net certificate exposure for identified non-exempt origins reached 326.74 kt CO₂e, down 24.1%. Yet trade-weighted unit exposure within that same calculable scope rose 0.7%, from 2.6377 to 2.6550 t CO₂e per tonne.
Lower import volumes explain the reduction. A sequential decomposition under fixed rules shows a volume effect of minus 105.94 kt CO₂e, while the change in origin mix added approximately 2,133 t CO₂e, partly offsetting that decline. China and Türkiye together accounted for 75.8% of calculable exposure, up from 69.7% a year earlier. European buyers therefore still need to manage their main sourcing relationships and upstream emissions evidence; declining imports alone do not establish that unit carbon-cost exposure has eased.
 Türkiye leads supply volumes, but China's default-value exposure is more concentrated
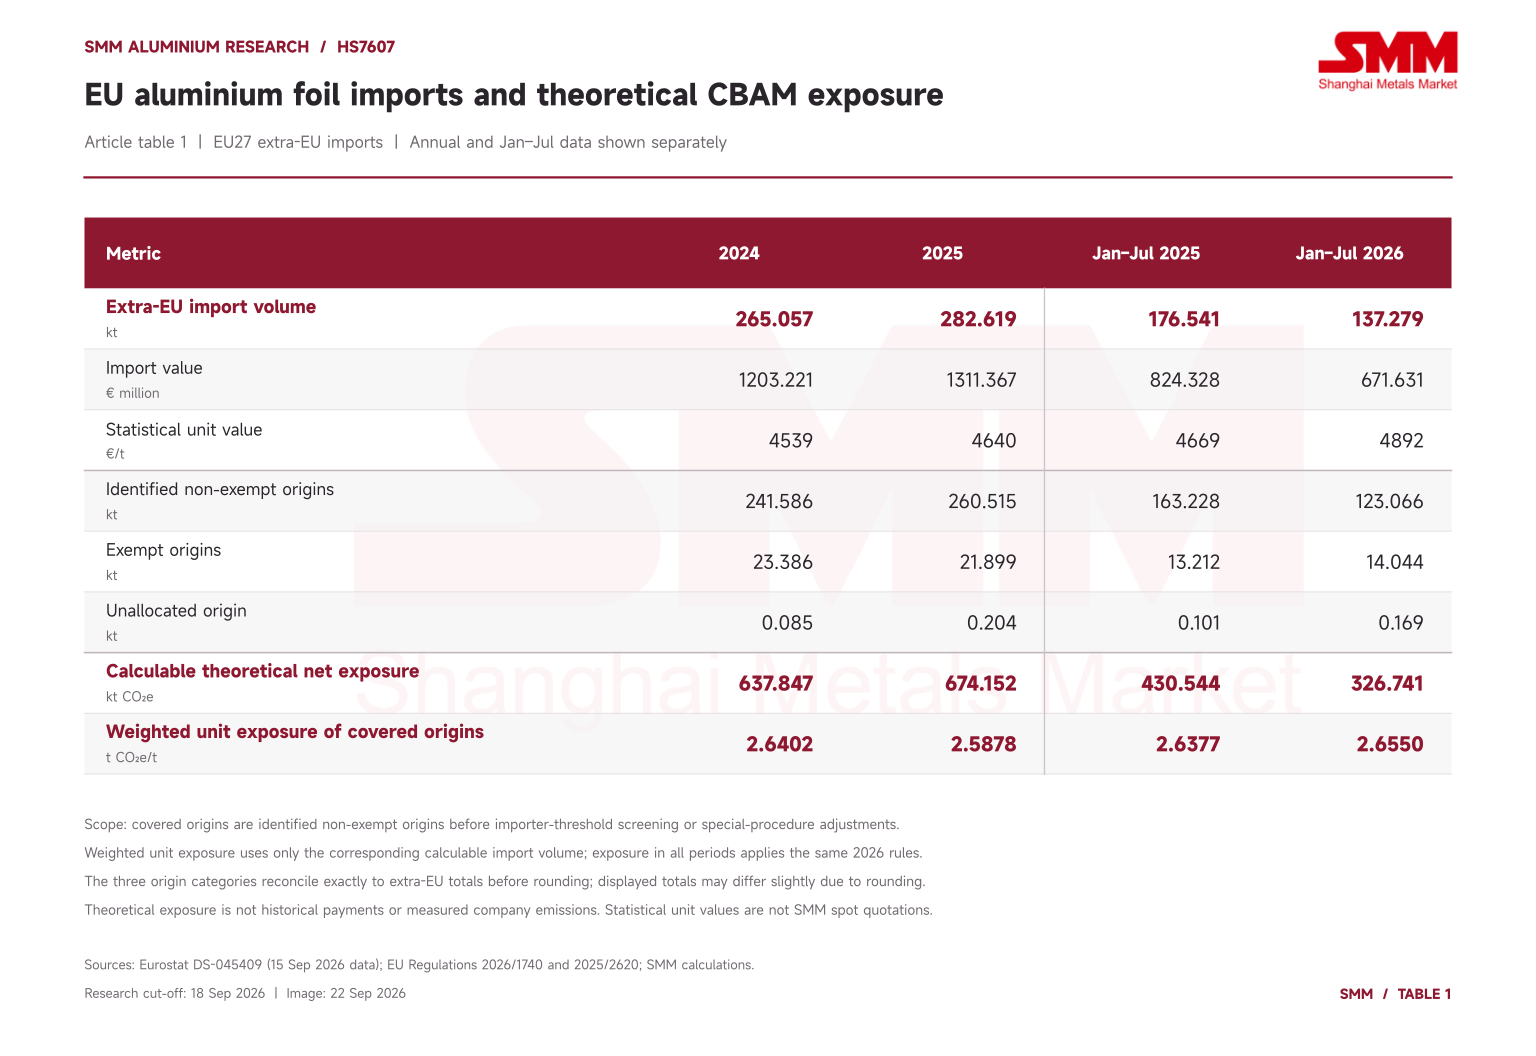
For the latest complete year, EU aluminium foil imports reached 282.62 kt in 2025, up 6.6% from 2024. Import value increased 9.0% to €1.311 billion, while the statistical unit value rose 2.2%, from €4,539/t to €4,640/t. This average combines different products, specifications and trading terms. It is neither an SMM spot quotation nor a substitute for a processing-fee assessment.
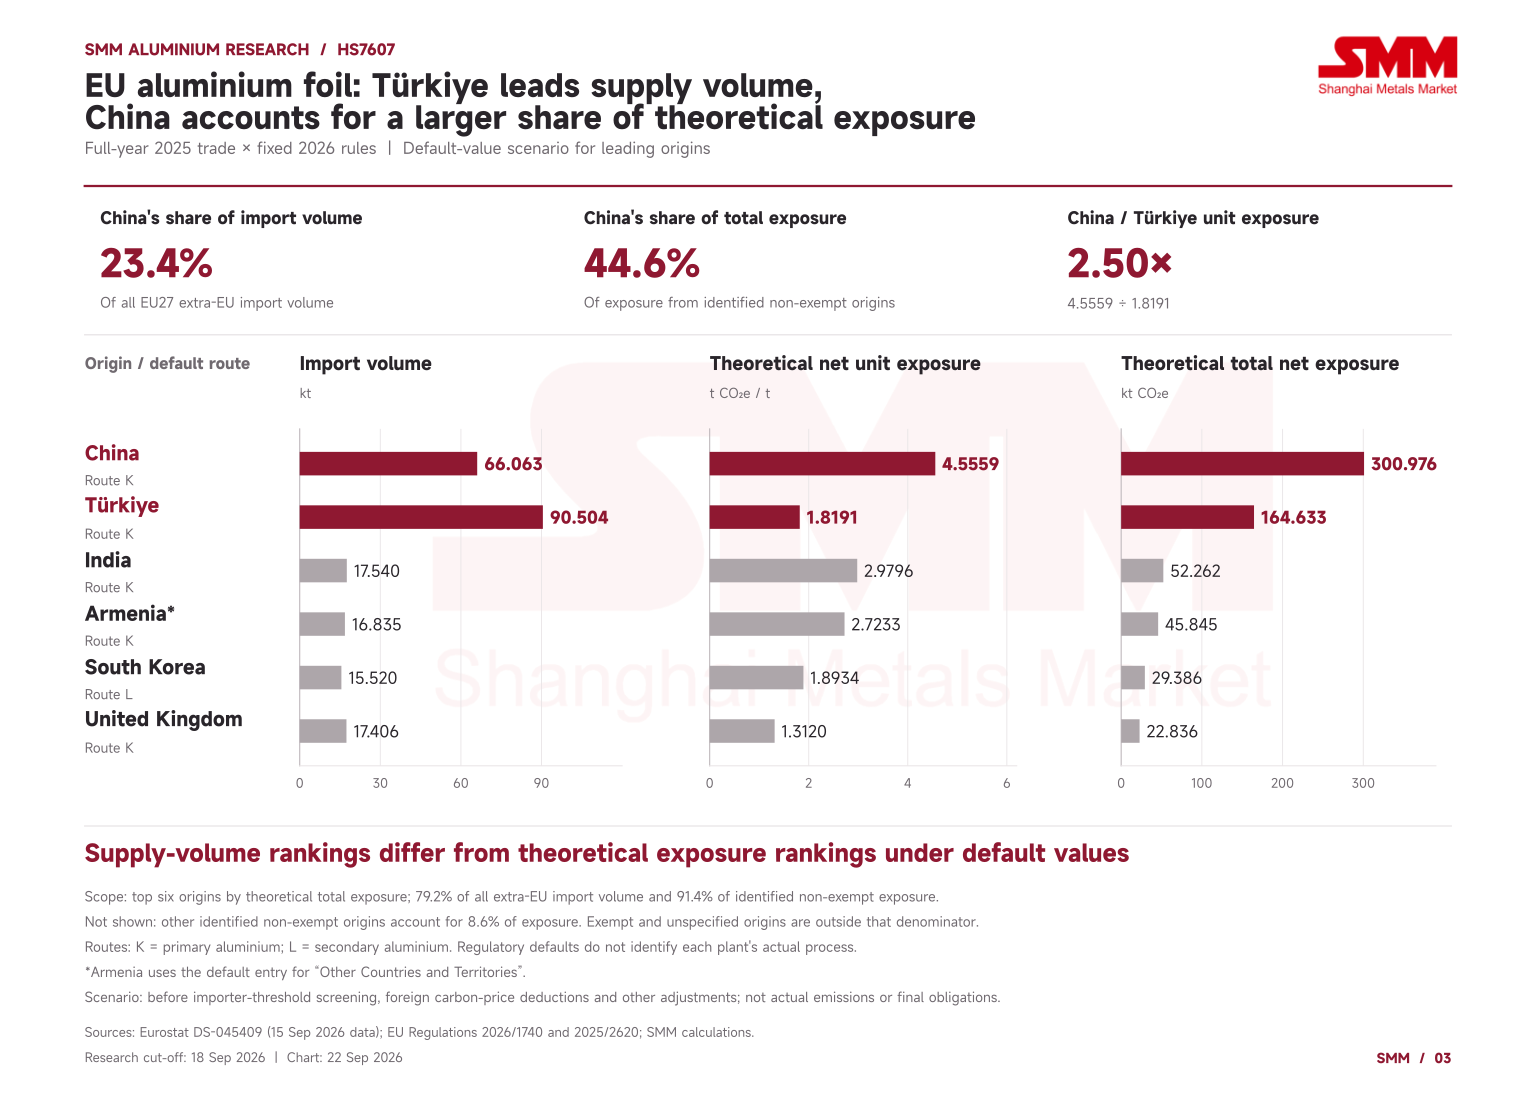
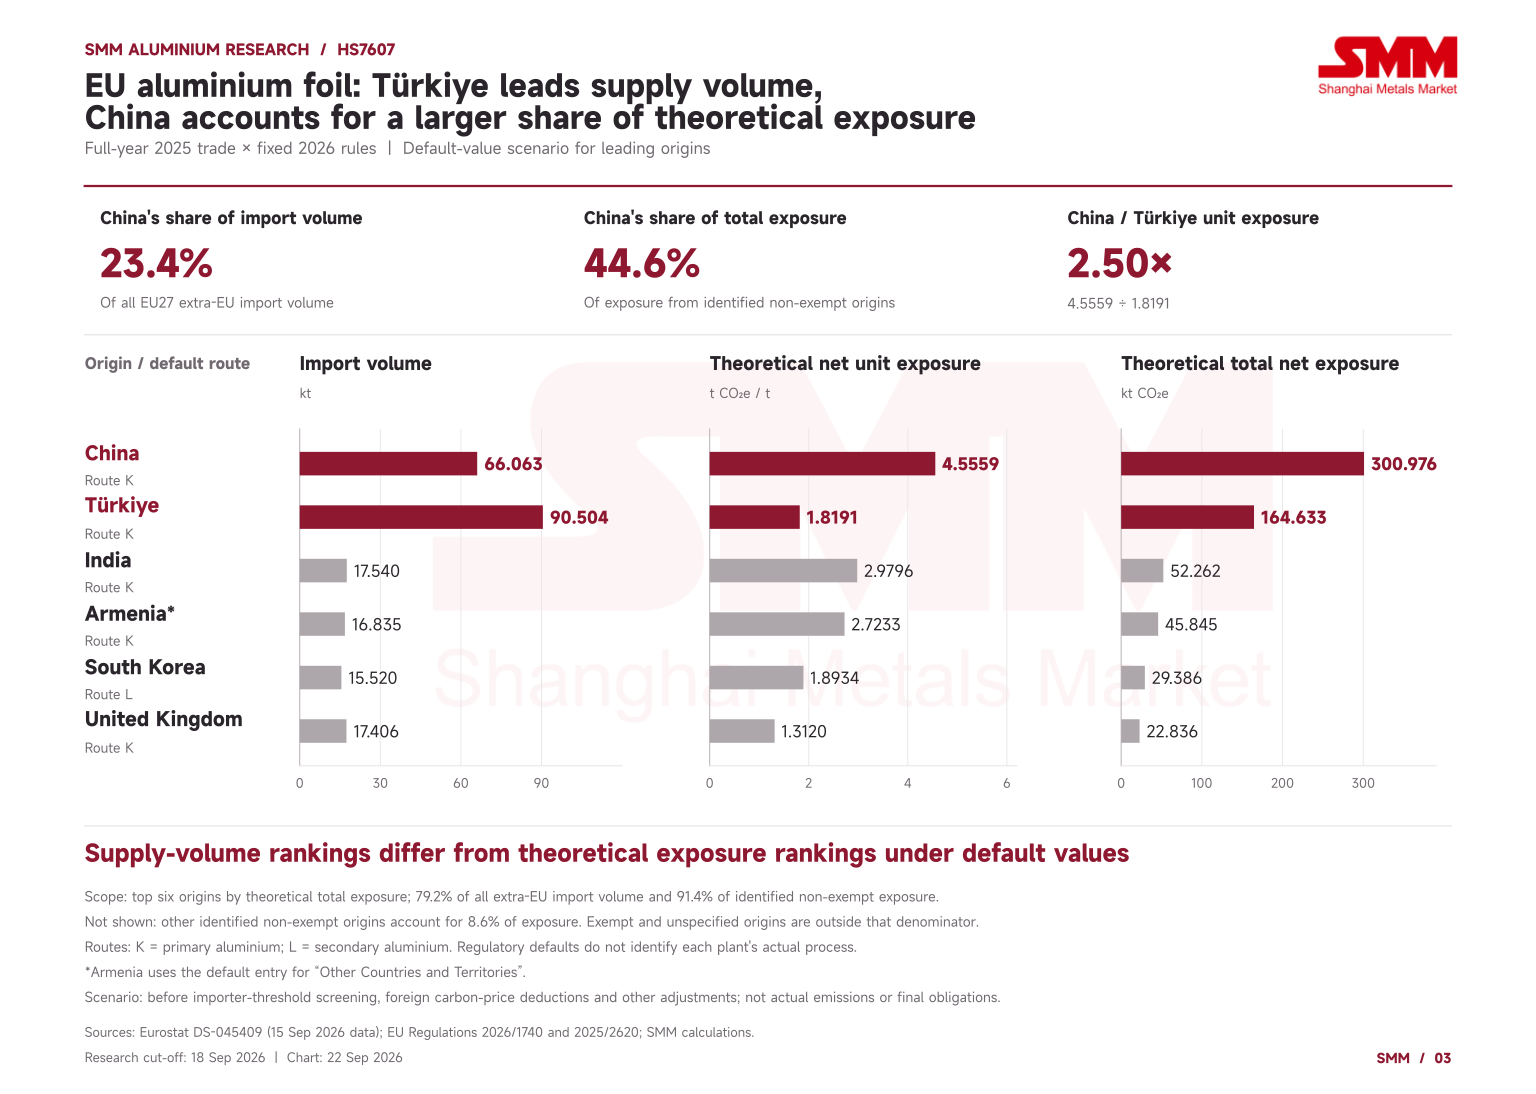
 Türkiye supplied 90.50 kt in 2025, representing 32.0% of extra-EU imports; China supplied 66.06 kt, or 23.4%. Under default values, however, China's theoretical net exposure of 4.5559 t CO₂e/t was approximately 2.50 times Türkiye's 1.8191 t CO₂e/t. China's total exposure consequently reached 300.98 kt CO₂e, or 44.6% of the calculable total, compared with Türkiye's 164.63 kt CO₂e and 24.4%. China, Türkiye, India, Armenia and South Korea together accounted for 88.0% of calculable 2025 exposure.
This ranking reflects trade weights and regulatory parameters, rather than measured national or company carbon efficiency. India's shipments to the EU rose 102.6% in 2025 to 17.54 kt, corresponding to 52.26 kt CO₂e of theoretical exposure. Armenia supplied 16.83 kt, corresponding to 45.85 kt CO₂e. Because the current default-value annex does not provide an Armenia-specific foil value, this calculation uses the legally prescribed “Other Countries and Territories” entry. That generic value is not presented as a measurement of Armenian production.
Thickness and processing define foil categories; customs codes do not identify battery foil directly
HS7607 covers aluminium foil no thicker than 0.2 mm, including printed foil and foil backed with paper, paperboard, plastics or similar materials. Backing is excluded when determining thickness. HS7606 plates, sheets and strip fall on the other side of the thickness boundary, above 0.2 mm. HS7607 already appears in Annex I to the CBAM Regulation and in Annex II, for which only direct emissions are counted. It is not a product newly added by the current downstream-extension proposal.
Checks of the 2024, 2025 and 2026 Combined Nomenclature found the same eight CN8 subheadings. Unbacked foil that is rolled but not further worked falls under 760711: 76071111 covers thickness below 0.021 mm in rolls weighing no more than 10 kg; 76071119 covers the other products in that thickness bracket; and 76071190 covers thickness from 0.021 mm to 0.2 mm. Further-worked unbacked foil is divided between 76071910 and 76071990 at the same thickness boundary. Backed foil below 0.021 mm falls under 76072010, while the thicker category separates aluminium composite panels, 76072091, from other products, 76072099. These codes distinguish thickness, backing, processing and some packaging characteristics, but do not separately identify all battery, pharmaceutical or food applications. A change in 76071119 cannot therefore be described directly as a change in battery-foil demand.
 Default values and free allocation adjustments must follow each origin's specified route
Correcting Regulation 2026/1740, published in July 2026, replaces the default-value annex and removes the annual columns that already included mark-ups. The mark-up must instead be calculated from the base “total emissions” value. Aluminium carries a 10% mark-up in 2026. All eight foil subheadings were verified as having Column B benchmarks of 1.599 t CO₂e/t for route K and 0.258 for route L. K and L are the regulatory primary- and secondary-aluminium route labels; they do not establish every plant's actual production route.
Using the 2026 CBAM factor of 97.5% and a cross-sectoral correction factor of 1, before foreign carbon-price deductions, importer-threshold screening and other adjustments, theoretical net unit exposure is:
N = max [base default D × 1.10 − Column B route benchmark × 0.975 × 1, 0]
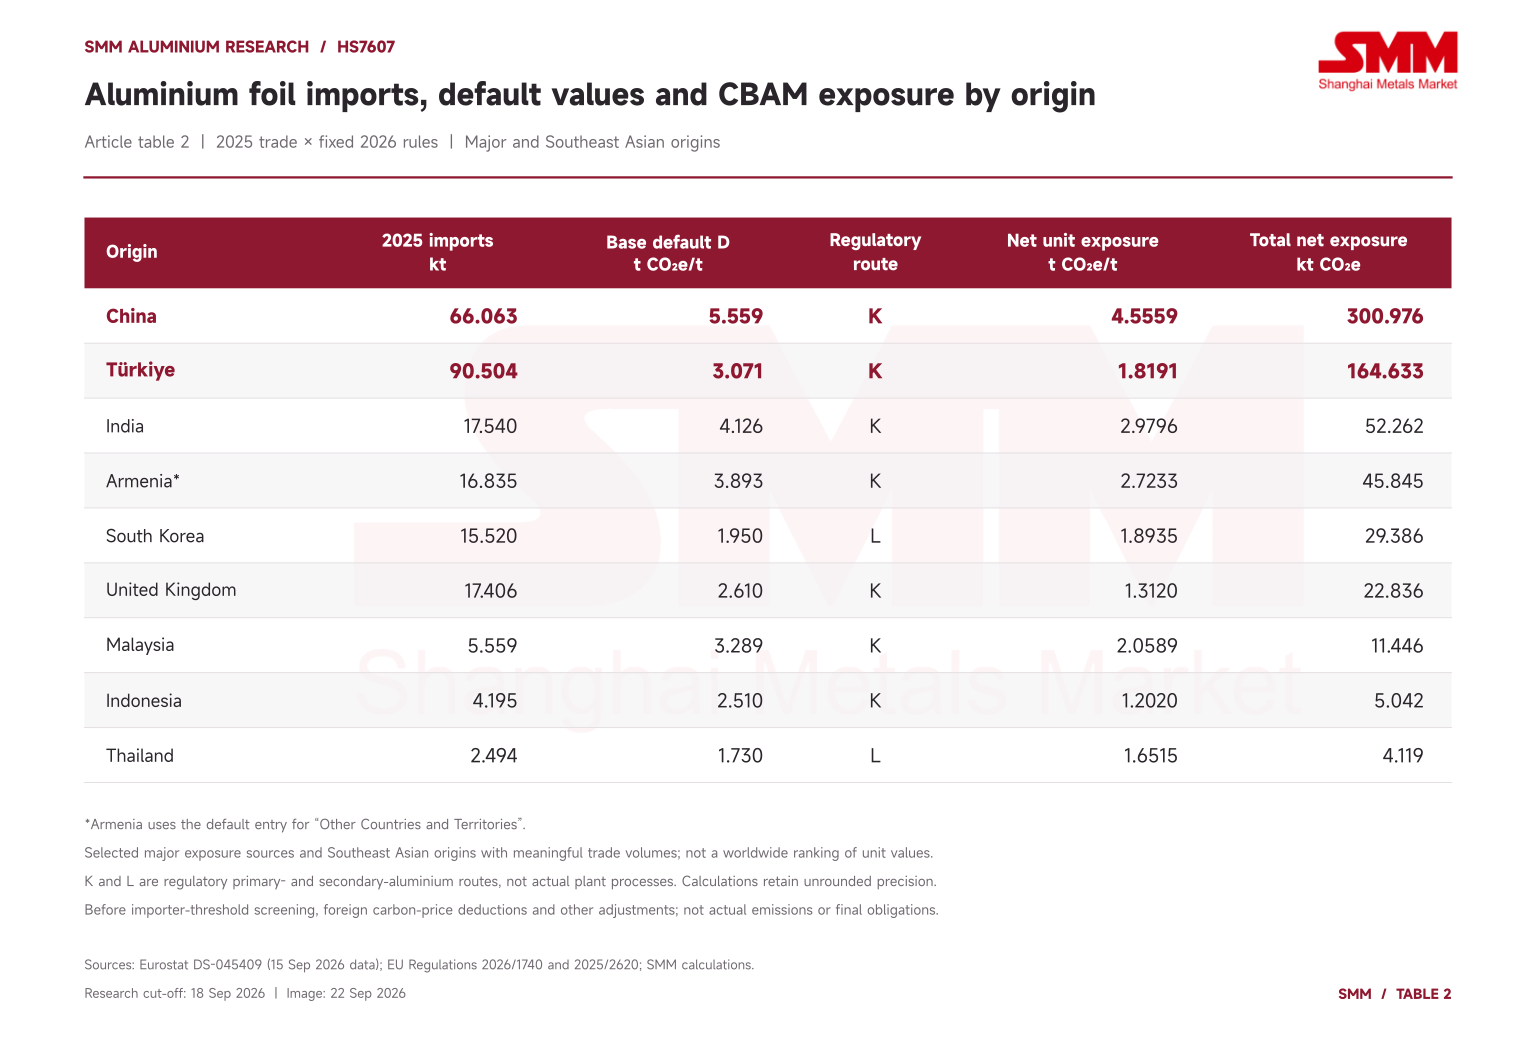 The resulting free allocation adjustment is 1.559025 t CO₂e/t for route K and 0.251550 for route L. China's base default of 5.559 becomes 6.1149 after the mark-up and 4.555875 after the adjustment. Türkiye's base value of 3.071 yields 1.819075 under the same K route. The 97.5% factor applies to the benchmark adjustment; it does not exempt 97.5% of all default embedded emissions.
South Korea's base default is below Türkiye's, but its smaller adjustment under route L leaves net exposure slightly higher. Similarly, Thailand's base default of 1.730 is below Indonesia's 2.510, yet their net exposures are 1.6515 and 1.2020 respectively. A secondary-route label alone therefore does not guarantee lower net certificate exposure under the default method.
The contraction is concentrated in thin foil that is not further worked; backed products still grow
In 2025, rolled but not further-worked foil under 760711 accounted for 63.2% of extra-EU foil imports, further-worked foil under 760719 for 14.7%, and backed products under 760720 for 22.0%, including their respective unspecified statistical subcategories. In January–July 2026, those shares changed to 55.9%, 17.4% and 26.8%. Volumes fell 33.2% and 8.1% in the first two groups but rose 2.5% in backed products.
Imports under 76071119 fell from 67.43 kt to 42.52 kt, a reduction of 24.91 kt that accounted for 63.5% of the net HS7607 volume decline. Imports under 76071190 fell by approximately 9,597 tonnes, contributing another 24.4%. By contrast, 76071990 grew 2.7% and aluminium composite panels under 76072091 grew 11.6%. The aggregate contraction therefore masks clear product differences and does not establish a uniform decline in demand for every foil category. The simultaneous 4.8% increase in statistical unit value to €4,892/t also reflects product, origin and price changes; it cannot be read solely as an increase in foil prices.
 Origin-level changes were also uneven. In January–July 2026, China supplied 35.39 kt, down 18.1%, and Türkiye supplied 47.51 kt, down 16.4%. Both declined less than total extra-EU imports, raising their import shares to 25.8% and 34.6%. Armenia's shipments fell from 10.75 kt to approximately 2,068 tonnes, down 80.8%; India and South Korea declined 29.9% and 30.3% respectively. UK-origin imports increased 4.9% to 10.81 kt.
Within Southeast Asia, Malaysia fell from approximately 4,213 tonnes to 2,462 tonnes, down 41.5%, and Indonesia from 2,857 tonnes to 807 tonnes, down 71.7%. Thailand increased from 1,599 tonnes to 1,869 tonnes, up 16.9%. Recorded Vietnamese imports rose 66.8%, from 54.720 tonnes to 91.250 tonnes, but Vietnam's full-year 2025 volume was only 72.386 tonnes, approximately 0.026% of extra-EU imports. A high growth rate from that base does not make it a major replacement supplier. Vietnam's regulatory route is L and its net unit exposure is 2.4765 t CO₂e/t; neither the Thai nor Indonesian value can be substituted.
Exempt origins add another dimension. They supplied 21.90 kt in 2025, principally from Switzerland, Norway and Iceland, accounting for 7.7% of extra-EU imports. Their January–July 2026 volume increased 6.3% to 14.04 kt, lifting their share to 10.2%. This helps explain why identified non-exempt volumes declined 24.6%, faster than the 22.2% fall in total imports. It does not demonstrate that buyers actively changed sourcing because of CBAM.
All eight CN8 codes were individually verified as sharing the same default value and route benchmark within a given origin. Consequently, changing the CN mix within that origin alone does not change its unit exposure in this fixed-rule scenario. Changes in weighted unit exposure arise from origin weights. The positive mix effect in January–July 2026 rules out describing the lower theoretical total as evidence that the import mix became uniformly less carbon-intensive, let alone as proof of actual company emissions reductions.
Procurement decisions require precursor evidence and verified data
For a uniform-price sensitivity comparison only, the published Q2 2026 certificate price of €75.28/t CO₂e implies approximately €343 per tonne of foil for China and €137 for Türkiye under default values, a difference of €206/t. That comparison can help prioritise supplier-data verification. It excludes freight, tariffs, processing fees and foreign carbon-price deductions, and is not a final landed-cost differential.
Certificate prices must be matched to the import quarter. The published Q1 price is €75.36 and the Q2 price €75.28. Matching each quarter's theoretical exposure to its corresponding price gives an H1 2026 amount of approximately €20.54 million. The Q3 price had not been published by 18 September, so this article does not give a complete January–July amount using actual applicable quarterly prices. Applying 2026 parameters to 2024 and 2025 trade structures likewise remains a fixed-rule comparison, not a claim that those years generated corresponding payments.
Default values are a screening starting point. Under verified actual emissions, aluminium foil is a complex good. Its calculation must connect emissions from the plant's processes within the defined boundary with embedded emissions in consumed unwrought aluminium and other relevant aluminium-product precursors. Precursor consumption ratios, origin, production periods and applicable emissions data affect the result. Reporting only the rolling plant's fuel emissions is insufficient. The current method also provides for zero embedded emissions for precursors originating in the EU or Annex III exempt countries and territories; applying that provision requires origin evidence.
The free allocation adjustment must also follow the actual-data method. Foil has a Column A process benchmark of 0.166, but a complex good must also include its precursors' embedded free allocation adjustments as prescribed. It is incorrect to deduct only 0.166, or to transfer the default method's total Column B benchmark without checking the actual-data requirements. The direct-emissions boundary includes relevant fuel, heat and applicable process emissions. Aluminium currently counts only direct emissions, so purchased-electricity indirect emissions cannot simply be added to this certificate calculation. The methodology expressly excludes cutting, welding and finishing of aluminium products; attribution must follow the legal boundary.
For Chinese and other major suppliers, verifiable data linked to specific installations, precursor batches and reporting periods carry more commercial value than a “low-carbon” or “recycled” label alone. Buyers should first establish CN classification and customs origin, then compare default scenarios with properly supported actual-data calculations and define data submission, verification and discrepancy-sharing arrangements in contracts. The trade data cannot establish how much any individual company would save by switching to actual values.
Finally, the 50-tonne threshold applies to the importer’s aggregate annual net mass across the relevant CN goods, not separately to every origin or foil code. Exceeding it brings the relevant full-year imports into scope. Comext lacks importer-level records, preventing threshold screening here. Special customs procedures, returned goods and foreign carbon-price deductions are also unadjusted. Under default embedded emissions, foreign carbon-price deductions must follow the annual default-carbon-price mechanism in Article 9; an arbitrary carbon-market quotation cannot simply be subtracted. Unspecified origin volumes of 204.143 tonnes in 2025 and 168.698 tonnes in January–July 2026 remain in market totals but are not assigned a country default.
![Aluminum Prices Gain Phased Support as China-US Presidential Meeting Approaches and Destocking Accelerates [SMM Aluminum Morning Meeting Summary]](https://imgqn.smm.cn/usercenter/IOKIL20251217171652.jpg)