Overview
For a mining company, producing more metal sounds like the obvious route to better results. Implats’ record shows why it is not that simple. Output matters, but so do the prices of the different metals, the cost of producing them and the reliability of the journey from underground ore to a product customers can buy.
Despite its name, Impala Platinum is not a one-metal business. Platinum-group metals (PGMs) include platinum, palladium and rhodium, which have different uses and price cycles. These metals occur together in ore, so a producer cannot simply choose to mine whichever one has become most expensive.
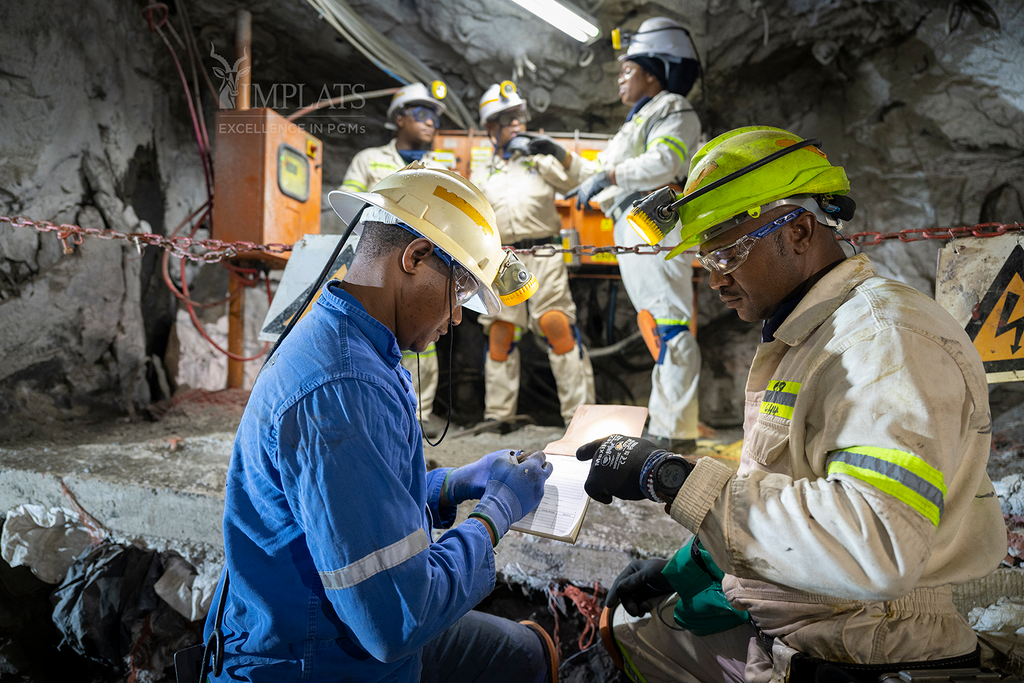
This analysis uses Implats’ recorded data for financial years from 2010 to 2025, each ending on 30 June. It tracks reported production and average prices received for platinum, palladium and rhodium, alongside separate market benchmarks for ruthenium and iridium. The central lesson is that a successful PGM business needs both favourable markets and dependable operations. Neither alone is enough.
Production Trends and Metal Mix
The early years show how quickly disruption can change the production picture. Combined reported platinum, palladium and rhodium output was about 3.29 million ounces in Financial Year 2011 (FY2011). By FY2014, it had fallen to approximately 2.05 million ounces. That year included the five-month strike affecting South Africa’s platinum industry. The decline was not simply a matter of having less metal underground: it reflected the difficulty of keeping mines operating and delivering finished product.
Output subsequently recovered, although not in a straight line. The pandemic brought further disruption in FY2020, followed by a recovery in FY2021. However, that recovery also included a full year of Impala Canada, acquired in December 2019. This matters because a larger company can report more production without its existing mines becoming more productive.
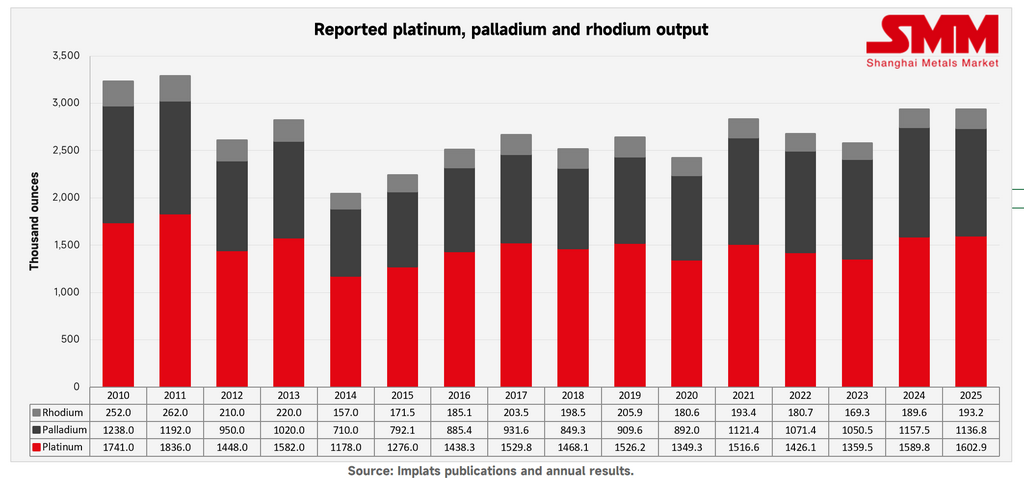
By FY2025, reported output reached approximately 1.60 million ounces of platinum, 1.14 million ounces of palladium and 193,200 ounces of rhodium. Together, these amounted to 2.93 million ounces, close to the FY2024 total. Platinum remained the largest physical component, followed by palladium. Rhodium represented only about 6.6% of this three-metal total. These figures are not the company’s total output across all reported metals.
There are two important qualifications. First, the company changed over time, including the addition of Canada and Bafokeng. Second, the historical series measures gross refined output, with saleable output included in later reporting. It also includes material handled through Impala Refining Services, which processes supplies from other producers. It is not a measure of production from wholly owned mines alone. Zimbabwean operations, including Zimplats and Mimosa, are part of this wider mine-to-market chain; the figures should not be described as South African production only.
The practical lesson is that metal mined, metal refined and metal sold are different stages. Material can wait between them. Clearing a processing backlog can lift finished output without an equivalent increase in mining that year. Conversely, a furnace problem can delay sales even when mining continues. Reliable processing, maintenance and safe working conditions are therefore as important as the headline ounce count.
Realised Price Cycles
The price series shows much larger swings than the production series. A “realised price” is the average price the company received, not the highest market quotation during the year. In this dataset, these averages are measured in US dollars per troy ounce over Implats’ financial year.
Platinum’s realised price reached $1,691 an ounce in FY2011, fell to $827 in FY2019 and recovered to $986 in FY2025. That recovery still left it well below the earlier level. Palladium and rhodium followed more dramatic paths. Palladium rose from $376 in FY2010 to $2,419 in FY2021, before falling to $986 in FY2025. Rhodium reached $17,610 in FY2021, then declined to $4,818 in FY2025. From those FY2021 levels, the falls were approximately 59% for palladium and 73% for rhodium. These are changes in annual company averages, not measurements from daily market peaks.
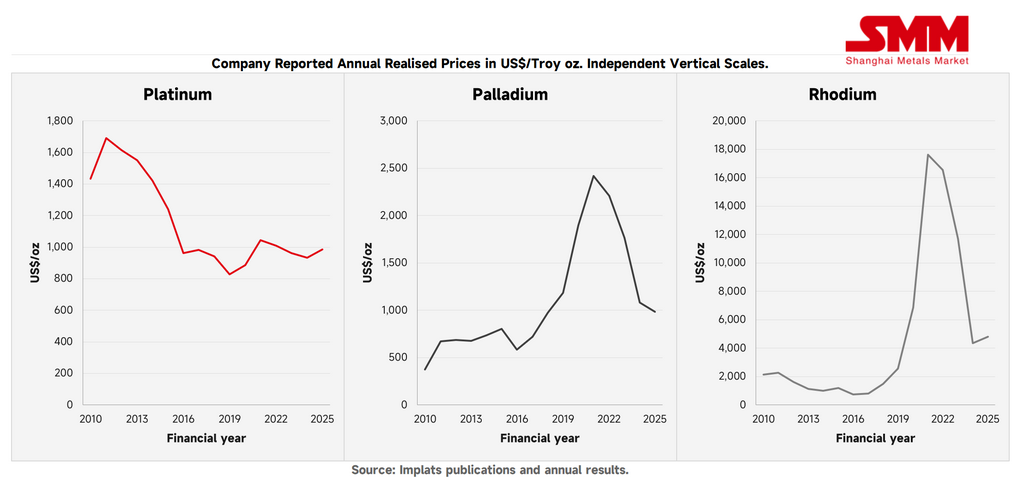
This explains why the metal mix matters. At its FY2021 average, rhodium was worth almost 17 times as much per ounce as platinum. A relatively small volume can therefore have a large effect on the value of the overall basket. Equally, a sharp price fall can weaken earnings even when the company continues producing substantial volumes.
High prices also encourage customers to adapt. Johnson Matthey documented the replacement of some palladium with platinum in vehicle catalysts and reduced rhodium use in glassmaking following the earlier price surge. A boom can help a producer today while encouraging changes that reduce demand for particular metals later.
Currency adds another layer. In FY2025, Implats’ dollar revenue per six-metal ounce sold rose by about 3%, but the equivalent rand figure was essentially unchanged. A stronger rand offset the improvement in dollar prices. For operations paying many of their bills in rand, a better dollar price does not automatically mean more room between revenue and costs.
The data being used nevertheless cannot establish profit simply by multiplying production by price. Produced ounces are not necessarily sold ounces, and gross processed volumes do not all represent the same economic interest. The price charts explain exposure to the market, not a complete income statement.
Other PGMs and Limitations
The smaller metals deserve attention, but the evidence must be kept in its proper place. The data used contains complete annual production and realised-price series for platinum, palladium and rhodium. Equivalent group-wide series for ruthenium, iridium and osmium were not located in the reviewed disclosures. A missing entry does not mean zero production, zero sales or no commercial importance.
The separate benchmarks show why these gaps matter. Ruthenium’s annual market quotation averaged $42 an ounce in calendar 2016 and approximately $749 in calendar 2025. Iridium averaged about $5,158 in 2021 and $4,448 in 2025. Their cycles were clearly different from those of the larger-volume metals.
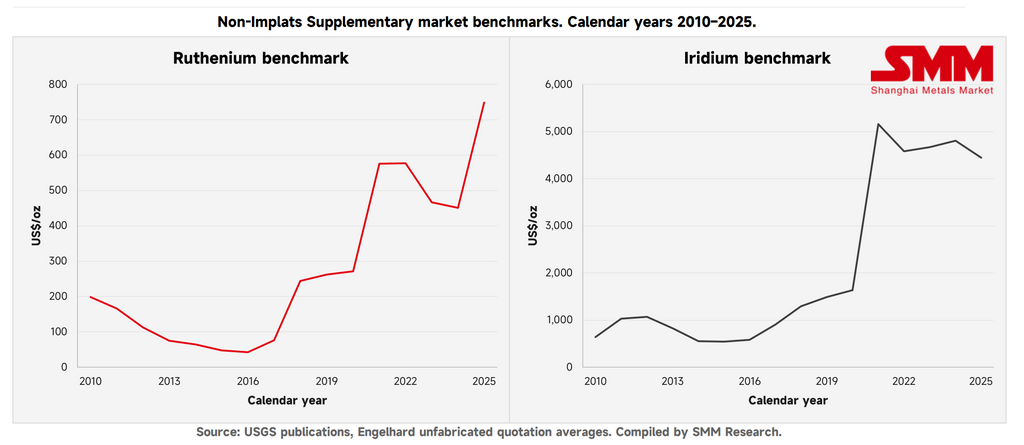
These metals also have different industrial roles. Iridium, for example, is used in certain systems that split water to produce hydrogen. Its demand story therefore extends beyond vehicle exhaust catalysts.
However, the benchmark prices are calendar-year market quotations reported by USGS, not prices received by Implats. Without matching company sales volumes and transaction prices, they cannot tell us how much the metals contributed to revenue or cash generation. The terminology also needs care. Implats’ “6E” measure combines platinum, palladium, rhodium, ruthenium, iridium and gold. Gold is not a PGM, while osmium is excluded. A six-metal total therefore cannot be treated as a total for the six platinum-group metals, nor can any unexplained balance safely be assigned to osmium.
Finally, national customs data measure trade, not an individual company’s production. Combining mine output, refinery output and exports can count the same metal more than once. These boundaries are not technical inconveniences: they determine which conclusions the evidence can genuinely support.
Conclusion and Outlook
The 2010–2025 record is a story of operating disruptions, changes in the company’s size and very different price cycles within the same metal basket. It does not support a simple claim that more ounces always produce better results, or that a price recovery proves lasting improvement at the mines.
The latest update is Implats’ FY2026 annual results, released on 3 September 2026. Refined and saleable output increased by 5% to 3.56 million 6E ounces, while rand revenue per 6E ounce rose by 51%. Reported free cash flow reached R22.0 billion. The contrast shows how much the price environment mattered alongside improved finished-metal delivery. These six-metal figures are separate from the historical three-metal charts, and Implats restated its FY2025 production comparison.
There are reasons for caution. Costs per ounce, on the company’s stock-adjusted measure, rose by 8%. Basic earnings also benefited from an R8.1 billion post-tax impairment reversal: a reversal of earlier asset write-downs, not new cash from selling metal. For FY2027, Implats forecasts 3.30–3.50 million refined and saleable 6E ounces, allowing for the Rustenburg safety reset and processing stoppage, as well as a planned Zimplats furnace rebuild. This is company guidance, not a guaranteed outcome.
Longer term, vehicle technology remains important. Petrol, diesel and hybrid vehicles use exhaust-treatment catalysts; battery-only vehicles do not need them. The mix of vehicles sold matters, not just the total number. Industrial uses and jewellery provide other sources of demand, but the metals should not be assumed to share one future price path.
For Implats, the real test is what happens when markets are less generous: can it operate safely, control costs, turn work-in-progress into cash and invest enough to sustain future production? Higher prices create breathing room. Lasting strength comes from using that room well.
References
- USGS platinum-group metals yearbook.
- Implats’ 2014 integrated-report overview.
- Johnson Matthey market analysis.
- FY2026 results and FY2027 guidance.
- FY2026 results announcement.
- Johnson Matthey’s analysis of minor PGMs.
- Implats’ FY2021 commentary.
- Implats’ FY2025 operating statistics.
- USGS 2018 yearbook, December 2022 report, December 2025 report.
- FY2025 financial commentary.
- FY2025 reporting footnotes, FY2021 operating review.
- FY2014 historical statistics, FY2019 statistics, FY2025 statistics.
- Historical prices, FY2021 prices, FY2025 prices.
- Johnson Matthey’s May 2023 market report.
![[SMM Precious Metals Express]](https://imgqn.smm.cn/usercenter/VphiQ20251217171736.jpg)
![[SMM Precious Metals Express]](https://imgqn.smm.cn/usercenter/SSKOK20251217171734.jpeg)
![[SMM Precious Metals Express]](https://imgqn.smm.cn/usercenter/PeWqW20251217171735.jpg)