I. The conclusion first: the EU closed the mill, not the furnace
This round of EU stainless policy has a remarkably clean boundary.
On one side sits the finished product. Cold-rolled coil (HS 7219/7220), hot-rolled coil, plate, bar and wire rod now face six layers at once: anti-dumping duties, countervailing duties, anti-circumvention extensions, a quota cut of roughly 47%, a 50% out-of-quota tariff, the melt-and-pour evidence obligation that takes effect on 1st October, and a CBAM obligation that is beginning to ramp.
On the other side sits stainless slab, HS 7218. It carries none of those six. No anti-dumping duty, no countervailing duty, no place on the anti-circumvention list, and no exposure to the three product categories where safeguard quotas were cut hardest. CBAM does cover slab, but only 2.5% of embedded emissions must be surrendered in 2026.
So for the same exporter and the same heat of steel, the finished route costs up to 41.6% in duty plus a fight for quota, while the slab route runs largely unobstructed. Nobody has to direct the market toward that opening. It finds it.
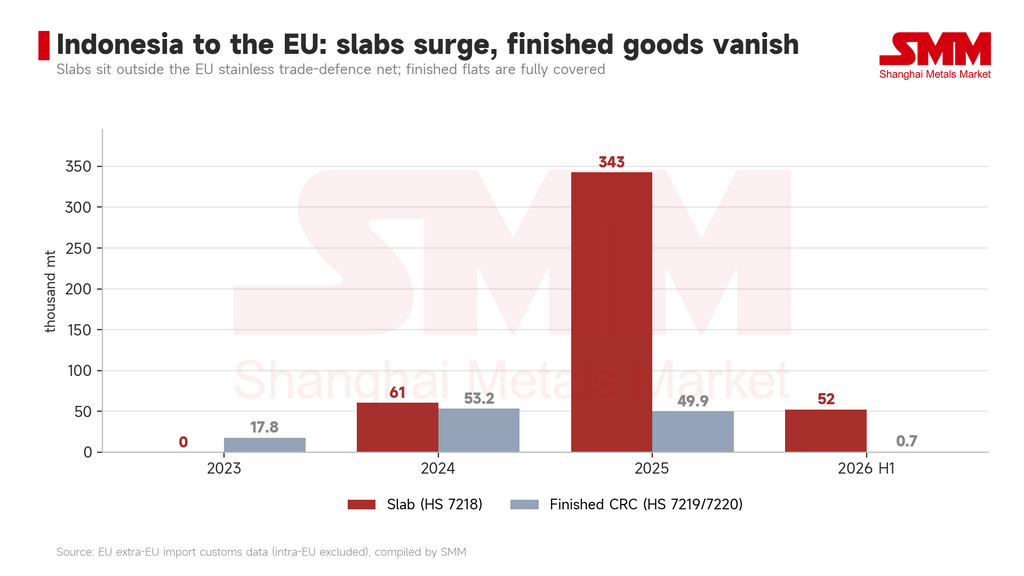
Indonesia's two curves have grown into exact opposites. In 2023, Indonesian slab shipments to the EU were effectively zero while finished shipments ran at 17,800 mt. By 2025, slab stood at 342,900 mt against 49,900 mt of finished product. In the first half of 2026, slab reached 52,400 mt and finished product fell to 737 mt.
That finished-product line is not weakening. It has gone to zero. Six months of 2026 shipments add up to roughly one week of 2025 volume.
II. From nowhere to first place in two years
The clearest measure of how open the slab channel is comes from the EU's own import mix.
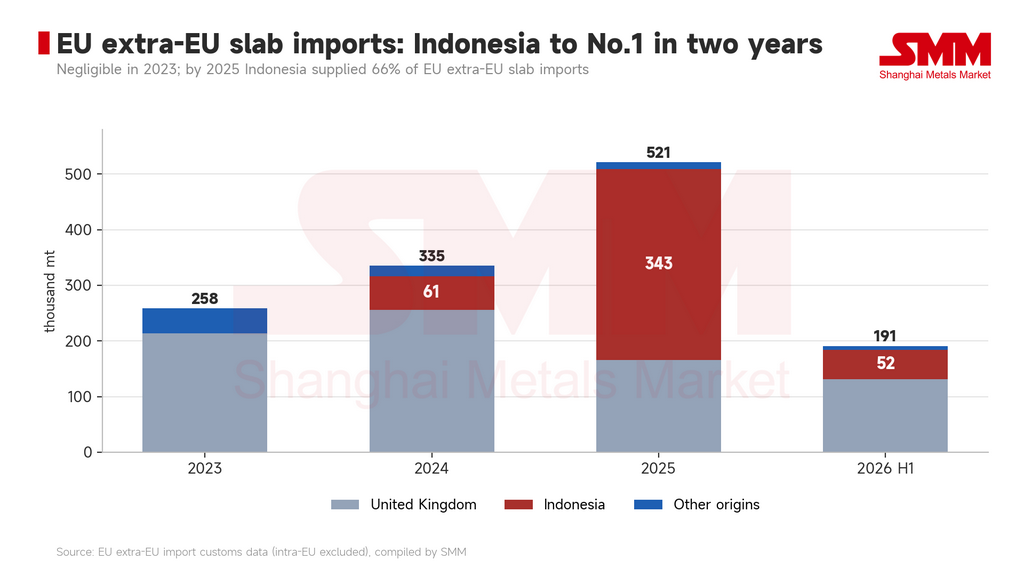
In 2023, EU extra-EU slab imports totalled 258,300 mt. The United Kingdom alone supplied 213,500 mt, with the remainder scattered across Kazakhstan, Ukraine and South Korea. Indonesia did not clear the reporting threshold.
In 2024, Indonesia appeared at 60,600 mt.
In 2025, total EU extra-EU slab imports jumped to 521,400 mt. Indonesia supplied 342,900 mt of that — 66% of the total, and more than double the volume of the long-standing leader, the United Kingdom, at 165,700 mt. British slab shipments to the EU fell that same year.
A supplier that was not on the list two years ago now provides two-thirds of Europe's imported slab. That position was not bought with price. It was found in a gap in the tariff schedule.
One point of definition matters here. Slab is the only stainless category where the EU depends primarily on imports from outside the bloc: intra-EU trade accounts for just 34% of the flow, against 50% to 90% for the five finished categories. Europe cannot melt enough stainless crude steel to feed its own rolling mills and must buy semi-finished material to roll. That is the industrial reason the slab channel is open, and the reason it cannot be closed quickly.
III. 71x: the number that says more than the legal texts
Dividing Indonesian slab volumes into the EU by finished volumes gives the most compressed expression of what this policy round has done.
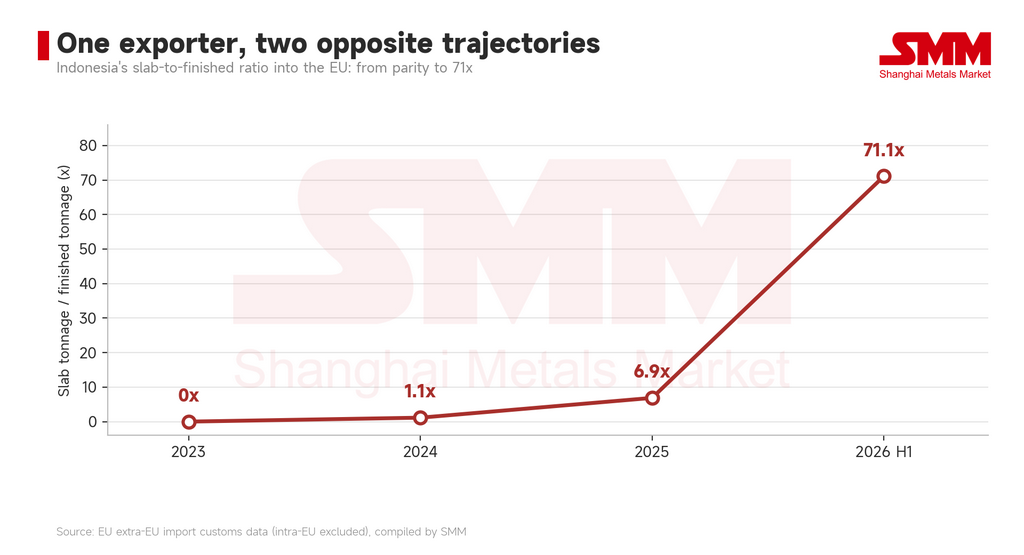
In 2024 the ratio was 1.1x — slab and finished product moving in comparable volumes on separate tracks. In 2025 it was 6.9x. In the first half of 2026 it reached 71.1x.
The shift was not gradual. It jumped in the window between late 2025 and early 2026, matching the point at which Regulation (EU) 2026/1384 moved from proposal to law.
What that curve shows is a gap in speed. Companies reorganise faster than legislation is amended. Each round of rules deforms the shape of the trade, and the deformation always runs toward whichever barrier is thinnest at the time. Every duty added on the finished side makes the slab curve steeper.
It is worth adding that the slab does not disappear once it lands. It enters European rolling mills and comes out as EU-origin cold-rolled coil. To the end user it is the same steel. To customs and trade-defence law it now has a different identity. What the European stainless industry is being protected in is the rolling stage, not the melting stage — and that distinction underpins everything that follows.
IV. The expiry reviews create no new duties — they lock in the existing ones
On 15th September the European Commission initiated two expiry reviews covering cold-rolled stainless. Case R871 concerns the China Mainland and Taiwan (PoC); case R872 concerns India and Indonesia. Both were requested by the European Steel Association (EUROFER) before the measures were due to lapse.
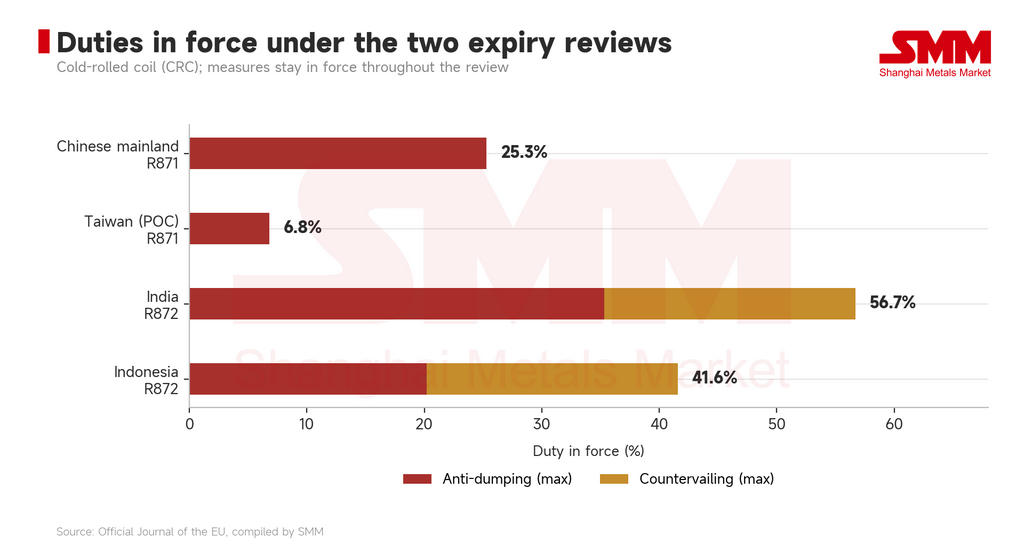
One common misreading is worth clearing up first. An expiry review is not a fresh investigation. It sets no new duty rates, and there is no window in which duties are suspended while the review runs. The legal mechanism is simply this: if nobody requests a review before measures expire, they lapse automatically; once a review is initiated, the existing measures remain fully in force throughout, until a determination is made. For exporters, the one certainty from the day of initiation is that current rates hold for at least another year, and typically for five.
Ranked by current maximum rate: India at 56.7% (35.3% anti-dumping plus 21.4% countervailing), Indonesia at 41.6% (20.2% plus 21.4%), the China Mainland at 25.3%, and Taiwan (PoC) at 6.8%.
Indonesia is the odd case among the four. Its finished shipments to the EU have already gone to zero, so the review has almost no marginal effect on what it ships today — the duties already keep the product out, and five more years will not push it lower. The real effect is on expectations. It signals that for the next five years there is no prospect of Indonesian finished stainless re-entering Europe through the front door. That leaves two routes: slab, or re-rolling in a third country. And from 1 October, the re-rolling route runs into melt-and-pour evidence.
Taiwan (PoC) sits at the opposite end. Its 6.8% is the lowest rate of the four, and it shipped 299,900 mt of finished product to the EU in 2025, making it the largest extra-EU source of CRC. The review therefore puts real volume at risk. Its CRC quota also runs entirely on the single MFN track: once the allocation is used, shipments face the 50% out-of-quota tariff with no FTA shared pool to fall back on. A low duty combined with an unbuffered quota means any reassessment of that duty is amplified.
V. The supplier list is re-ranking, and the sorting rule has changed
With expiry reviews, quotas, melt-and-pour and CBAM now stacked on top of one another, the origin mix of EU extra-EU cold-rolled stainless has started to move.
Comparing full-year 2025 with annualised first-half 2026: Taiwan (PoC) -62%, the China Mainland -47%, Indonesia -97%, India -21% and Thailand -9%; against South Korea +27%, South Africa +91%, Malaysia +19%, Turkey +10%, Vietnam +6% and Japan +50%.
Set that table against each origin's trade-defence status and quota track, and the pattern is clean.
Every origin in the declining group is directly covered by anti-dumping or countervailing measures. The China Mainland, Taiwan (PoC), India and Indonesia are precisely the four respondents in the two expiry reviews.
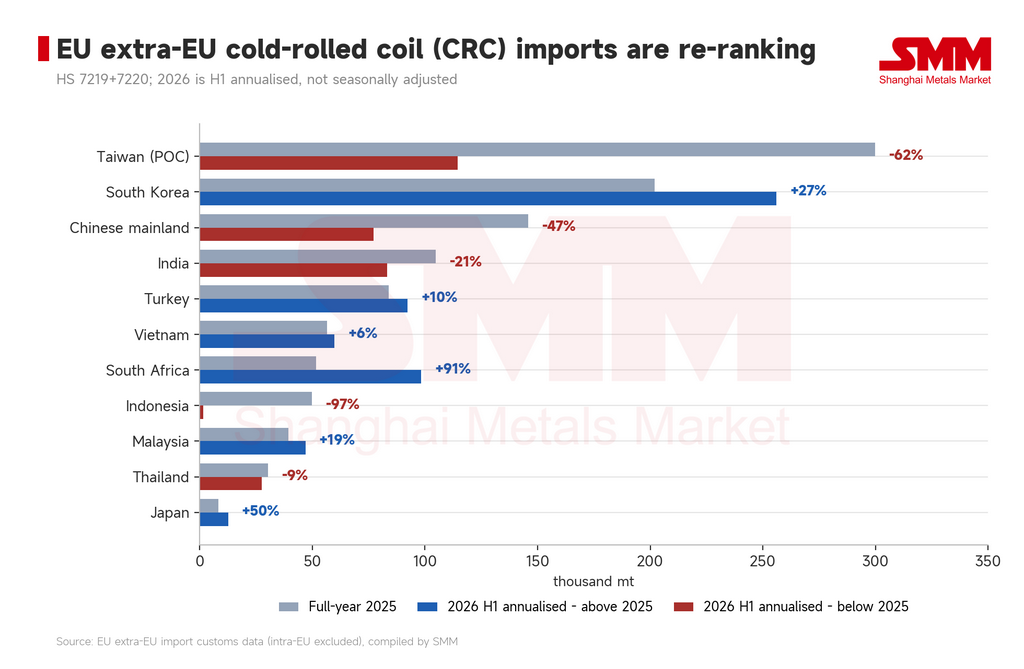
The rising group shares one of two features: a dual-track FTA quota, or no trade-defence coverage at all. South Korea sits on the FTA track with the most complete quota structure and posts the largest absolute gain. South Africa has an FTA component underneath it and nearly doubled. Japan grew fastest from a small base.
One counter-intuitive reading deserves to be pulled out. Turkey and Vietnam did not fall — they grew. Both were brought under the 2024 anti-circumvention extension and should have been the most visibly suppressed, yet their first-half 2026 shipments rose 10% and 6% respectively. The likely explanation is that anti-circumvention targets origin evasion, while their growth is coming from compliant supply: slab sourced from origins other than Indonesia, including from outside the EU, and supply chains rebuilt around it. If that reading holds, then once melt-and-pour evidence takes effect, these two markets become the most direct test of whether compliant re-rolling actually works as a model.
A caveat on method is necessary. The first-half 2026 annualisation is a simple doubling with no seasonal adjustment. EU stainless imports often front-load into the quarters when quota windows open, so the annualised figure overstates any origin that pushed hard for quota in the first half. What this table reports reliably is rank and direction, not absolute levels.
VI. CBAM: the bill does not really arrive until after 2029
CBAM is frequently discussed as a present-day cost. The surrender schedule shows that it is not one yet.
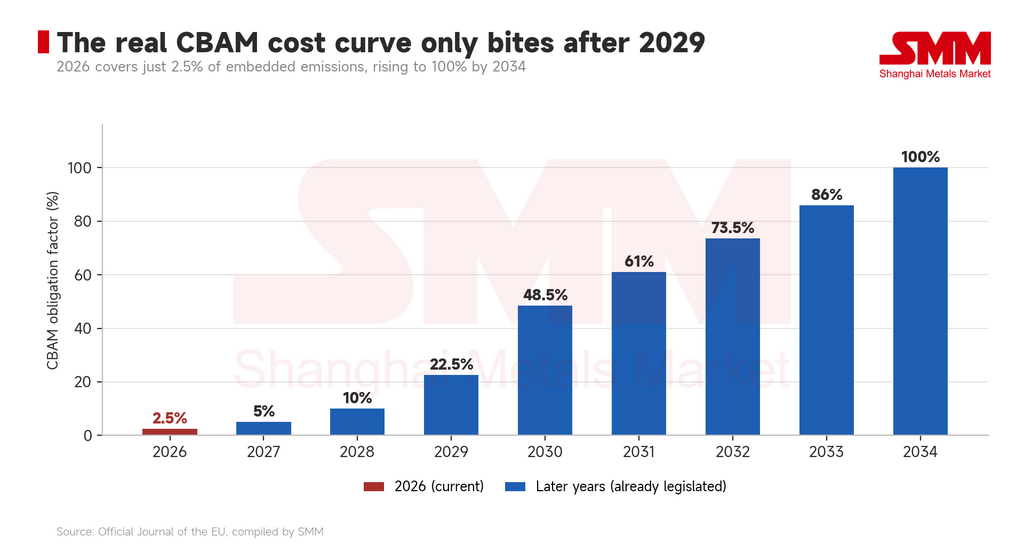
Only 2.5% of embedded emissions must be surrendered in 2026, rising to 5% in 2027 and 10% in 2028. The real inflection comes in 2029 (22.5%) and 2030 (48.5%), reaching 100% only in 2034. For the next three years, in other words, CBAM's effect on stainless trade is mainly the compliance cost of reporting and verification rather than the carbon cost itself.
That gradual curve is also the second key to understanding the slab channel. Stainless slab is among the most emissions-intensive categories in the chain, because crude steel melting is where most of the process emissions sit — and a line running on nickel pig iron (NPI) feedstock and coal-fired power is markedly more carbon-intensive than Europe's electric-arc route. At a 2.5% surrender rate, that gap is almost invisible in landed cost. At 48.5%, it becomes a difference of another order.
The slab window is therefore finite, and its expiry is already on a published timetable. Before 2029, the tariff advantage of slab far outweighs its carbon disadvantage. After 2030, the two begin to cancel each other out.
The position adopted by the European Parliament on 15th September makes extending CBAM to downstream steel-containing goods a priority; EUROFER has separately proposed an amendment bringing ferroalloys, including ferronickel and NPI, into scope. Both remain positions rather than law. But they point the same way: the stages not currently covered are being named one by one. The gap in the stainless chain — upstream excluded, downstream excluded, only the middle counted — is being filled systematically. That process and the exemption slab enjoys today are two ends of the same story.
VII. India's quota: one agreement, two numbers in circulation
In mid-September the steel quota arrangement under the India–EU free trade agreement entered public discussion, and two sets of figures appeared that do not reconcile.
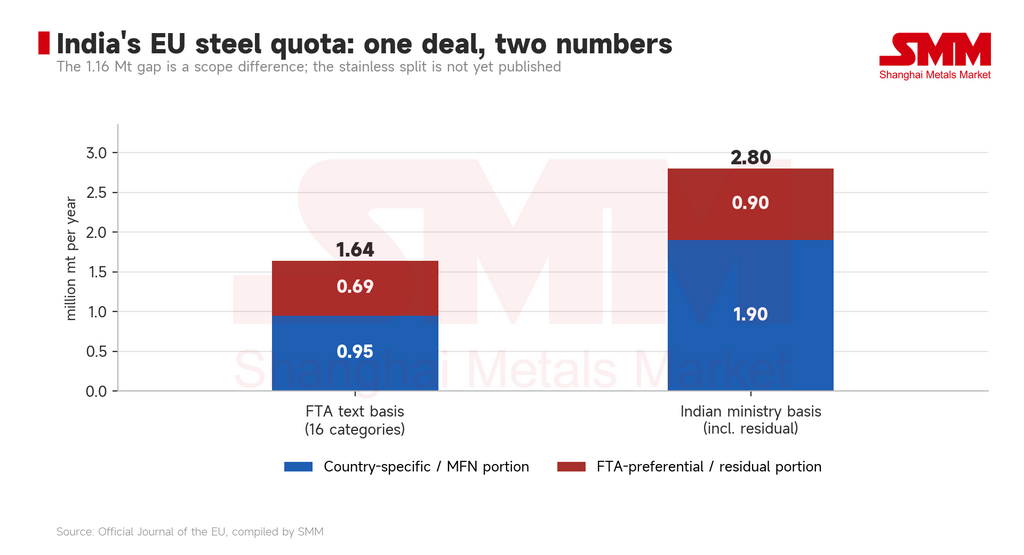
On the agreement-text basis, the annual quota is 1.64 million mt across 16 categories, split into 950,000 mt on MFN terms and 690,000 mt on FTA-preferential terms. On the basis given by India's Ministry of Commerce and Industry on 17 September, it is 1.9 million mt country-specific plus 900,000 mt residual, for a total of 2.8 million mt.
The gap is 1.16 million mt, and it comes from where each definition draws its boundary. The ministry's figure includes the share of the residual ("other countries") pool that India could compete for; the agreement text counts only the country-specific allocation. The residual pool is competitive and first-come, first-served, so theoretical availability is not the same as realised volume. Both numbers are defensible. They are simply answers to different questions.
For stainless specifically, the more important point is that neither figure has been broken down by product category. Whether the total is 1.64 million mt or 2.8 million mt, no official text yet says how much of it falls to stainless CRC, bar, wire rod or seamless tube. Until that split is published, any calculation converting the headline quota into stainless opportunity rests on nothing.
The direction, however, is clear. India carries the highest duty rate of the four economies under review (56.7%) while also holding the strongest quota position in long products and tube, on the dual FTA track. Once the FTA takes effect, India will sit in two states at once: finished CRC held down by heavy duties, and long products and tube running on ample quota with a shared pool underneath. How it allocates capacity between those two will determine actual flows far more than whether the headline number is 1.64 or 2.8 million mt.
VIII. Everything still to come already has a date on it
The feature of this policy round that matters most to companies is that it is not a single event. It is a schedule that has already been set.
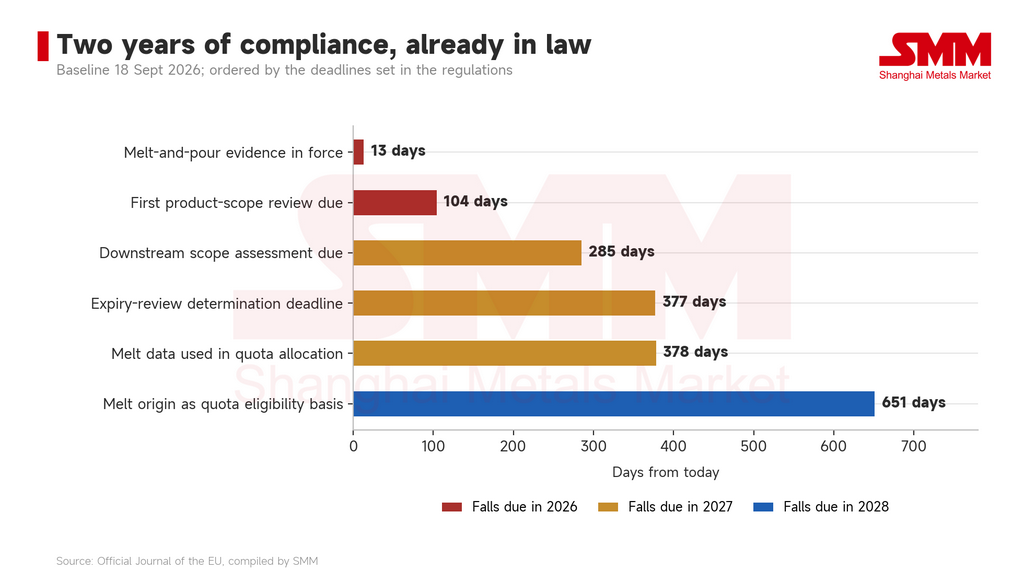
Counting from today: the melt-and-pour evidence obligation takes effect in 13 days; the first product-scope review is due in 104 days; the assessment of whether to bring downstream steel-containing goods into scope is due in 285 days; the statutory deadline for determinations in the two expiry reviews falls at 377 days; melt-and-pour data is expected to be used more actively in quota allocation from 378 days; and at 651 days the Commission must assess whether to establish melt origin formally as the basis of quota eligibility.
Lay that timeline over the slab channel and the central judgement of this analysis follows: slab's exemption today is not a settled arrangement. It is an item that has not yet been dealt with.
Three reasons support that. First, the entire legislative logic of the melt-and-pour rule is to trace steel back to where it was first melted — and slab is the first solid form that molten steel takes. The rule's internal logic and slab's exemption are in direct tension, and that tension will eventually be resolved. Second, the product-scope review due before 31st December 2026 and the downstream assessment due before 30th June 2027 are both mandatory exercises; slab entering the discussion is a question of timing, not of whether. Third, the CBAM surrender rate climbs steeply after 2029, eroding slab's arbitrage from the cost side without requiring any new legislation at all.
The channel is open. But the legal instrument and the timetable for closing it already exist.
IX. What this means for each major exporter
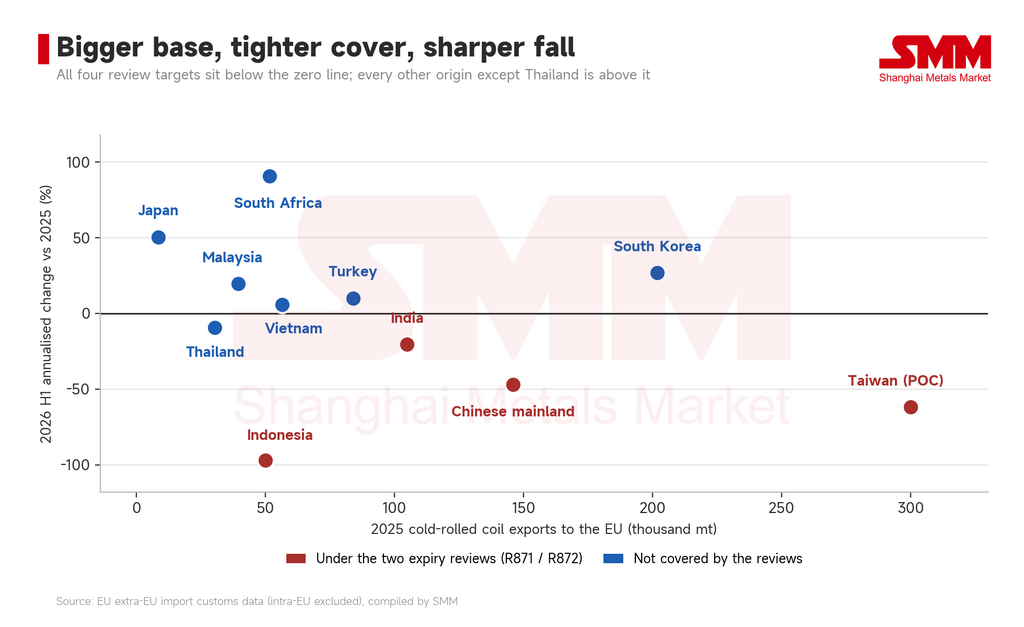
Plotting all eleven origins against two axes — volume shipped to the EU in 2025, and annualised change in 2026 — produces a distribution that is anything but random. All four origins under expiry review fall below the zero line, and the larger the base, the deeper the fall. Every origin not under review sits above it, with the single exception of Thailand, whose -9% is close to flat and does not undercut the pattern.
Indonesia. Zero finished shipments is now a settled outcome, slab is the only open front door, and Indonesia has taken first place in EU extra-EU slab supply. The real risk is not this year; it lies where the product-scope review and the CBAM ramp intersect. Share won through slab is share with an expiry date attached, not a stable structure. There is a second exposure as well: once melt origin governs quota attribution, Indonesian steel re-rolled in a third country will be counted back against Indonesia, narrowing the indirect route at the same time. On the finished side Indonesia faces not one closing door but two.
Taiwan (PoC). The largest extra-EU source of CRC, yet already down 62% on an annualised basis, and simultaneously subject to an expiry review, a single-track MFN quota, and a continuing obligation to demonstrate it has not materially increased purchases of Indonesian-origin material under its anti-circumvention exemption. It carries the most concentrated exposure of this round: the largest volume at stake and the least room to absorb a shock.
Chinese mainland. CRC shipments to the EU are down 47% annualised. Like Taiwan (PoC) it runs on the single MFN track and, under the quota rules, may not draw on the residual allocation. With duties rolled over, the predictability of the direct finished route falls further, and the incentive to shift export weight toward markets with looser quota structures persists.
South Korea. The strongest position in this round. It has domestic crude stainless melting capacity, so melt-and-pour evidence presents no technical obstacle; its quota runs on the dual FTA track with a shared pool available once the country allocation is exhausted; and it is a respondent in neither review. Up 27% annualised and the largest absolute gain — a position with structural support behind it.
South Africa, Japan and Malaysia. What these three share is the absence of trade-defence coverage. South Africa is up 91% annualised, Japan 50% and Malaysia 19%, and the growth looks more like substitution filling a vacated space than genuine demand. Malaysia warrants a separate flag: its cold-rolling sector is a pure finishing operation, with hot-rolled coil and slab bought in. From 1 October, every consignment to the EU must be traceable to an upstream melting furnace, and that obligation is continuous and applies consignment by consignment. Whether Malaysia's growth holds depends on whether its feedstock can settle reliably on origins it can document.
Turkey and Vietnam. Both fall under the anti-circumvention extension, yet both grew modestly in the first half of 2026. They are the test case for whether compliant re-rolling works. If growth continues after melt-and-pour takes effect, the non-Indonesian feedstock alternative has been proven out. If it turns down, the compliance cost of the re-rolling model exceeds its processing margin. Fourth-quarter data will settle it.
India. The only market holding both extremes at once: the highest duty rate and the most generous long-product quota. Where its material actually goes depends on the category split — which has not been published.
Closing
Seen together, the four events of that week are facets of a single thing.
Everything the EU has built around stainless over three years — anti-dumping, countervailing duties, anti-circumvention, quota cuts, the 50% out-of-quota tariff, melt-and-pour, CBAM — acts with precision on one stage: the cross-border movement of rolled finished product. The melting stage, which is to say slab, has never really been brought in.
The outcome was predictable. When one road has six checkpoints and the other has none, cargo does not stop. It changes roads. Indonesia's 71x is the quantified result of that change. Some 343,000 mt of slab entered European rolling mills and came out as EU-origin cold-rolled coil, while the trade statistics record Indonesian finished exports to the EU as effectively nil.
Did the policy work? If the objective was to keep Indonesian-origin finished stainless out of Europe, it worked. If the objective was to keep Indonesian steel out of Europe, the steel simply arrived in a different form.
That distinction is exactly what the next two years of policy will have to resolve. The product-scope review at the end of 2026, the downstream assessment in 2027 and the quota-eligibility assessment in 2028 all circle the same question: is the EU protecting the rolling mill, or the furnace?
For exporters, the preparation required does not depend on the answer. The slab channel is open today, but the legal instrument and the dates for closing it already exist. Map the full document chain from heat to export now, and re-rank feedstock by what can be documented rather than by what is cheapest. Neither will turn out to have been the wrong move, whichever way the answer goes.
The four days in September changed no duty rate in force. What they did was put the next two years into the calendar all at once.
![[SMM Analysis] Downstream Maintains Cautious Purchasing, Intermediate Product Payables in the Doldrums This Week](https://imgqn.smm.cn/usercenter/CWsEw20251217171732.jpeg)