With the EU Carbon Border Adjustment Mechanism (CBAM) entering its definitive phase in 2026, assessing carbon-related differences in aluminium flat-rolled procurement requires product classification, origin-specific default values, free-allocation adjustments and trade volumes to be considered together. Extending the framework used in SMM's earlier research on HS7601 unwrought aluminium and HS7604 extrusions, this analysis finds that Türkiye is the EU's largest external supplier of HS7606. China, however, has greater total theoretical certificate exposure when the same 2026 default-value rules are applied to both countries. Serbia illustrates why a secondary-aluminium route designation in the default tables does not necessarily imply lower net exposure per tonne.
Applying the 2026 rules to the full-year 2025 trade structure produces approximately 1.5250 million tonnes CO₂e of theoretical certificate exposure for identifiable origins within CBAM's scope. China, Türkiye, Serbia, Egypt and the United Kingdom account for 78.6% of that total. These figures represent a benchmark-adjusted certificate scenario, not measured producer emissions or actual obligations arising in 2025.
Imports increased 11.7% in 2025, with can body stock contributing around half the increase
SMM calculations using Eurostat data show that EU27 extra-EU imports of HS7606 rose from approximately 969.64 kt in 2024 to 1,083.26 kt in 2025, an increase of 11.7%. Import value increased 12.4%, from €3.495 billion to €3.929 billion. Customs value divided by weight averaged approximately €3,627/t, up 0.6%. This is a statistical unit value across different specifications and origins, not a transaction price for a consistent grade of flat-rolled product.
HS7606 covers aluminium plates, sheets and strip exceeding 0.2 mm in thickness, but its product composition is diverse. In 2025, imports under CN76061292, other rectangular aluminium-alloy sheet and strip in the thinner thickness band, reached approximately 309.29 kt, or 28.6% of the HS7606 total. Other rectangular non-alloy thin sheet and strip under CN76061191 accounted for 176.23 kt, or 16.3%; thicker rectangular alloy products under CN76061299 for 160.63 kt, or 14.8%; and beverage can body stock under CN76061211 for 135.47 kt, or 12.5%. Together, these four categories represented approximately 72.2% of imports.
Can body stock imports increased from 77.72 kt in 2024 to 135.47 kt in 2025, up 74.3%. The increase of approximately 57.75 kt accounted for 50.8% of the net expansion in HS7606 imports. CN76061292 imports, by comparison, increased 8.6%. Import growth was therefore concentrated in particular products and cannot be interpreted as uniformly stronger demand across all flat-rolled categories.
For CBAM calculations, HS7606 differs from the HS7604 categories examined previously. A line-by-line check of the 14 eight-digit HS7606 codes in the 2026 nomenclature shows that they share the same current column-B default-pathway benchmarks: 1.485 tCO₂e/t for route K and 0.148 tCO₂e/t for route L. This permits HS7606 volumes to be aggregated for a given origin and year under the default-value scenario. It does not make their specifications, prices, production processes or customer qualifications interchangeable.
Exempt origins account for around 30% of external imports
In 2025, EU27 imports from Türkiye reached approximately 221.48 kt, up 9.0%, representing 20.4% of extra-EU supply. Switzerland supplied 206.11 kt, or 19.0%; China 123.15 kt, or 11.4%; Norway 122.74 kt, or 11.3%; and the United Kingdom 102.08 kt, or 9.4%.
Goods originating in Switzerland, Norway, Iceland and Liechtenstein fall outside CBAM's scope. Keeping exempt origins in the trade totals while excluding them from certificate calculations leaves approximately 328.90 kt of exempt supply, or 30.4% of 2025 imports, and 751.76 kt from identifiable covered origins, or 69.4%. A further 2,609 tonnes, or 0.24%, were reported under unspecified extra-EU countries and territories. These remain in the import total but are not assigned an origin-specific default value.
An origin exemption does not mean that measured product emissions are zero. Nor does routing third-country-origin goods through Switzerland or another exempt location automatically confer an exemption. Procurement assessments need to establish origin, rather than relying solely on the seller's address or port of dispatch.
Exposure per tonne depends on both the default value and its corresponding benchmark
This analysis uses the base default values corrected by Regulation 2026/1740 and a uniform 2026 production scenario:
Theoretical certificates per tonne = max[base default value × 1.10 − corresponding column-B benchmark × 0.975 × 1, 0].
The 10% uplift is the 2026 mark-up for aluminium defaults, 0.975 is the 2026 CBAM factor, and the cross-sectoral correction factor is 1. Routes K and L denote the primary- and secondary-aluminium routes specified in the default tables. The resulting free-allocation adjustments are 1.447875 and 0.144300 tCO₂e/t respectively. The 97.5% factor applies to the benchmark; it does not mean that only 2.5% of all embedded emissions creates certificate exposure.
The following comparison combines 2025 trade volumes with these same 2026 parameters. It deducts the benchmark adjustment but excludes foreign carbon-price deductions and importer-level threshold screening.
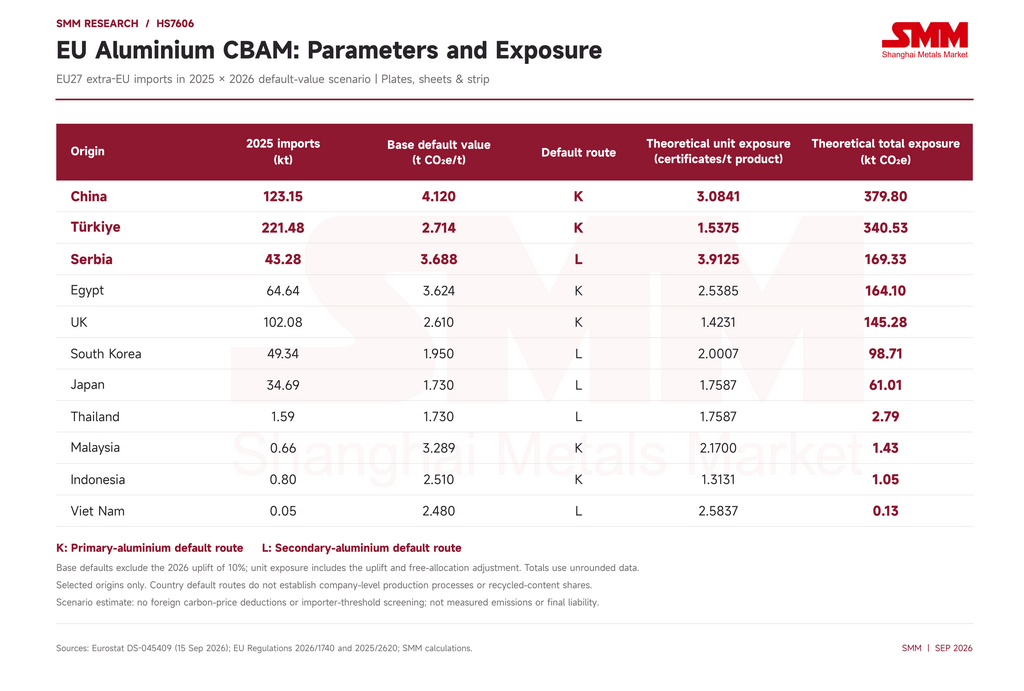 Note: Certificates per tonne are numerically equivalent to tCO₂e/t of product. Total exposure uses unrounded inputs. The table compares selected origins and is not a complete ranking by unit exposure. Sources: Eurostat, EU regulations and SMM calculations.
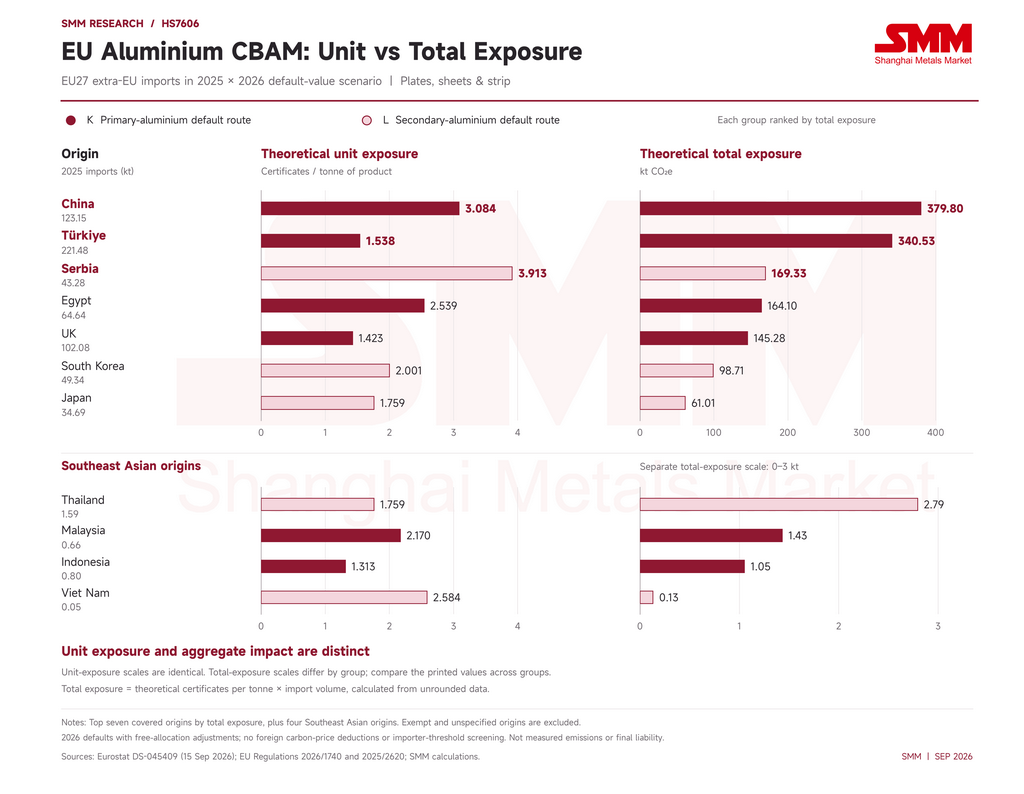
China's unit exposure is approximately twice Türkiye's, reversing the volume ranking
China supplied approximately 55.6% of Türkiye's 2025 volume, but its unit exposure of 3.0841 certificates/t was 2.01 times Türkiye's 1.5375. Combining volume and intensity gives China approximately 379.80 kt CO₂e of total exposure, 11.5% above Türkiye's 340.53 kt. China represented 11.4% of extra-EU import volume but 24.9% of theoretical exposure from identifiable covered origins. Türkiye accounted for 22.3% of exposure.
This differs from the earlier analysis of the main HS7604 extrusion categories, in which Türkiye's much larger supply volume dominated aggregate exposure. In HS7606, China's trade scale is sufficient for its higher default unit exposure to produce the largest national total. Türkiye remains important for procurement volume and supply continuity, while the difference between verified supplier data and Chinese defaults merits particular attention in importers' certificate budgets.
The United Kingdom shows another configuration: it supplied approximately 102.08 kt in 2025, but its unit exposure of 1.4231 was below those of China, Egypt and Serbia, yielding approximately 145.28 kt CO₂e in total. Large procurement volumes and high unit carbon costs are separate dimensions; neither a default-value ranking nor a volume ranking alone captures the overall effect.
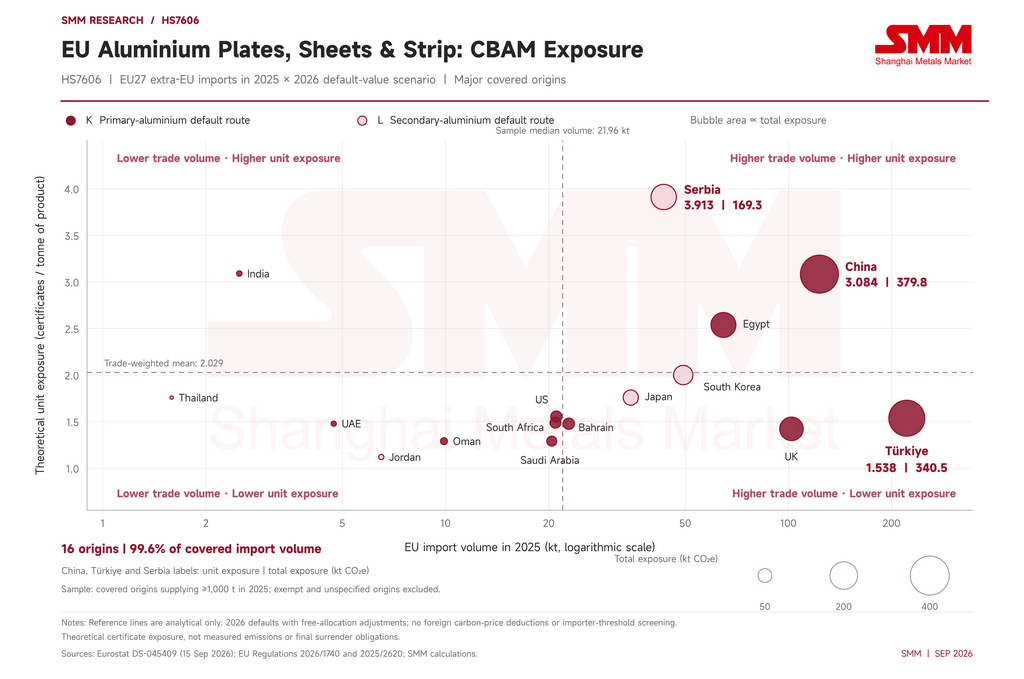 Serbia and Viet Nam show why a lower base default can still produce higher net exposure
Serbia's base default of 3.688 is below China's 4.120. However, Serbia is assigned route L, whose benchmark adjustment is much smaller than route K's. Its resulting unit exposure is 3.9125 certificates/t, above China's 3.0841. Applied to approximately 43.28 kt of 2025 trade, this produces 169.33 kt CO₂e of total exposure, more than Egypt or the United Kingdom despite their larger volumes and places Serbia third.
The route composition also differs from the earlier HS7601 analysis. For HS7606 in 2025, default route K represented 81.9% of covered import volume and 77.7% of exposure, while route L represented 18.1% of volume and 22.3% of exposure. Route L is therefore not a uniformly low-exposure category. A national default-route designation also cannot establish the actual recycled content used by a particular rolling mill.
The Southeast Asian comparison reinforces this point. Viet Nam's base default of 2.480 is slightly below Indonesia's 2.510, but their net exposures are 2.5837 and 1.3131 certificates/t respectively. Viet Nam's result is nearly twice Indonesia's. Malaysia stands at 2.1700 and Thailand at 1.7587. Both default emissions and route-specific benchmark deductions drive these differences.
Trade scale nevertheless limits these origins' current contribution to the EU total. Viet Nam supplied only about 50 tonnes of HS7606 in 2025. Its volume increased to 331 tonnes in the first half of 2026, from approximately 15 tonnes a year earlier, but still represented just 0.064% of EU extra-EU imports. Growth from such a small base does not establish Viet Nam as a major substitute supplier to the European flat-rolled market. Developments in HS7604 extrusions cannot simply be carried across to HS7606.
 First-half 2026 imports fell 7.8%, while theoretical exposure fell 16.9%
EU27 extra-EU imports of HS7606 totalled approximately 517.07 kt in January–June 2026, down 7.8% from 560.63 kt a year earlier. Import value was broadly unchanged at €2.090 billion, while the customs unit value increased 8.3% to €4,042/t. Changes in product and origin composition mean that this cannot, on its own, establish an 8.3% price increase for a consistent specification.
Supplier performance diverged. Türkiye supplied approximately 103.90 kt, down 4.0%; China 48.60 kt, down 37.5%; the United Kingdom 45.30 kt, down 9.2%; Egypt 27.74 kt, down 11.2%; Serbia 17.72 kt, down 26.5%; and South Korea 7.64 kt, down 56.0%. Japan, meanwhile, increased supply 64.2% to approximately 24.38 kt, while Oman rose from around 2,390 tonnes to 13.38 kt.
Holding the 2026 default rules constant across both periods, covered-origin volume declined 11.6%, from 385.52 kt to 340.88 kt. Trade-weighted unit exposure declined 6.0%, from 2.084 to 1.959 certificates/t. Total exposure consequently fell 16.9%, from 803.41 kt CO₂e to 667.66 kt. Exempt origins' share of extra-EU imports increased from approximately 31.0% to 33.9%.
A sequential decomposition, first holding the first-half 2025 weighted unit exposure constant, then changing the origin mix attributes approximately 93.02 kt CO₂e of the 135.75 kt decline to lower covered import volumes, and 42.73 kt to changes in the supplier mix. These account for 68.5% and 31.5% of the decline respectively. Lower Chinese volumes reduced exposure by approximately 90.00 kt CO₂e, equivalent to 66.3% of the net decline, while increased supplies from Japan and Oman offset part of the reduction.
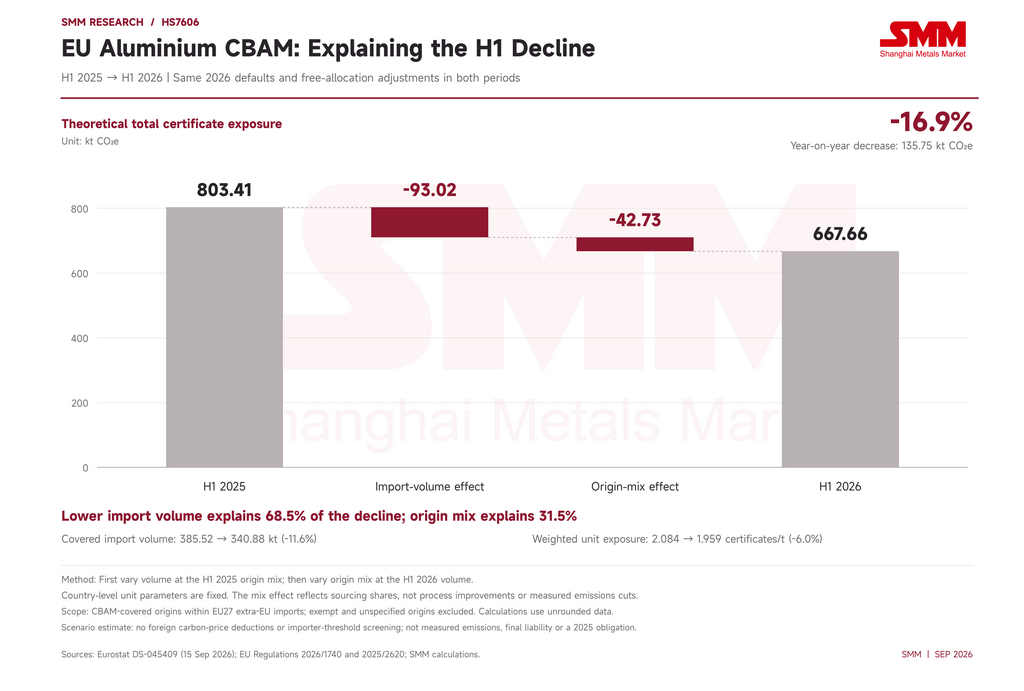 The lower weighted unit exposure is a trade-composition effect under fixed national parameters, not evidence of lower measured factory emissions. Nor do these trade figures establish CBAM as the cause of the changes: demand, specifications, existing trade measures, prices and supplier decisions can all affect procurement.
Certificate prices translate exposure differences into procurement cost scenarios
Using the official second-quarter 2026 certificate price of €75.28 as a common illustration, default-based costs per tonne of HS7606 are approximately €232.17 for China, €115.74 for Türkiye, €294.53 for Serbia, €191.10 for Egypt, €107.13 for the United Kingdom, €150.61 for South Korea, €132.39 for Japan and Thailand, €163.36 for Malaysia, €98.85 for Indonesia and €194.50 for Viet Nam.
This compares the same quarter and calculation pathway. It excludes applicable foreign carbon-price deductions, importer thresholds, verification expenses and other commercial costs. It is not a third-quarter 2026 price estimate. Certificate prices for 2026 depend on the import quarter, so the second-quarter price cannot be treated as the settlement price for every period.
Competitiveness ultimately depends on precursors and verifiable actual data
National defaults are not measured plant carbon intensities. For flat-rolled producers, actual-emissions calculations extend beyond the rolling operation to relevant aluminium precursors and their corresponding embedded free allocation. Under the actual-data pathway, the complex-goods method must account for the process and precursors. It would be incorrect to subtract only the 0.056 processing benchmark from the complete product's actual emissions, or mechanically apply the default-pathway column-B benchmark as the full actual-pathway adjustment.
Current aluminium CBAM calculations cover the relevant direct emissions, including PFC emissions embedded in relevant primary-aluminium precursors. Indirect electricity emissions are not currently included in this aluminium certificate boundary. Low-carbon electricity or a lower full life-cycle footprint therefore cannot be converted directly, tonne for tonne, into certificate savings under this analysis. Secondary production can still involve fuel combustion and externally sourced precursors; it does not automatically imply zero emissions or zero cost.
EU purchasers should assess the substantial certificate budgets associated with Chinese and Turkish volumes, Serbia's relatively high default unit exposure despite its L-route designation, and the combination of product suitability, supply scale and emissions-data quality offered by Japanese, Korean and Southeast Asian suppliers. Compliant verified actual emissions and precursor information could produce results materially different from national defaults. Any cost reduction must be assessed by calculating both actual emissions and the corresponding actual-pathway free allocation.
CBAM competitiveness in HS7606 therefore reflects trade scale, unit exposure and data capability together. Higher-default origins have a stronger incentive to establish verifiable supplier data, while lower-default origins cannot promise a final cost advantage on a national label alone.