September 7, 2026
As of September 4, 2026, by Florian Grummes
Back in June and especially in July, we had repeatedly and emphatically pointed out the emerging bottoming process in precious metals and clearly stated our expectation of an imminent summer rally. Indeed, starting on August 3, the price of gold embarked on a frenetic, three-week upward move that drove prices from $4,020 to $4,697 in a very short time.
Starting from the early-summer low of the five-month correction at $3,942 on June 30, the price of gold thus rebounded by 19.15% and was able to regain a significant portion of the ground it had previously lost. The silver price did not reach its early-summer low until July 17 at $54.74, but recovered to $71.16 in August, gaining around 30% at its peak.
Yen Rally and Treasury Intervention: Bessent’s Dual Strategy
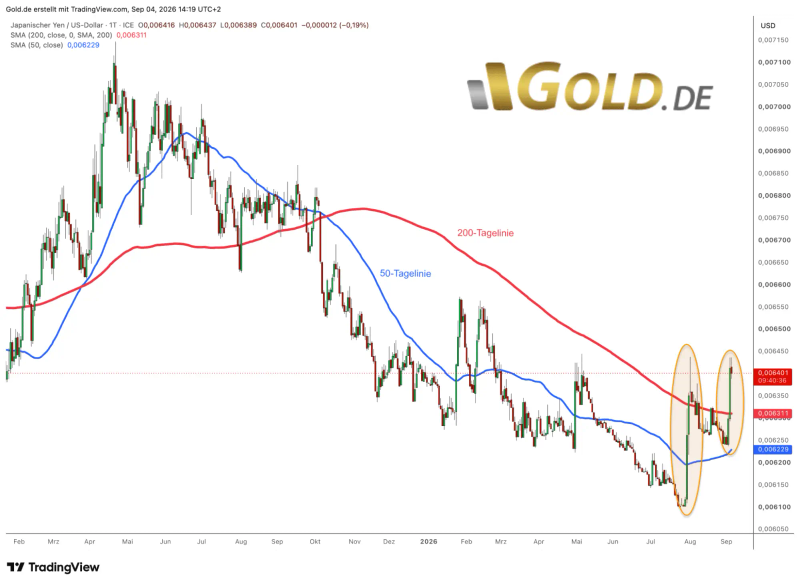
Yen vs. U.S. Dollar, daily chart as of September 4, 2026. © GOLD.DE
Fundamentally, the rally was triggered by U.S. Treasury Secretary Scott Bessent’s intervention in the foreign exchange market in late July, when he intervened in the yen exchange rate on behalf of the Japanese Ministry of Finance. The yen subsequently rose sharply within a few days, corrected this steep rise in August, and has been climbing significantly again since Wednesday.
Within a month, the yen has thus gained over 5% against the U.S. dollar. This is significant in that Japanese institutions will likely now review their foreign investments in bonds and stocks, and carry traders who had purchased U.S. Treasury bills may be forced to sell in order to cover their yen short positions. This, in turn, poses a challenge to demand for T-bills, which can only be sustained by a Fed rate hike to preserve the yield spread relative to global markets. Competition for international capital investments has thus intensified further.
At the same time, U.S. Treasury Secretary Scott Bessent had to respond to the unexpectedly sharp rise in yields on long-term U.S. Treasury bonds (the 30-year yield had at times reached a 19-year high) in mid-August 2026. He unexpectedly announced the expansion of the Treasury buyback programs: Buybacks of 10-, 20-, and 30-year securities were doubled to at least $4 billion per operation, though Bessent explicitly left open the possibility that volumes could rise even further. The goal was not to enforce a specific yield level—which he described as beyond his control—but rather to prevent “disorderly moves” and stabilize market liquidity during a period of thin summer trading volumes. The measures, scheduled to begin on September 10, were interpreted as “Operation Twist light” and sparked a debate: While Bessent emphasized that he was not conducting monetary policy but merely ensuring the functioning of the bond market, critics such as Stanley Druckenmiller warned against crossing a dangerous line and called instead for a consolidated fiscal policy.
Is the Dollar at a Tipping Point? Seven Warning Signs—and a Controversial Strategy
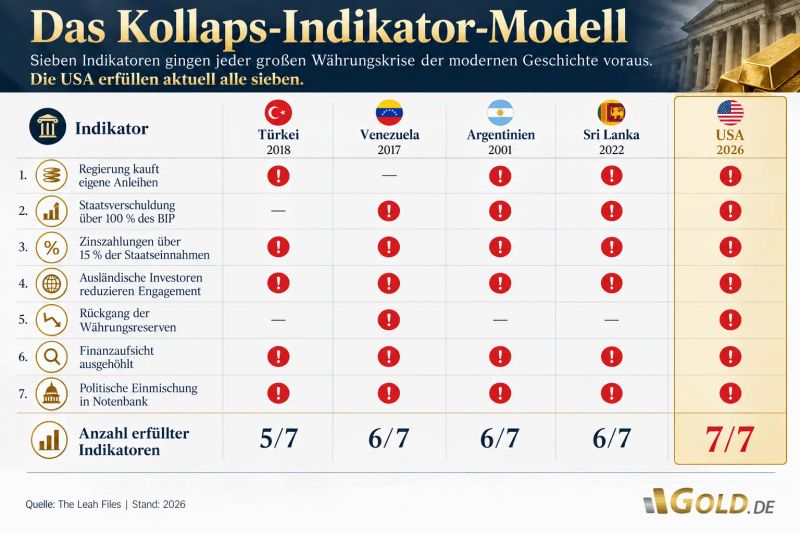
The Collapse Indicator Model. © The Leah Files
Scott Bessent appears to be deliberately steering the U.S. dollar toward the abyss. According to seven historical indicators of currency collapse, the dollar now exhibits all seven warning signs—triggered by Bessent’s latest measures.
No country in modern history has ever met all seven criteria and avoided a collapse.
But unlike in previous crises, this does not seem like an unfortunate coincidence, but rather a deliberate act—by those who are actually supposed to prevent exactly that, but who are now profiting from it themselves.
Despite this very positive momentum for precious metals, however, gold bulls had to take a brief breather starting on August 24 following the breathtaking rally. Christopher Warsh’s cleverly hawkish remarks at the central bankers’ meeting in Jackson Hole triggered a sharp pullback down to $4,282.
At the start of the week, fears of significant interest rate hikes suddenly dominated market sentiment once again. Moreover, volatility is enormous: a $700 upward move in three weeks, followed by a $400 downward move in just one week.
Nevertheless, the gold price remained unfazed by the Fed’s targeted skirmish and, starting Tuesday, rebounded significantly from $4,282 to $4,510.
Thus, the summer rally remains intact.
Gold Has Its Sights Set on the 200-Day Moving Average Once Again
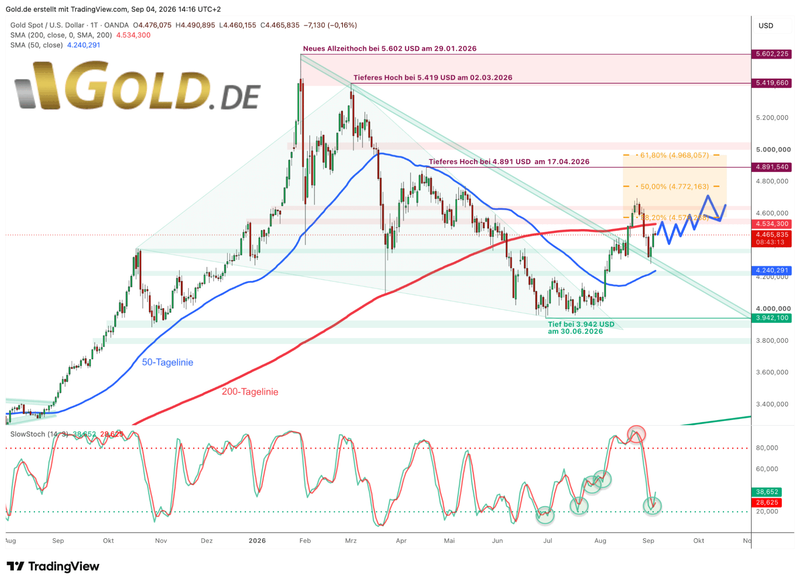
Gold in U.S. dollars, daily chart as of September 4, 2026. © GOLD.DE
As is so often the case, the expected summer rally in precious metals began almost immediately as the summer vacation season kicked off. In just three weeks, the price of gold shot up from around $4,020 to $4,697. Our deliberately conservative minimum target of $4,500 was thus reached and surpassed in no time at all.
We had chosen this price target conservatively and emphasized that we initially wanted to wait and see how the summer rally would unfold. In retrospect, the rise appears less like a sustained climb along a “wall of worry” and more like a panic-driven short squeeze.
Accordingly, last week’s sharp pullback from the high of $4,697 came as no surprise. Although gold had briefly and significantly exceeded its 200-day moving average (currently $4,534) in August, this key moving average offered little support once selling pressure intensified in the wake of the Jackson Hole symposium.
Despite enormous volatility, buyers are returning immediately
After the gold price fell by about $400 within a week, buyers have been returning in a massive and sustained manner since Tuesday. This has significantly increased the likelihood that the sharp pullback was merely a healthy “breather”—especially since it ended at $4,282, exactly at the former resistance level, which now serves as solid support in the range between $4,280 and $4,320. The rising 50-day moving average ($4,240), on the other hand, was not tested.
Technically, the daily stochastic oscillator now presents a promising picture. The oscillator has turned upward again just above the oversold zone and triggered a new buy signal. This suggests a good chance that the gold price will test its 200-day moving average again and may even reach the $4,700 range in the coming weeks.
In the bigger picture, however, the pattern of lower highs remains intact. For September, we therefore expect the gold price to primarily oscillate between its 50- and 200-day moving averages, with the potential for a breakout toward $4,700.
September Outlook: Primarily Between the 50- and 200-Day Moving Averages
The next decisive momentum is likely to depend largely on the behavior of the stock markets.
Historically, the two months leading up to the U.S. midterm elections tend to be marked by increased uncertainty and pullbacks in the stock markets. Added to this is the “September effect”: the historical tendency of stock markets—particularly U.S. indices such as the S&P 500 and the Dow Jones—to post weaker or negative average returns in September than in other months. Over long data series, September is the only calendar month with a negative average return for the S&P 500 and also has one of the highest frequencies of negative months.
Given the already sharply heightened global uncertainty, it would therefore not be surprising if additional stress on risk assets were to spill over into precious metals as well.
At the same time, however, the Fed and the Treasury Secretary would likely be forced once again to intervene with liquidity measures.
So volatility remains!
Conclusion: Gold – The summer rally isn’t over yet!
The summer rally in precious metal prices was no coincidence. We had explained in a timely and detailed manner why sentiment in early summer was far too negative. From a fundamental perspective, this impressive recovery is the result of a carefully orchestrated macroeconomic environment: yen intervention, Treasury buybacks, high geopolitical uncertainty, and growing concerns about the stability of the U.S. dollar have collectively created a perfect storm scenario for precious metal prices.
With gold up 19% and silver up 30%, not only was lost ground regained, but a clear signal was also sent: The markets are increasingly anticipating that the traditional support mechanisms of the dollar system are reaching their limits.
The enormous volatility—a $700 upward move in three weeks, followed by a $400 downward move in one week, followed by a $240 recovery in three days—is less a sign of weakness than an indicator of the intensity of the battle for position between the bulls and bears.
The underlying trend for September remains positive, but the path upward is likely to become bumpier. Technically speaking, the rapid recovery from the low of $4,282, the new buy signal from the daily stochastic, and the successfully tested support in the $4,280 to $4,320 range all point to a continuation of the upward trend. At the same time, the “September effect,” the historical weakness of the stock markets ahead of the U.S. midterm elections, and the still-intact series of lower highs all call for caution.
The most likely scenario is primarily a sideways trend between the 50- and 200-day moving averages, with the potential for a breakout toward $4,700—provided the stock markets do not deliver any negative surprises and the Fed and Treasury remain in emergency mode.
Technical Analyst, Precious Metals Expert
Source:https://goldinvest.de/en/gold-price-heading-toward-usd4-700-why-the-rally-could-continue