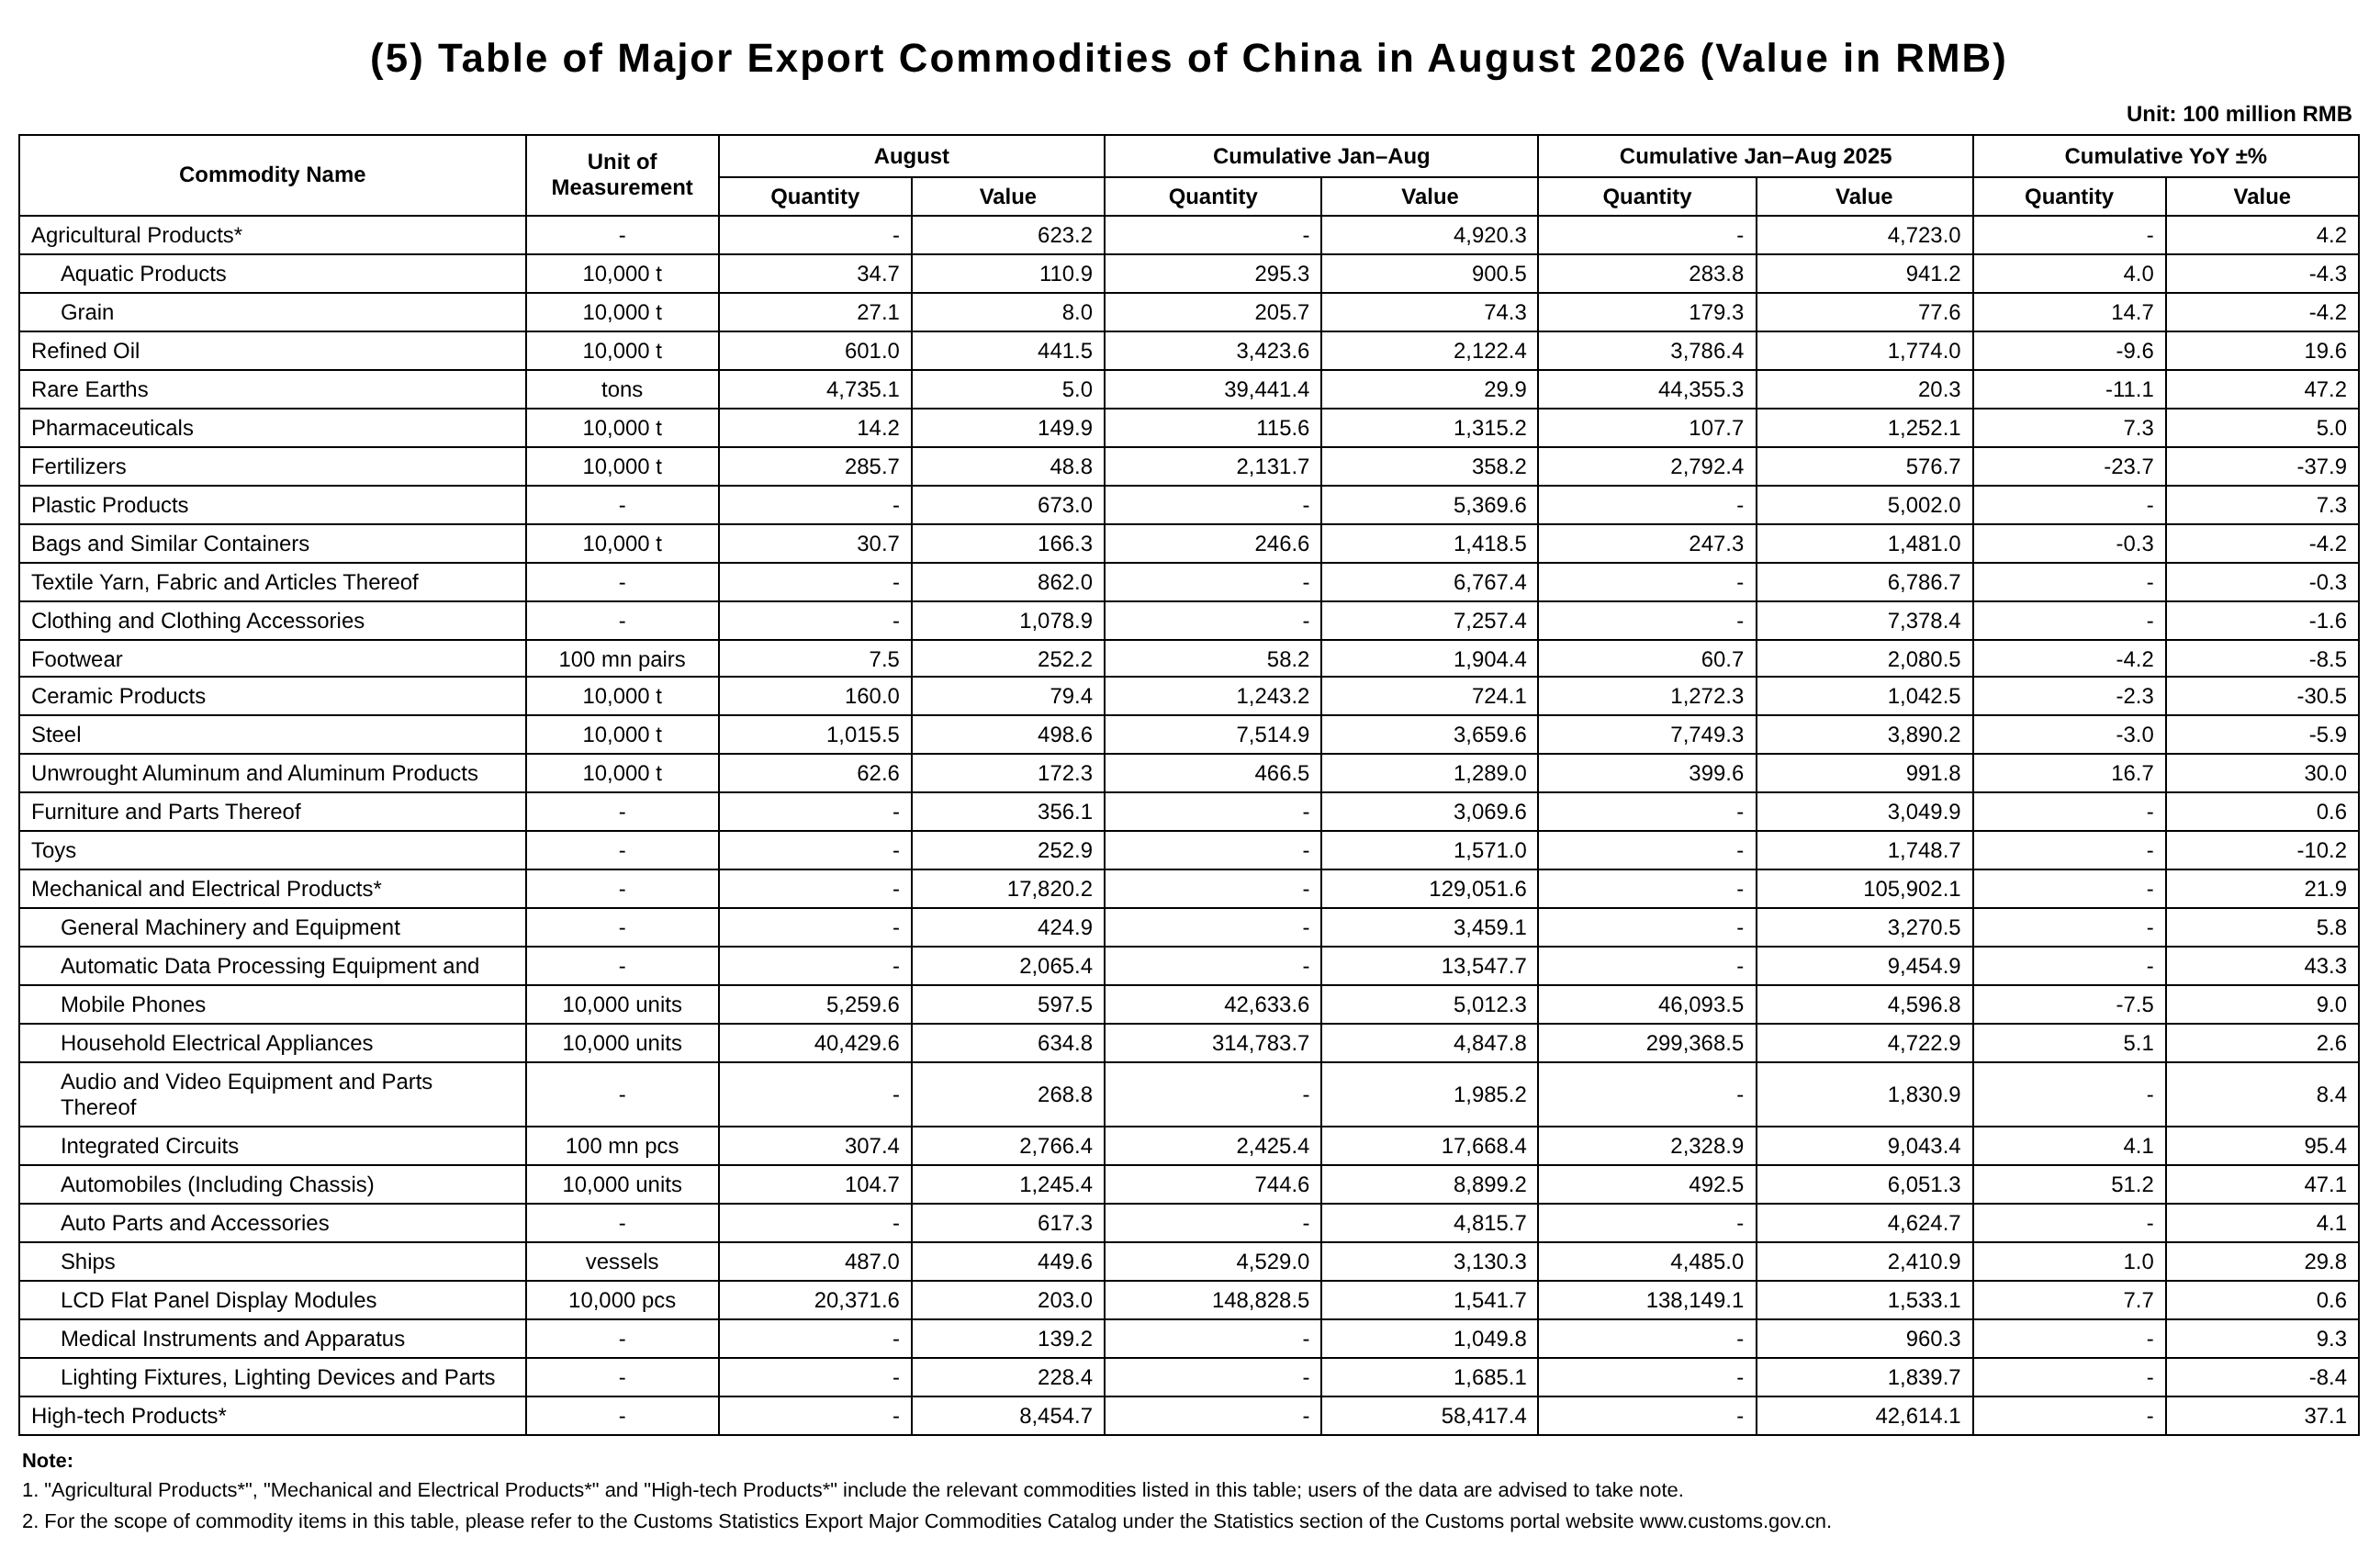
According to customs statistics, in the first eight months of 2026, China’s total imports and exports of goods trade reached 34.78 trillion yuan, up 17.6% YoY (the same hereinafter). Of this total, exports were 20.17 trillion yuan, up 14.6%; imports were 14.61 trillion yuan, up 22%. In August, China’s total imports and exports of goods trade reached 4.65 trillion yuan, up 19.8%. Of this total, exports were 2.73 trillion yuan, up 18.6%; imports were 1.92 trillion yuan, up 21.7%.
By trade mode, in the first eight months, China’s imports and exports under Ordinary Trade totaled 20.89 trillion yuan, up 10.5%; processing trade totaled 6.75 trillion yuan, up 26.4%; bonded logistics totaled 600 billion yuan, up 42.3%.
By trading partner, in the first eight months, China-ASEAN trade totaled 5.95 trillion yuan, up 20.6%; China-EU trade totaled 420 billion yuan, up 8.1%; China-US trade totaled 276 billion yuan, up 1.3%. Over the same period, China’s total imports and exports with Belt and Road partner countries amounted to 1.774 trillion yuan, up 15.9%.
By foreign trade entity, in the first eight months, private enterprises recorded imports and exports of 1.979 trillion yuan, up 17.6%; foreign-invested enterprises recorded 1.015 trillion yuan, up 18.1%; state-owned enterprises recorded 477 billion yuan, up 16.9%.
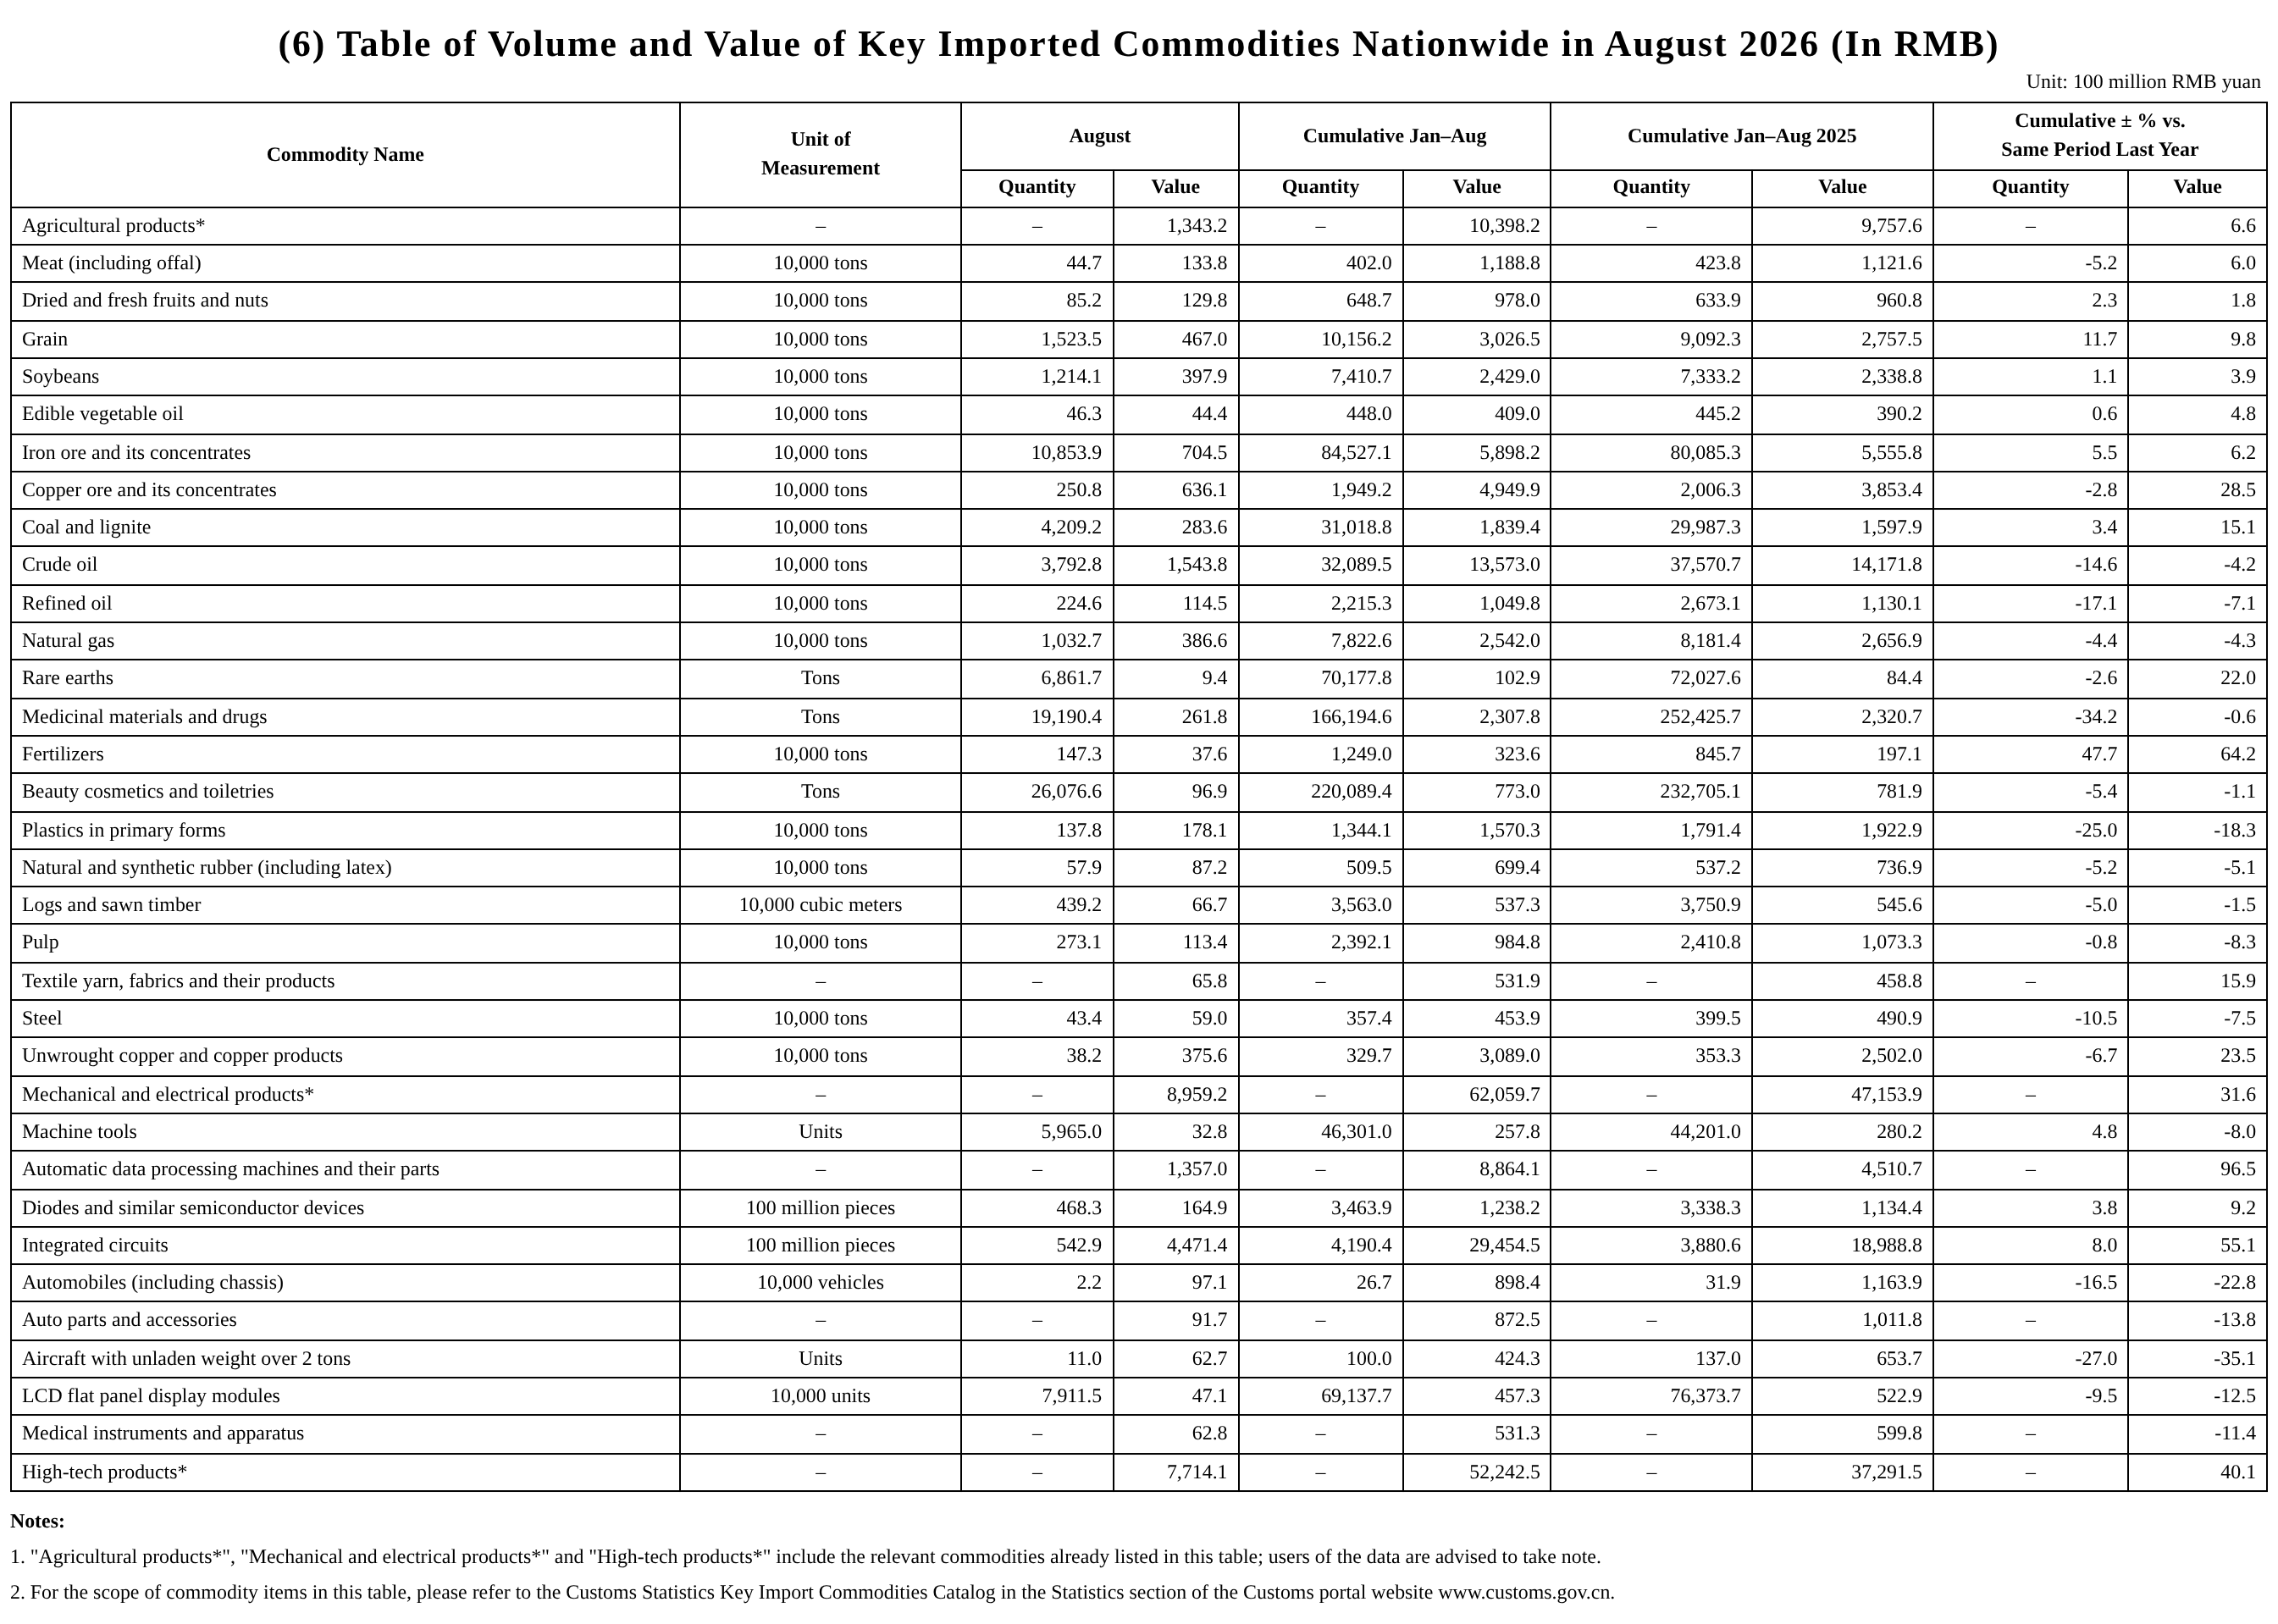
By key products, on the export side, in the first eight months, China exported mechanical and electrical products worth 1.291 trillion yuan, up 21.9%; labor-intensive products worth 274 billion yuan, down 0.6%; and agricultural products worth 492.03 billion yuan, up 4.2%. On the import side, in the first eight months, China imported mechanical and electrical products worth 621 billion yuan, up 31.6%; crude oil of 321 million mt, down 14.6%; and agricultural products worth 104 billion yuan, up 6.6%.
Based on data released by the General Administration of Customs, SMM compiled the import and export performance of selected products in the metals industry, as follows:
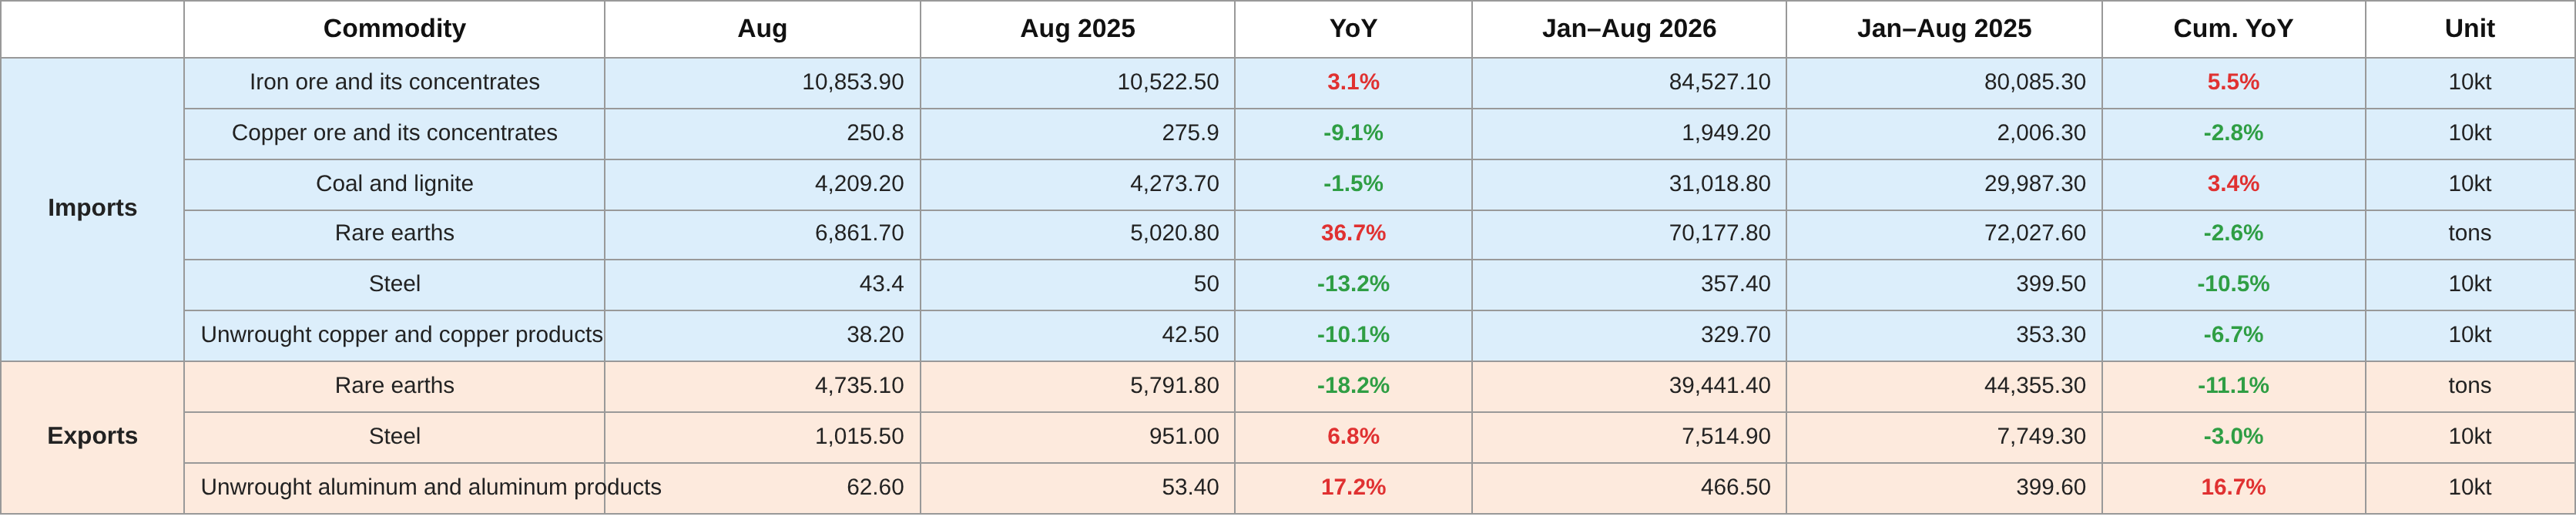
Exports:
Rare earth exports in Aug 20264,735.1 mt,down 18.2% YoY from Aug 2025. Cumulative exports in Jan-Aug 202639,441.4 mt,down 11.1% YoY from Jan-Aug 2025.
Steel exports in Aug 20261.0155 million mt,up 6.8% YoY from Aug 2025. Cumulative exports in Jan-Aug 20267,514.9 mt,down 3% YoY from Jan-Aug 2025.
In August 2026, exports of unwrought aluminum and aluminum semis totaled 626,000 mt, up 17.2% YoY from August 2025. Cumulative exports in January-August 2026 reached 4.665 million mt, up 16.7% YoY from January-August 2025.
Imports:
In August 2026, iron ore and concentrates imports totaled 108.539 million mt, up 3.1% YoY from August 2025. Cumulative imports in January-August 2026 reached 845.271 million mt, up 5.5% YoY from January-August 2025.
In August 2026, copper ores and concentrates imports totaled 2.508 million mt, down 9.1% YoY from August 2025. Cumulative imports in January-August 2026 reached 19.492 million mt, down 2.8% YoY from January-August 2025.
In August 2026, coal and lignite imports totaled 42.092 million mt, down 1.5% YoY from August 2025. Cumulative imports in January-August 2026 reached 310.188 million mt, up 3.4% YoY from January-August 2025.
In August 2026, rare earth imports reached 6,861.7mt, up 36.7% YoY from August 2025. Cumulative imports in January-August 2026 reached 70,177.8 mt, down 2.6% YoY from January-August 2025.
In August 2026, steel imports reached 434,000 mt, down 13.2% YoY from August 2025.Cumulative imports in January-August 2026 reached 3.574 million mt, down 10.5% YoY from January-August 2025.
In August 2026, imports of unwrought copper and copper semis totaled 382,000mt, down 10.1% YoY from August 2025. Cumulative imports in January-August 2026 reached 3.297 millionmt, down 6.7% YoY from January-August 2025.
![Metals broadly rose, LME copper hit a record high, SHFE zinc gained over 2%, SHFE silver, SHFE copper, and coking coal rose more than 1% [SMM midday comment]](https://imgqn.smm.cn/usercenter/VCNvX20251217171735.jpeg)
![The most-traded SHFE tin contract consolidates on a strong note, with limited release of downstream peak-season demand [SMM Tin Midday Review]](https://imgqn.smm.cn/usercenter/TMpAM20251217171753.jpg)