At the hosted by Shanghai Metals Market (SMM), Chen Bolin, Senior LFP Analyst at SMM, shared insights on "Global Iron Phosphate (Lithium) Industry Landscape in 2026 & Raw Material Cost Transmission and Pricing Mechanism Restructuring."
Iron phosphate capacity is expanding rapidly, with room for further improvement in capacity utilization rate
SMM expects that from 2023 to 2030, China's iron phosphate capacity will grow at a compound annual growth rate of 22%, with nominal capacity reaching approximately 1.25 million mt by 2030, and capacity utilization rate expected to rise from 31% previously to around 86%.
Overall, SMM believes that China's LFP capacity expansion is outpacing production release, and as downstream demand catches up, capacity utilization rate will gradually rise.
Ammonium-based process remains mainstream, while iron-based process share increases
According to SMM, from 2024 to 2026, the ammonium-based process will remain mainstream, though the share of the iron-based process continues to rise, with its share expected to increase by about 8 percentage points by 2026. Overall, process route selection is also a raw material procurement decision, and the availability, price, and production ramp-up speed of iron sources will increasingly affect competitiveness.
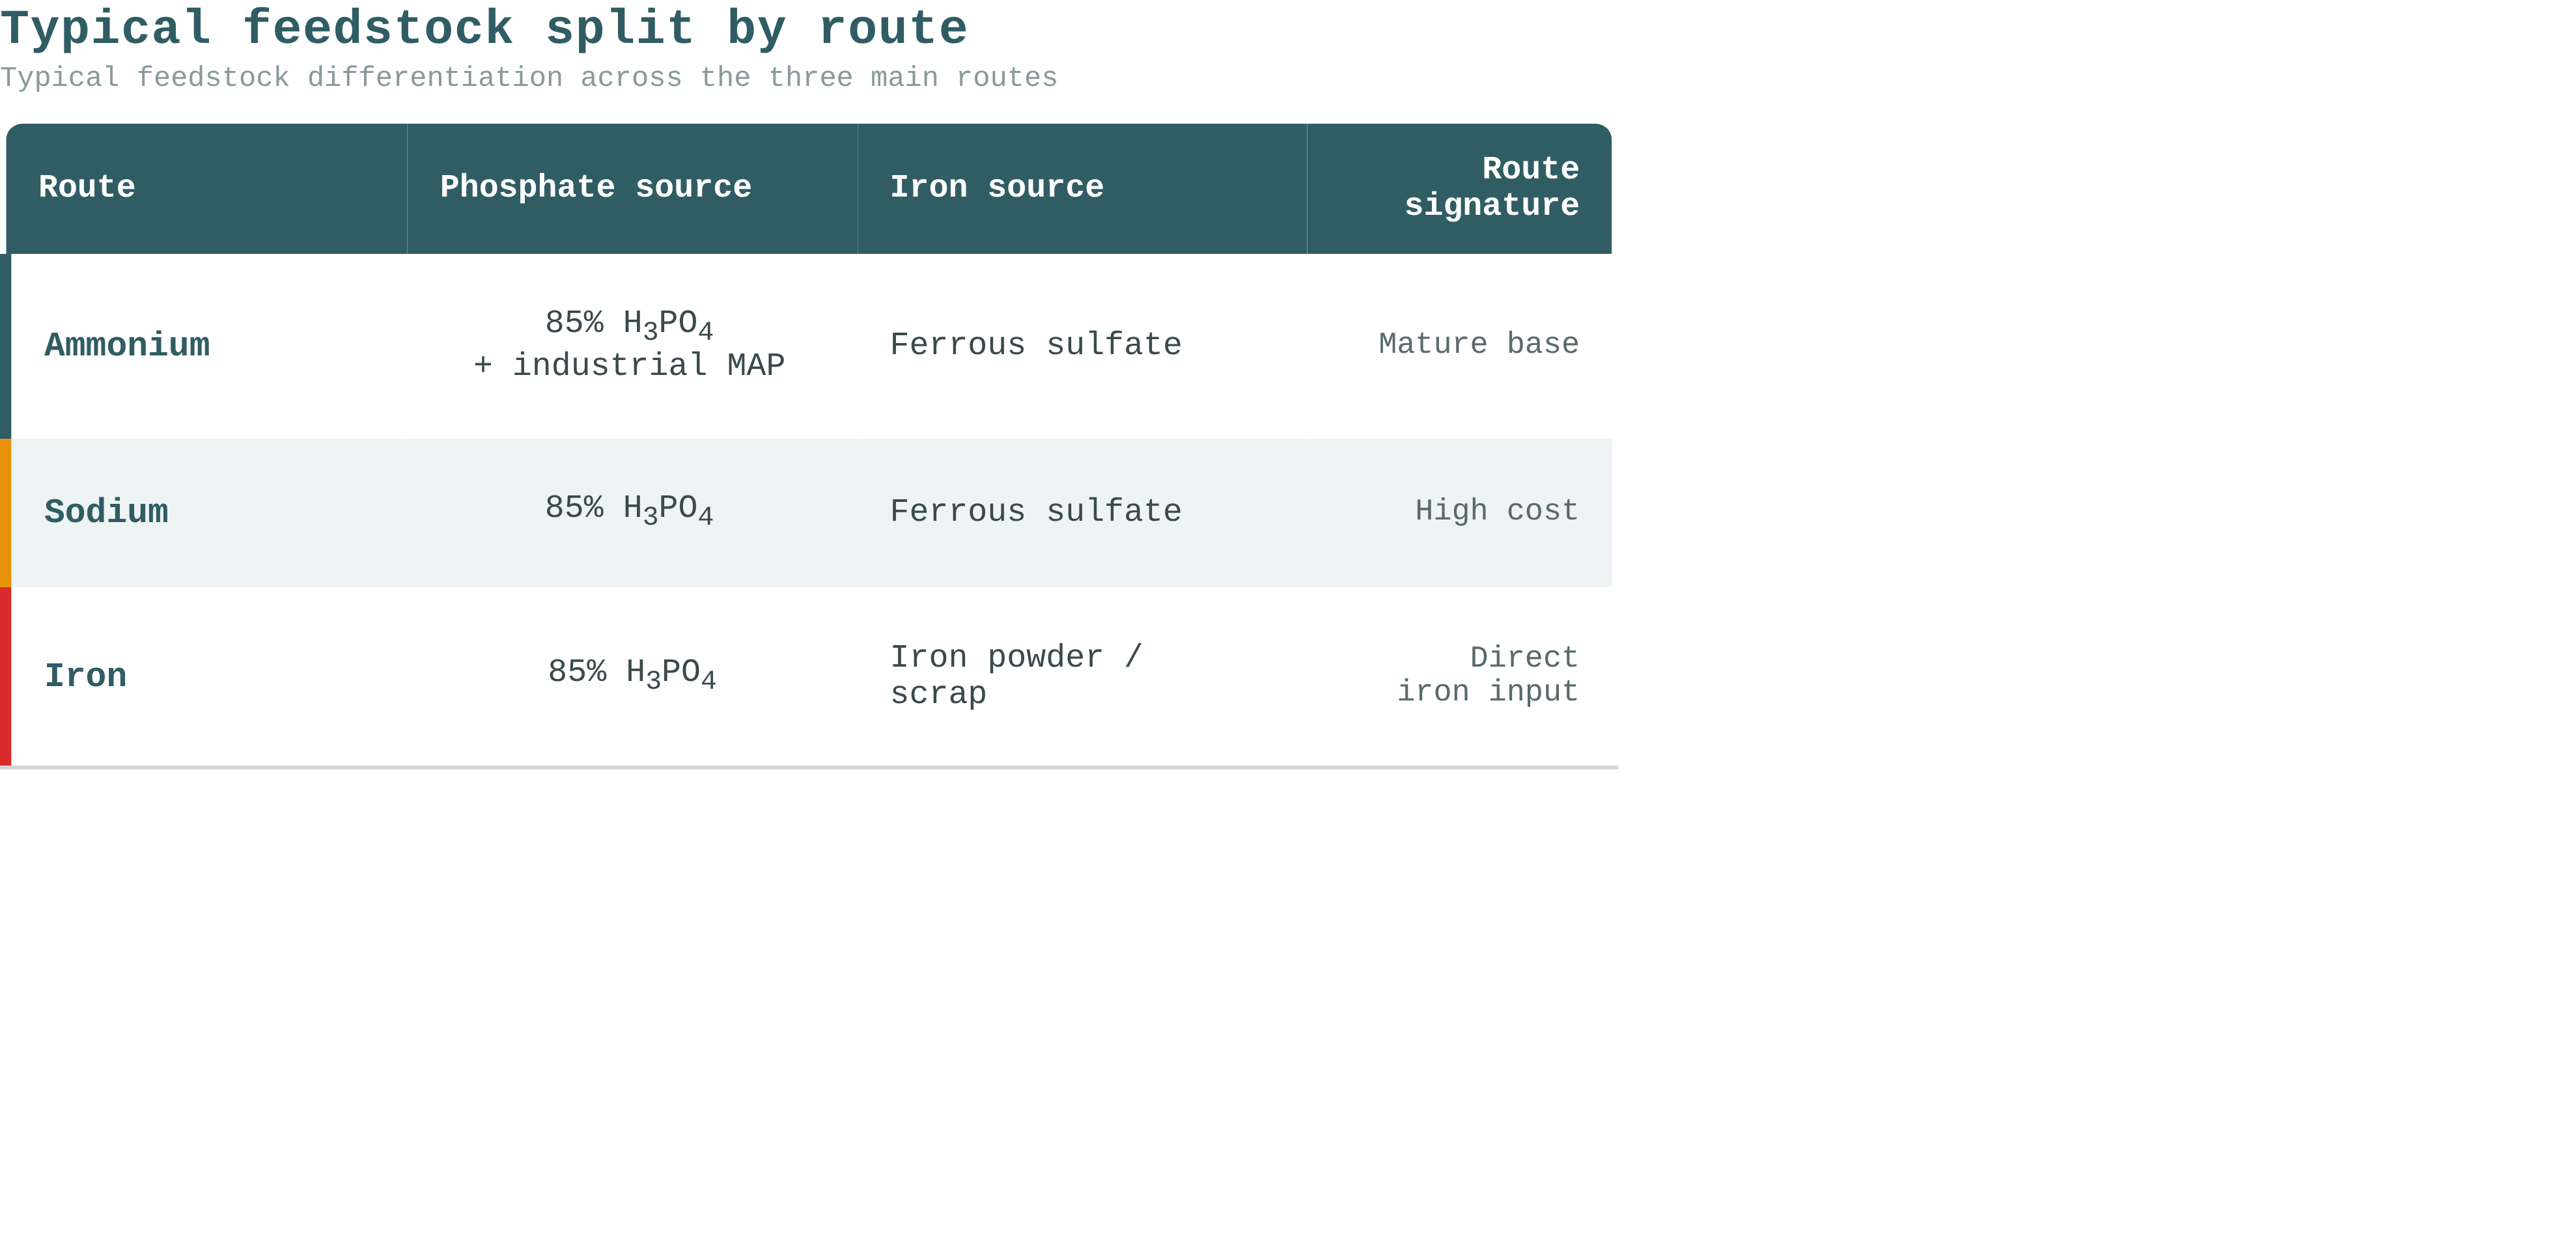
Phosphorus sources are relatively common across processes; what truly differentiates process routes is the iron source and its supporting treatment.
Sulphur prices transmit along the phosphorus source chain, becoming a systemic variable in iron phosphate costs
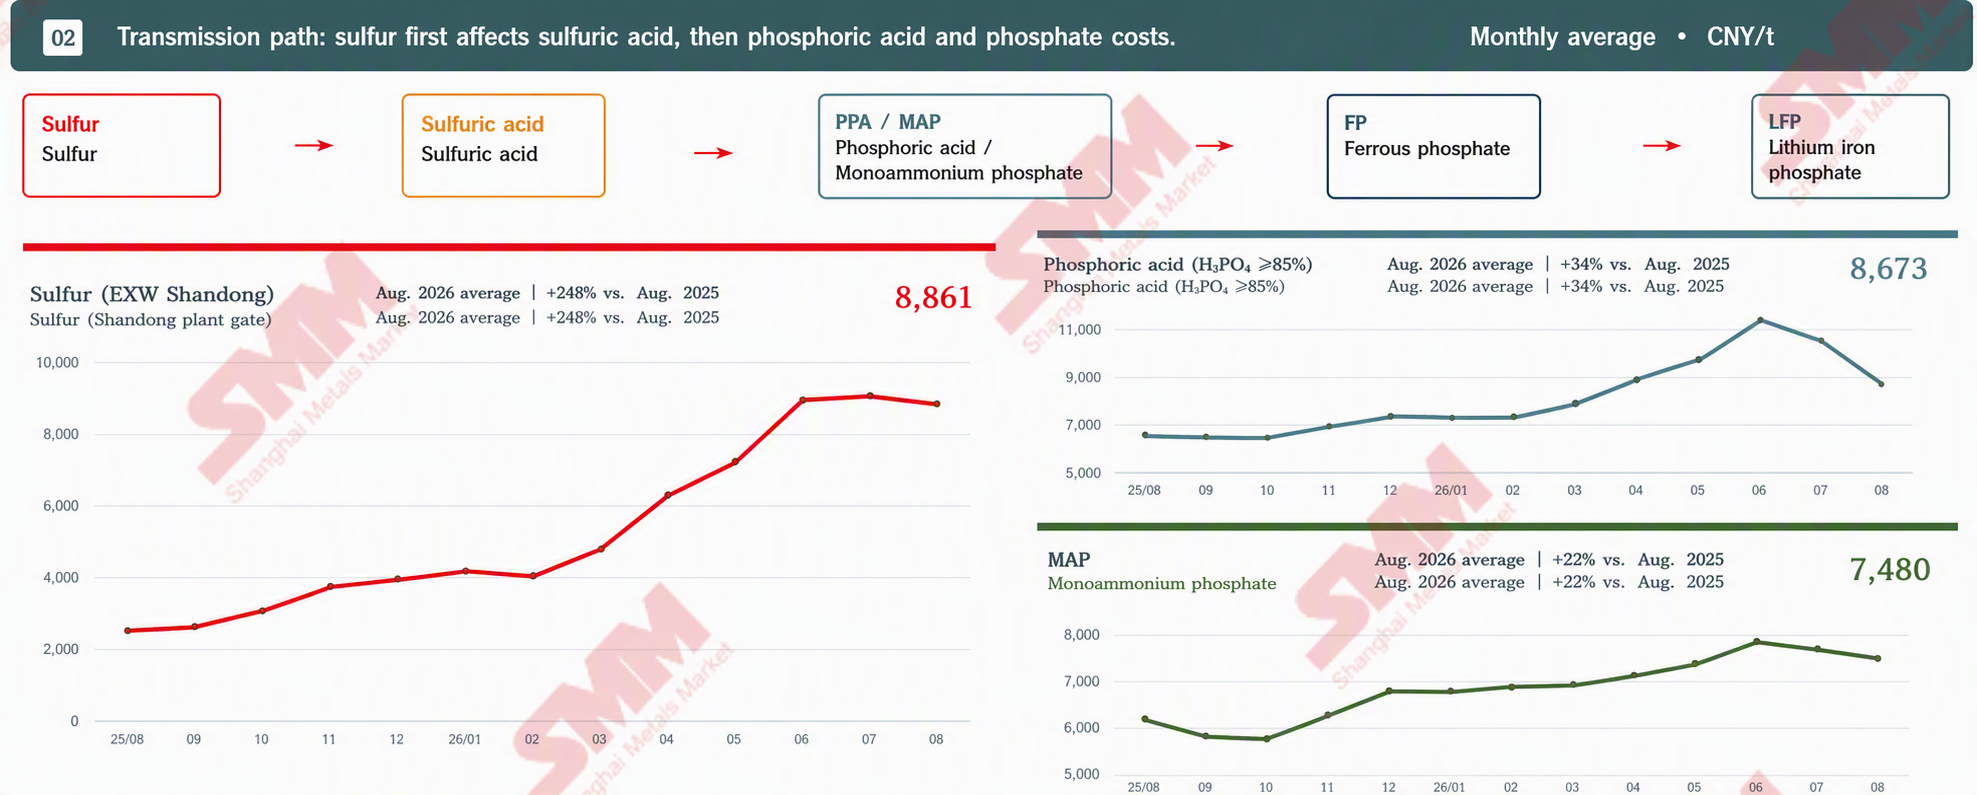
According to SMM analysis, the rise in sulphur prices has significantly lifted the cost center of phosphorus sources. However, from July to August 2026, phosphoric acid prices pulled back more than sulphur, reflecting that end-use demand, inventory levels, and industry chain bargaining power can cause temporary price divergence. Therefore, in market assessment, it is necessary to simultaneously track the cost pressure brought by sulphur, as well as the actual cost transmission efficiency of phosphoric acid and industrial-grade MAP, rather than relying solely on sulphur as a single variable to project spot prices.
Iron source price divergence: ferrous sulphate pulls back, while iron powder and iron oxide red remain stable
Iron prices do not follow sulphur fluctuations: ferrous sulphate shot up in Q2 2026 before pulling back, while battery-grade iron powder and iron oxide red entered a narrow stable range.
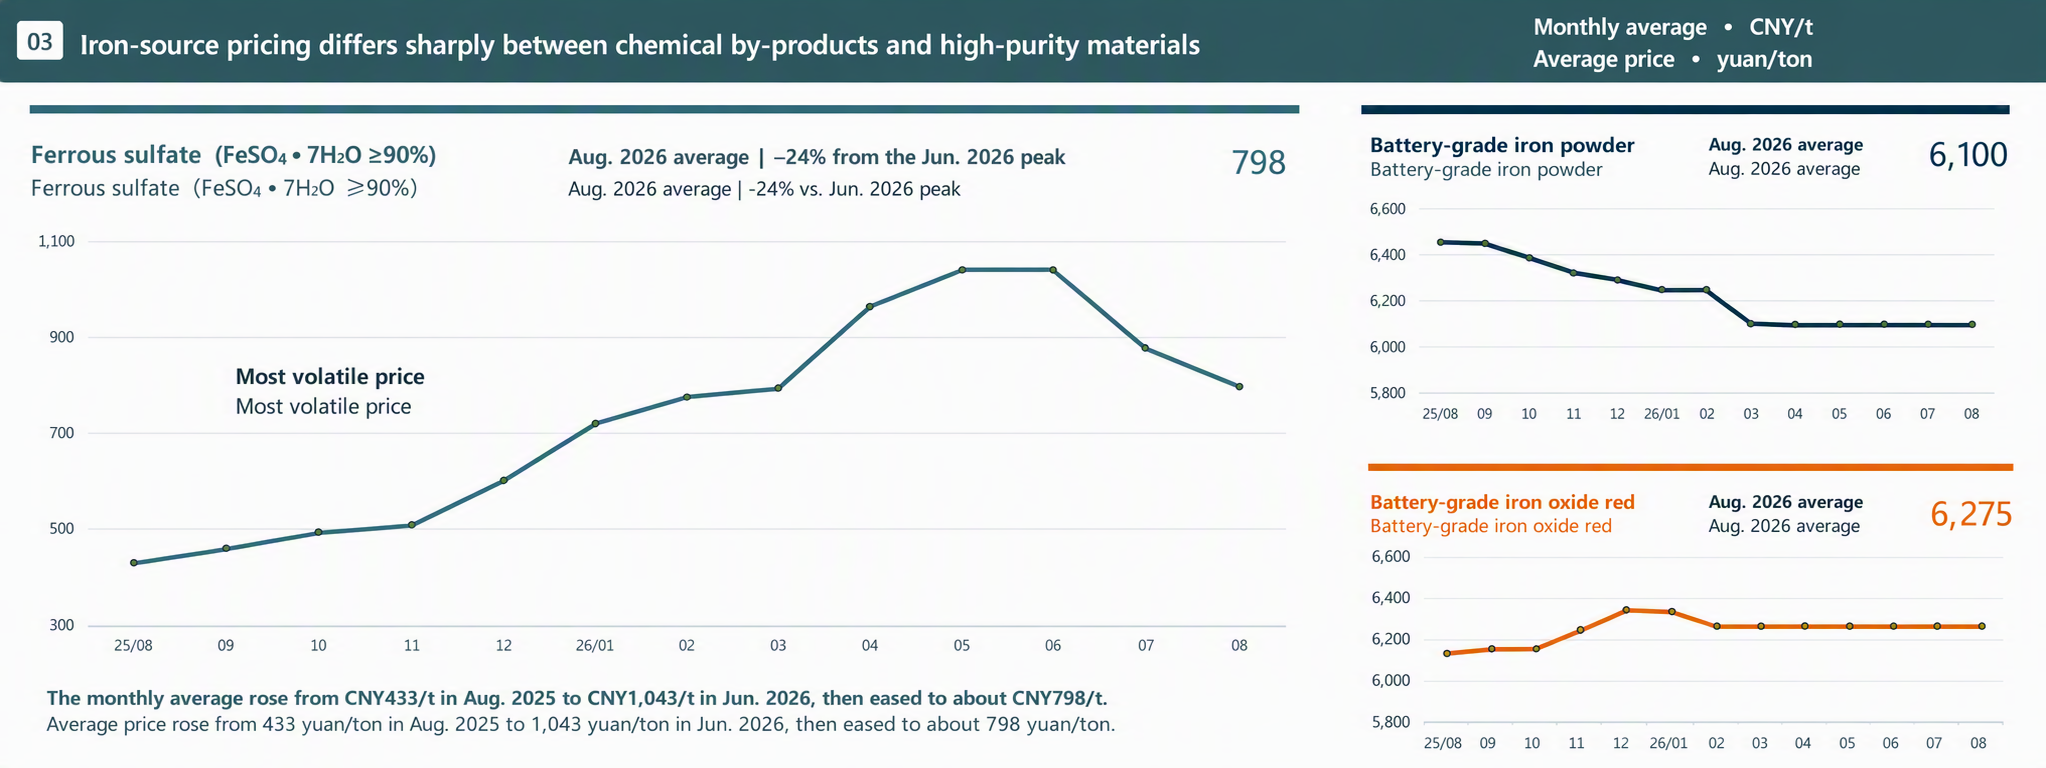
Process implications: ammonium-based and sodium-based processes are more sensitive to ferrous sulphate changes; the iron-based process bypasses ferrous sulphate, but current average iron powder prices are 1,900 yuan/mt higher than the original calculation assumptions.
For every 1,000 yuan/mt increase in sulphur prices, the ammonium-based process has the highest theoretical cost exposure
Based on the per-mt consumption relationship of sulphur to phosphoric acid or industrial-grade MAP, the ammonium-based process uses both industrial-grade MAP and phosphoric acid, resulting in higher unit cost sensitivity than the sodium-based and iron-based processes.
Core view: Sulphur is a common systemic risk factor across all three routes; route selection can only change exposure intensity, not eliminate phosphorus-source cost pass-through.
After revaluation at monthly average prices, the ammonium route has the lowest total cost; advantages of the iron and sodium routes are offset by phosphoric acid price increases.
Electricity price is uniformly set at 0.5 yuan/kWh; SMM monthly average prices can be used to replace phosphoric acid, industrial-grade MAP, ferrous sulphate, and iron powder; other items without quotes or access remain under original assumptions.
After revaluation at monthly average prices, comparing the cost structures of the three iron phosphate processes, the ammonium route has the lowest total cost. Iron powder rose 45% from the original assumption of 4,200 yuan/mt, making the main raw material cost of the iron route the highest among the three routes.
LFP enterprises are highly motivated to expand capacity, but effective and high-quality capacity remains tight.
According to SMM forecasts, from 2026 to 2030, nominal LFP capacity expansion will outpace effective high-quality supply, and both material generations and enterprise competition will evolve toward high compaction density. SMM expects the share of the high compaction density route to rise from about 22% in 2026 to about 60% in 2030.
Cost structure comparison: The iron oxide red process delivers the lowest total cost through raw material advantages.
Common manufacturing costs are essentially the same across the three routes; the iron oxide red process has the highest energy cost, but its significantly lower raw material mix reduces total cost by 6.8% compared with the iron phosphate route.
Conclusion: Cost leadership comes from the raw material side; scale-up should prioritise verification of supply stability and product consistency under the current price system.
The iron oxide red process already shows clear cost advantages, but its higher power consumption and independent iron and phosphorus source procurement requirements mean scale-up benefits still depend on raw material supply stability, yield, and product consistency.
The iron oxide red process has clear cost advantages, driving LFP enterprises to accelerate deployment.
According to SMM analysis, China's iron oxide red process LFP is expanding rapidly from a low base, and the process mix is beginning to diversify, but the iron phosphate route still dominates; in the existing market, the iron oxide red method remains niche; in the incremental market, the iron oxide red method is accelerating.
Nominal capacity growth of ferrous oxalate is faster than effective capacity; project ramp-up determines real supply.
According to SMM forecasts, nominal ferrous oxalate capacity will be about 2.68 million mt in 2026, with effective capacity rising to around 2.2 million mt; nominal capacity expansion is clearly faster than effective capacity. SMM judges that actual ferrous oxalate supply may remain tight in the short term, and rapid nominal capacity expansion does not mean effective capacity can be released simultaneously.
LFP provides a stable base, and LMFP becomes the marginal growth driver after 2027.
Process signal: On the LFP side, LDP demand remains dominated by the ferrous oxalate route; on the LMFP side, the solid-liquid hybrid route accounts for more than 85%.
SMM reviews and forecasts LDP output and demand from 2025 to 2030. In 2025-2026, the market shows a tight supply situation; in 2027-2029, after LDP capacity is released, the market shifts to a loose situation; in 2030, supply and demand are expected to return to a rebalancing state after demand catches up with supply.
Overall, LDP downstream demand growth has strong certainty, but industry price trends and the tightness of the spot market are not solely determined by the demand side, and will depend more on the actual release pace of effective capacity at each project.
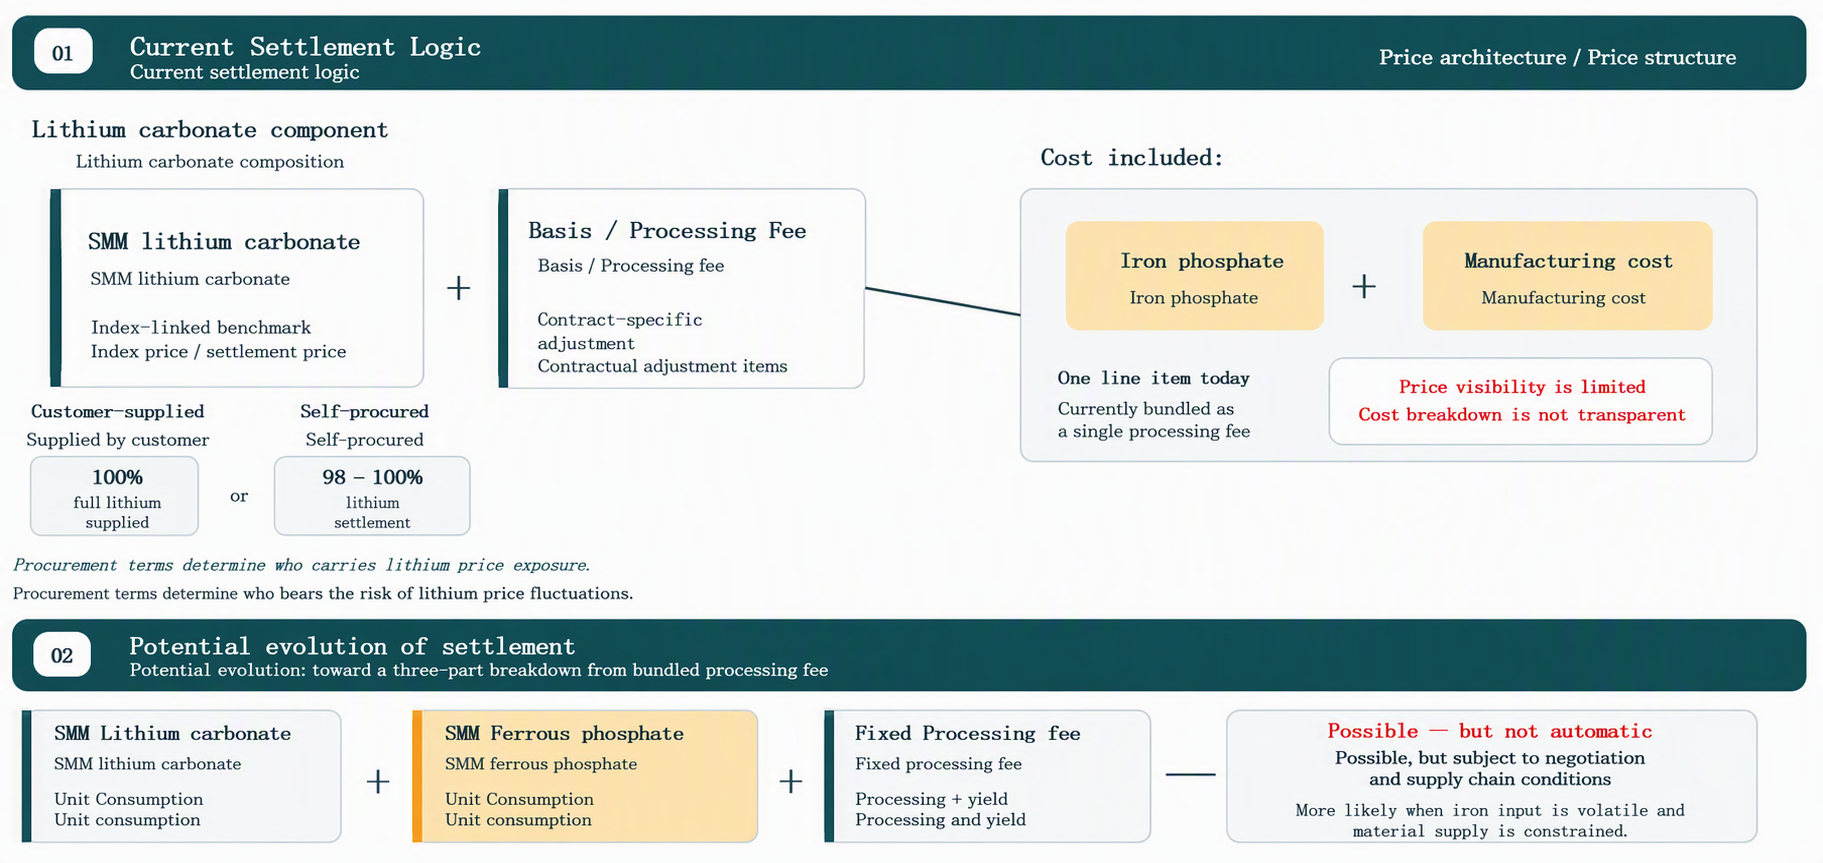
Currently anchored to lithium carbonate pricing, rising iron phosphate prices may drive the splitting of settlement structures
![[SMM News] Sibanye-Stillwater's Keliber Lithium Hydroxide Project Advances to Staged Production in Finland](https://imgqn.smm.cn/usercenter/WyqWW20251217171729.jpg)
![[SMM News] Zimbabwe's Mining Investment Appeal Hinges on Stability, Infrastructure and Lithium Beneficiation Push](https://imgqn.smm.cn/usercenter/fblvS20251217171729.png)
![[SMM News] Anson Resources Secures $193M Utah Incentive for Green River Lithium Project](https://imgqn.smm.cn/usercenter/mzgdV20251217171729.png)