Amid overcapacity and slowing growth in domestic demand, China has ramped up exports of non‑oriented silicon steel.
China has witnessed accelerated capacity expansion for non‑oriented silicon steel in recent years, with prominent overcapacity of mid‑to‑low‑grade products. Traditional domestic demand from home appliances and industrial motors has seen limited growth, while high‑end demand driven by new‑energy vehicles alone cannot absorb newly‑added capacity. This has resulted in mounting pressure to digest incremental capacity and persistently loose domestic supply. Boasting a complete industrial chain, stable product quality and cost advantages, Chinese‑made non‑oriented silicon steel has grown increasingly competitive internationally. Spurred by manufacturing relocation to Southeast Asia, Latin America and South Asia, as well as new demand generated by the global roll‑out of high‑efficiency motors, the industry has long relied on exports to absorb surplus capacity, with steady, regular overseas shipments maintained.
Non‑Oriented Silicon Steel Imports: July Import Volume Rose Slightly, Supplies Still Predominantly from Japan and Chinese Taiwan
1. Total Import Volume
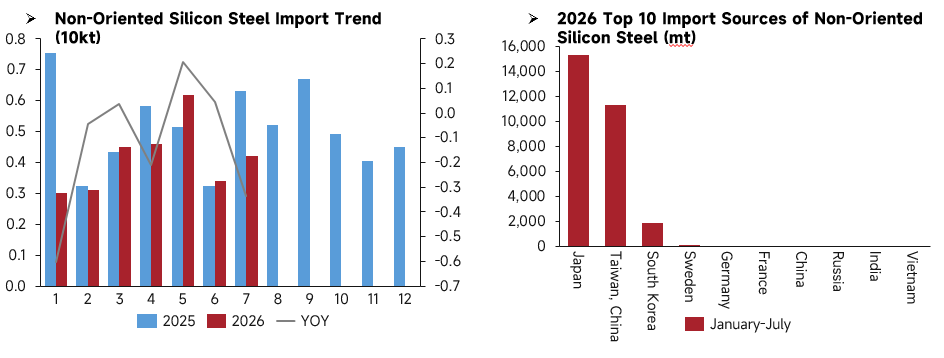
July imports of non‑oriented silicon steel posted a notable year‑on‑year decline and fell below the level recorded in the same month of 2025. The year‑on‑year (YOY) growth rate shifted from positive to negative, with import contraction deepening. Cumulative import source data for January‑July 2026 reveals a highly concentrated import supply structure. Japan and Chinese Taiwan remain the top‑two sources by a substantial margin, followed by South Korea in third place. Import volumes from Sweden, Germany, France, Russia and other countries stayed at low levels.
Data source: General Administration of Customs of China
2. Breakdown by Product Width
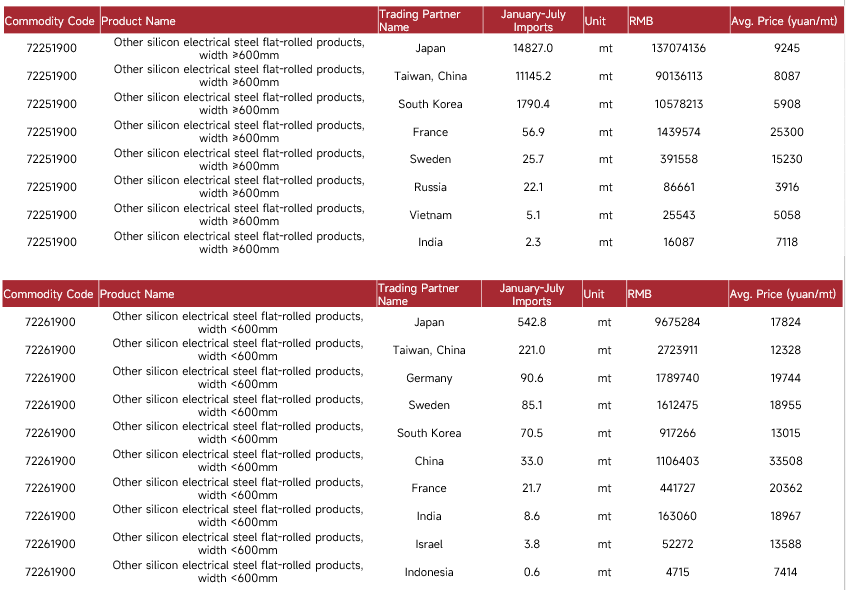
For wide‑width non‑oriented silicon steel (width ≥ 600 mm) imported from January to July 2026, major suppliers were Japan, Chinese Taiwan and South Korea, far outpacing other countries. Japan ranked first at 14 827 tonnes. Import prices showed wide divergence: average import prices from France and Sweden were markedly high, while shipments from Russia carried the lowest average price.
Narrow‑width non‑oriented silicon steel (width < 600 mm) recorded modest overall import volume, with Japan remaining the largest supplier. Narrow‑width products generally commanded higher average import prices than wide‑width grades. Shipments sourced from China showed elevated average prices, while imports from Germany, France and Sweden were also priced in the high range, indicating that these inflows were mostly high‑value‑added special grades.
Data source: General Administration of Customs of China
Non‑Oriented Silicon Steel Exports: Monthly Exports Hit Annual High on Strong Overseas Demand
1. Total Export Volume
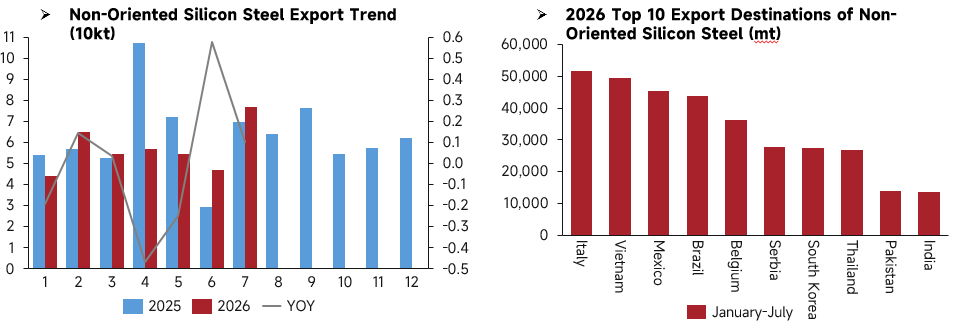
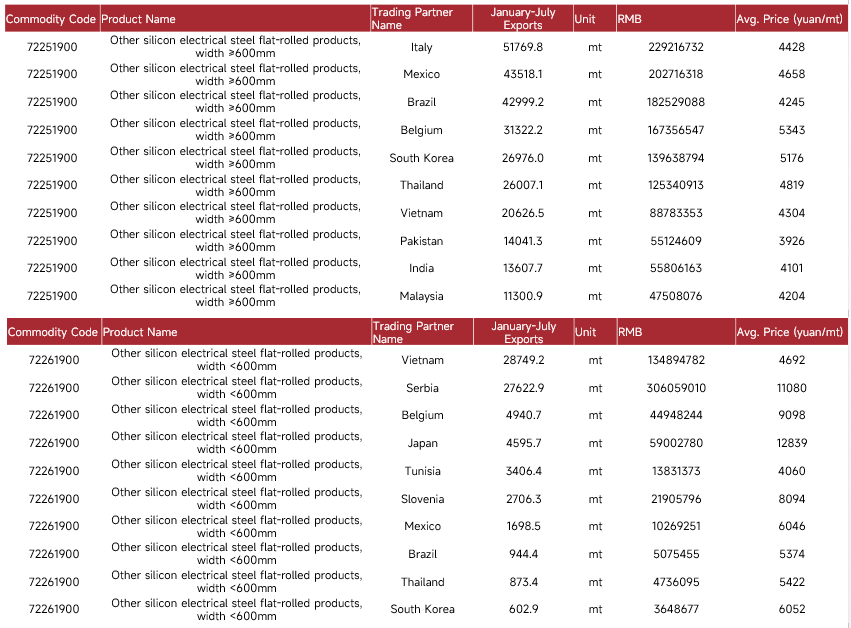
July 2026 exports of non‑oriented silicon steel exceeded the July 2025 level, maintaining positive year‑on‑year growth and continuing an upward export trend. Cumulative export‑destination data for January‑July 2026 shows diversified export markets. Italy, Vietnam, Mexico and Brazil were the top‑four destinations, followed by Belgium, Serbia, South Korea, Thailand and other markets. Shipments were primarily bound for Europe, Southeast Asia and Latin America, making overseas markets a key outlet for China’s surplus domestic capacity.
Data source: General Administration of Customs of China
2. Breakdown by Product Width
Wide‑width non‑oriented silicon steel (width ≥ 600 mm) accounted for the bulk of exports over January‑July 2026, mainly shipped to Italy, Mexico, Brazil, Belgium and other European, American and Southeast‑Asian markets. Average export prices ranged mostly from RMB 3 900 – 5 400 per tonne, reflecting the export of large‑volume mid‑to‑low‑grade surplus capacity.
Exports of narrow‑width non‑oriented silicon steel (width < 600 mm) contracted noticeably. Vietnam and Serbia were the top‑two receiving markets, and average export prices were highly dispersed. Shipments to Japan, Serbia, Belgium and other destinations fetched relatively high prices, signalling high‑value‑added exports for these trade flows.
Data source: General Administration of Customs of China
Summary
China’s non‑oriented silicon steel imports fell year‑on‑year in July 2026 with negative growth, and import sources over January‑July remained heavily concentrated in Japan and Chinese Taiwan. By specification, wide‑grade imports were mainly supplied by Japan, Chinese Taiwan and South Korea with significant price dispersion. Narrow‑grade imports were low‑volume, high‑priced and largely consisted of premium special grades.
On the export side, July shipments expanded year‑on‑year. Exports were channelled to diversified overseas markets, chiefly Europe, Southeast Asia and Latin America. Wide‑width products formed the backbone of exports at relatively low prices, serving as the primary channel to digest surplus mid‑to‑low‑end capacity. Narrow‑width export volumes were limited with wide‑ranging prices; shipments to selected Japanese and European markets demonstrated high‑value‑added characteristics.

![[SMM Analysis] Indonesia Steel Market Outlook 2026: Capacity Expansion Meets a Chinese Import Tsunami](https://imgqn.smm.cn/usercenter/tgoYV20251217171715.jpg)
![[August SMM Operating Rate of Steel Mills Using Externally Purchased Billets] Phased Uptrend, Steel Mills Using Externally Purchased Billets Showed Higher Production Enthusiasm](https://imgqn.smm.cn/usercenter/VgxkU20251217171719.jpg)