ZAMBIA COPPER OUTLOOK
Zambia's Copper Growth Push: What Will It Take to Reach 3 Million Tonnes by 2031?
Zambia entered 2026 with a stronger copper project pipeline, renewed capital spending and several large operations in recovery or expansion mode. Yet the latest national figures show that translating investment into physical metal remains gradual. Copper production reached 447,181.93 tonnes in the first half of 2026, up just 0.45% from 445,176.59 tonnes a year earlier. The contrast between stronger mine-level performance and almost flat national growth provides a useful measure of how demanding the country's 3 million-tonne target remains. It also highlights a central issue for the market: Zambia's future supply story is increasingly credible, but the timing and consistency of new tonnes will depend on execution across mines, processing facilities and the power system rather than on project announcements alone.
|
447,181.93 t |
+0.45% |
3.0 Mt |
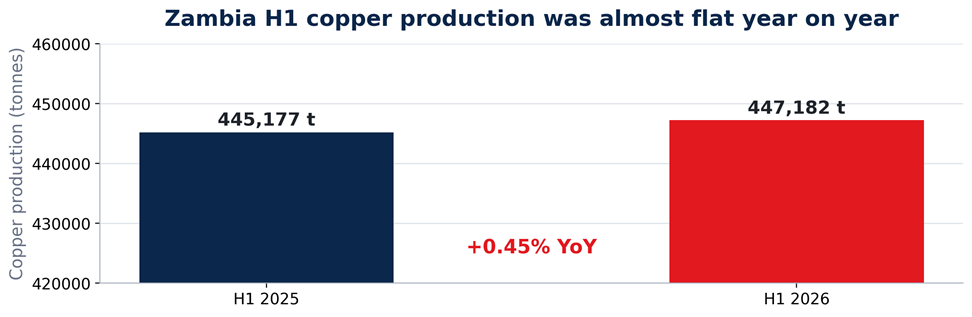
Figure 1. First-half copper production barely moved year on year. Source: Zambia Ministry of Mines and Minerals Development.
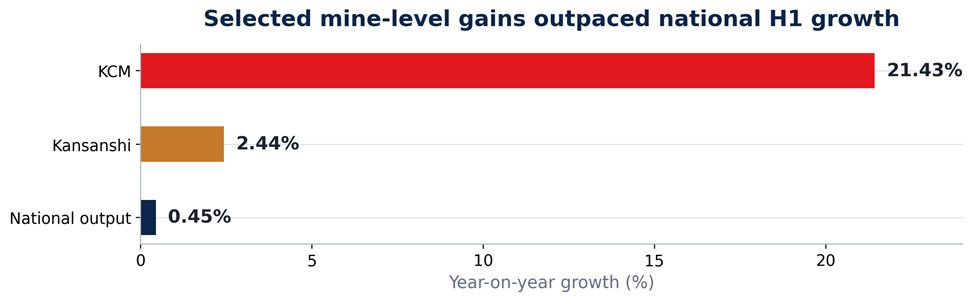
Figure 2. Selected mine-level gains were far stronger than the national increase. Source: Zambia Ministry of Mines and Minerals Development.
1. Production is recovering, but the growth curve remains steep
The latest parliamentary series shows Zambia's mined copper output at 808,370 tonnes in 2018, falling to 733,088.88 tonnes in 2019, rebounding to 848,938 tonnes in 2020 and then easing to 786,523 tonnes by 2023. Production recovered to 825,271 tonnes in 2024, while government subsequently reported roughly 890,000 tonnes for 2025. The direction is positive, but the 3 million-tonne strategy requires an expansion of a completely different scale.
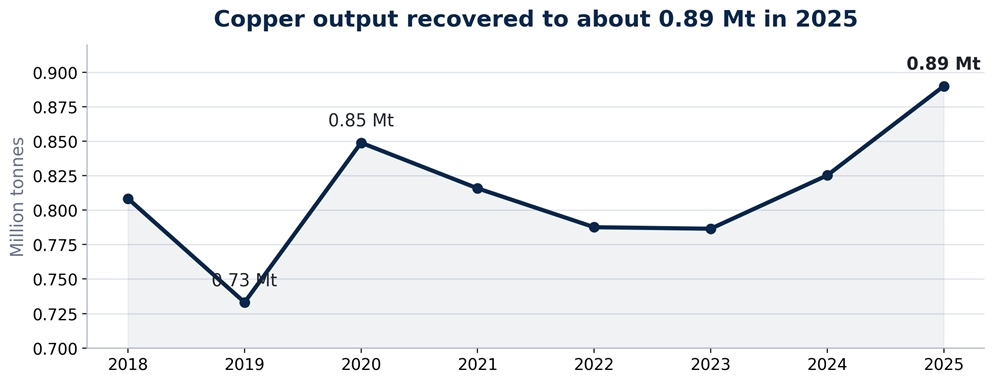
Figure 3. Zambia copper production, 2018-2025. Source: National Assembly of Zambia, February 2026. Historical national production figures have been revised across government publications and may differ from earlier reported series.
Starting from approximately 890,000 tonnes in 2025, a smooth path to 3 million tonnes in 2031 implies compound annual growth of about 22.4%. This is an SMM calculation rather than an official forecast. The trajectory is useful because it shows the scale of acceleration required, but actual mine supply will not grow in a straight line. Major expansions arrive in steps, commissioning periods can temporarily constrain output, and maintenance, ore grades and operating reliability can create significant year-to-year volatility. In practical terms, Zambia does not need to follow the exact curve shown below, but it does need several large production increments to arrive within a relatively narrow window if the 2031 objective is to remain within reach.
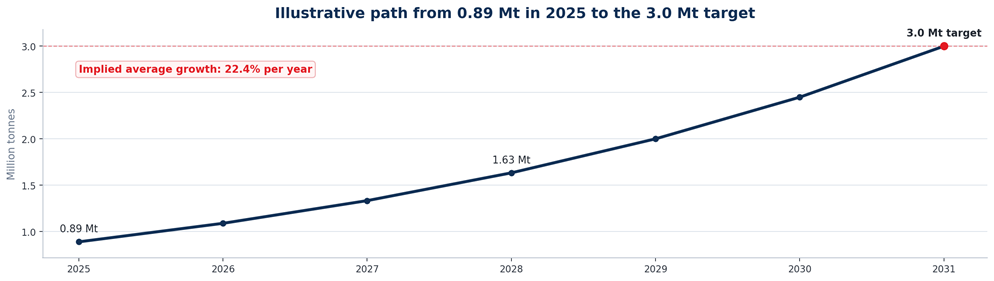
Figure 4. Illustrative production path required to reach 3 million tonnes by 2031. Source: SMM calculation using 2025 output of approximately 890,000 tonnes.
The immediate 2026 arithmetic is also demanding
If Zambia were to reach 1 million tonnes in 2026, second-half production would need to total about 552,818 tonnes, roughly 23.6% above H1 output. That comparison does not account for normal seasonal differences between the two halves of the year, but it illustrates the acceleration required even before the country tackles the much larger 2031 gap. A stronger H2 would therefore be an important early signal, particularly if higher output is broad-based across major operations rather than concentrated in one or two mines. Sustained national growth will ultimately depend on whether improvements at Kansanshi, KCM, Lumwana and other operations can outweigh maintenance losses and operational setbacks elsewhere.
SMM Analysis: The production trajectory shows why Zambia's 3 million-tonne objective should be assessed as a multi-project growth programme rather than a simple extension of the recent recovery. Output has improved, but the required growth rate remains far above recent national performance. The key question is whether several expansions can ramp concurrently while existing mines avoid offsetting losses from maintenance, grade variability and operating constraints. The target becomes materially more achievable only if project growth and base-mine stability improve at the same time. Zambia therefore needs repeated, sustained production step-ups rather than one exceptional year of growth.
2. The project pipeline behind Zambia's next phase of copper growth
The strongest argument in favour of higher Zambian copper output is that several large assets are advancing simultaneously. Kansanshi's S3 expansion is ramping up, Sentinel remains a major established producer, Lumwana's Super Pit expansion is under construction and Mingomba has entered mine-development work. These projects do not all contribute on the same timetable, which is critical when assessing the 2031 target. Near-term growth is therefore more dependent on brownfield expansions and stronger utilisation at existing mines, while larger greenfield contributions become increasingly important later in the decade and into the early 2030s.
|
Operation |
Development |
Production implication |
|
Kansanshi |
S3 expansion / ramp-up |
175-205 kt in 2026; 230-260 kt in 2028 |
|
Sentinel |
Established large-scale mine |
190-220 kt/y guidance in each of 2026-2028 |
|
Lumwana |
~US$2bn Super Pit expansion |
~240 kt/y projected annual production over +30-year life; first expanded copper end-Q1 2028 |
|
Mingomba |
Greenfield mine development |
~300 kt/y targeted production; first output expected in the early 2030s |
Table 1. Selected projects shaping Zambia's medium-term copper supply pipeline. Source: First Quantum Minerals; Barrick Mining; KoBold Metals.
Kansanshi is the most visible near-term brownfield contribution. Its 2026 guidance is 175,000-205,000 tonnes, rising to 230,000-260,000 tonnes in 2028 as S3 ramps up. Sentinel provides an important existing production base with annual guidance of 190,000-220,000 tonnes through 2028. Lumwana provides another large step-change later in the decade, with first expanded copper targeted at the end of Q1 2028 and projected annual production of about 240,000 tonnes over a mine life exceeding 30 years. Mingomba is targeted at around 300,000 tonnes of copper per year, with first output expected in the early 2030s. Together, the projects show that Zambia has a meaningful growth pipeline, but they also underline the sequencing problem: not all of the country's largest prospective additions arrive early enough to carry the 2031 target on their own.
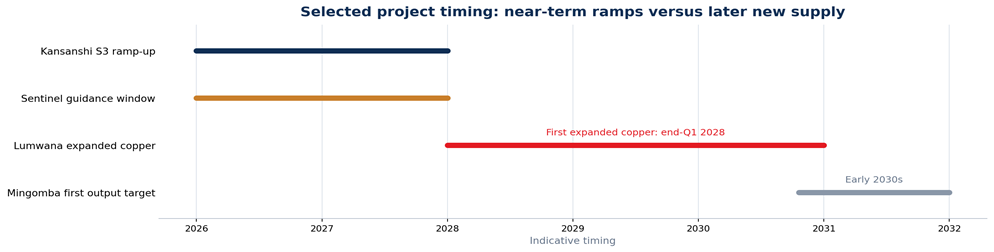
Figure 5. Selected project timing highlights the gap between near-term brownfield ramps and later greenfield supply. Source: First Quantum Minerals; Barrick Mining; KoBold Metals; SMM compilation.
|
SMM Analysis: Zambia's project pipeline is increasingly credible, but its timing is uneven. Kansanshi can influence supply now, while Lumwana's larger step-up begins from 2028 and Mingomba is mainly an early-2030s contribution. The 2031 target therefore requires brownfield ramps to stay on schedule, high utilisation at existing mines and steady progress on new developments. Near-term execution matters as much as future project scale because every tonne lost from the current production base increases the amount of new capacity that must be delivered later. |
3. Power supply remains the system-wide constraint
The copper target cannot be assessed independently of Zambia's electricity system. Installed generation capacity stood at 4,118.71 MW at the end of 2025, of which hydropower accounted for 3,176.14 MW, or 77.11%. Coal represented 8.01%, solar 7.47%, diesel 4.73% and heavy fuel oil 2.67%. The dominance of hydro leaves the system highly exposed to rainfall and reservoir conditions, while mine expansions and processing facilities require stable, high-load electricity around the clock. That exposure is not theoretical: the Energy Regulation Board said the effects of the 2024 drought continued to constrain hydropower supply in 2025, requiring electricity imports and load management. This means that the relevant question is not only how much generation capacity Zambia adds, but also how reliable and diversified that capacity becomes as copper production expands.
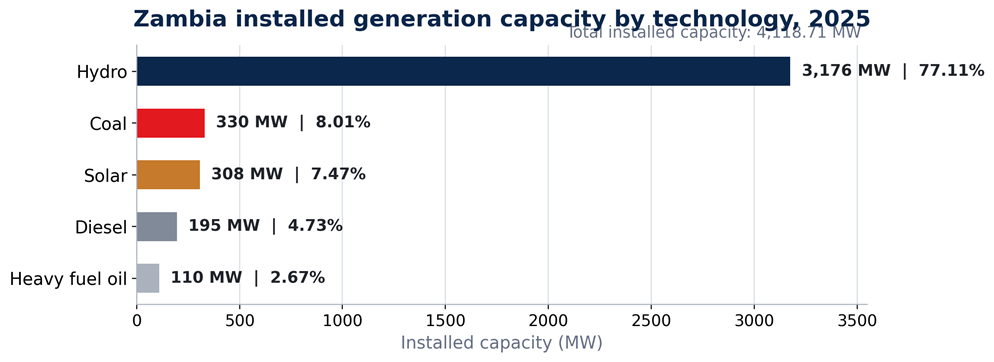
Figure 6. Zambia remains heavily dependent on hydropower for installed generation capacity. Source: Energy Regulation Board 2025 Annual Statistical Bulletin.
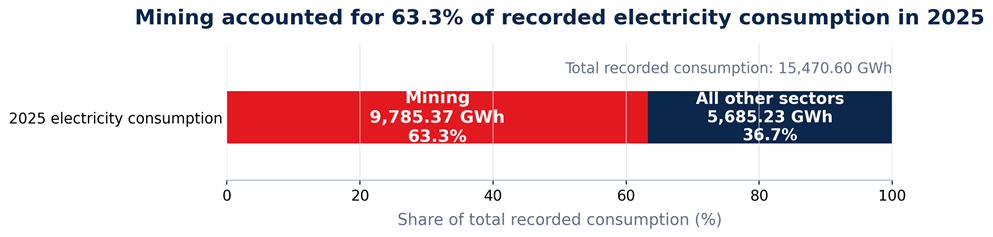
Figure 7. Mining accounted for about 63.3% of Zambia's recorded electricity consumption in 2025. Source: Energy Regulation Board 2025 Annual Statistical Bulletin.
Mining used 9,785.37 GWh in 2025 out of total recorded electricity consumption of 15,470.60 GWh, equivalent to approximately 63.3%. Mining electricity demand is also projected to rise materially through the remainder of the decade. The implication is straightforward: the sector that is expected to deliver Zambia's largest export and investment growth is already the dominant industrial load on the power system. New generation, storage, stronger transmission and dependable cross-border supply arrangements will therefore be increasingly important if mine and concentrator expansions are to operate at high utilisation rates rather than simply add installed processing capacity
.
|
SMM Analysis: Power is not a secondary infrastructure issue for the copper strategy; it is a direct supply variable. Mining already represents almost two-thirds of recorded national electricity consumption, while more than three-quarters of installed generation capacity is hydro-based. The demand outlook points to further growth in mining load through 2030. Zambia therefore needs not only additional generation, but a more resilient mix of supply, stronger transmission and reliable access for expanding mines and processing plants. Without that, higher mine and concentrator capacity can exist on paper while operating rates remain vulnerable to hydrological conditions and system shortages. The quality of new power capacity will matter as much as the headline megawatt number: diversification, storage and transmission resilience will determine whether additional generation can actually support round-the-clock mining and processing demand. |
4. From investment commitments to physical copper supply
Zambia has already achieved a meaningful shift in investor confidence. The country has attracted a substantial pipeline of new mining investment, including multi-billion-dollar commitments to Kansanshi, Lumwana, Mopani, KCM, Mingomba and other operations. The next phase is therefore less about proving that capital is interested in Zambia and more about converting that capital into sustained mine and plant output. Investment is typically committed years before additional copper reaches the market, making execution speed increasingly important.
Mine growth occurs through a chain: exploration and resource definition, financing, permits, mine development, plant construction, power connections, commissioning and then stable operation. A project can be fully financed and under construction for years before it adds saleable copper. For Zambia, the critical measure will therefore be how quickly projects move from construction milestones into sustained throughput while existing operations maintain production during the ramp-up period.
Processing and operating constraints can offset expansion gains
The H1 2026 figures illustrate that point. Stronger output at Kansanshi, KCM, Lumwana and Lubambe was partly offset by declines at NFCA Mining, Chibuluma and Mopani. According to the Ministry of Mines and Minerals Development, planned maintenance at Mopani's Mindola Shaft affected ore hoisting, while fuel constraints and inadequate domestic sulphuric acid supplies also affected plant-feed availability. These are operational rather than geological limitations, but they still determine how much copper reaches the market. As Zambia scales up, the reliability of reagents, smelting, transport, maintenance planning and electricity supply will become increasingly important.
|
SMM Analysis: Zambia has moved from a mining-policy recovery story into an execution cycle. The project pipeline, recapitalisation and renewed investor interest support a structurally higher copper-supply outlook, but the 2031 target requires several large ramps to overlap with strong performance from the existing mine base. SMM therefore distinguishes between announced capacity, commissioned capacity and saleable copper production. H1 2026 shows why that distinction matters: investment and mine-level improvements are visible, yet national output growth remains modest. The next two to three years should provide the clearest evidence of whether Zambia can turn its project pipeline into a sustained national production uptrend. |
5. What to watch through the next phase of the ramp-up
The most useful near-term indicator will be whether national production growth broadens beyond a small group of outperforming mines. H2 2026 output, Kansanshi S3 throughput, KCM's operating consistency and progress at Mopani will help show whether the recovery is becoming more durable. Project execution will be the second test: Lumwana's construction milestones and progress at newer projects will determine how much additional capacity can realistically arrive before 2031, while power, processing and logistics must expand alongside the mines themselves.
For the copper market, Zambia should therefore be viewed as a potentially important source of medium-term supply growth, but not as a single 3 million-tonne block that can be assumed to arrive on schedule. The more relevant question is how the production profile changes year by year as brownfield expansions ramp, existing operations stabilise and later-stage projects move toward commissioning. That progression will determine whether Zambia becomes a steadily larger contributor to global mine supply or whether infrastructure and operating constraints continue to delay part of the expected growth.