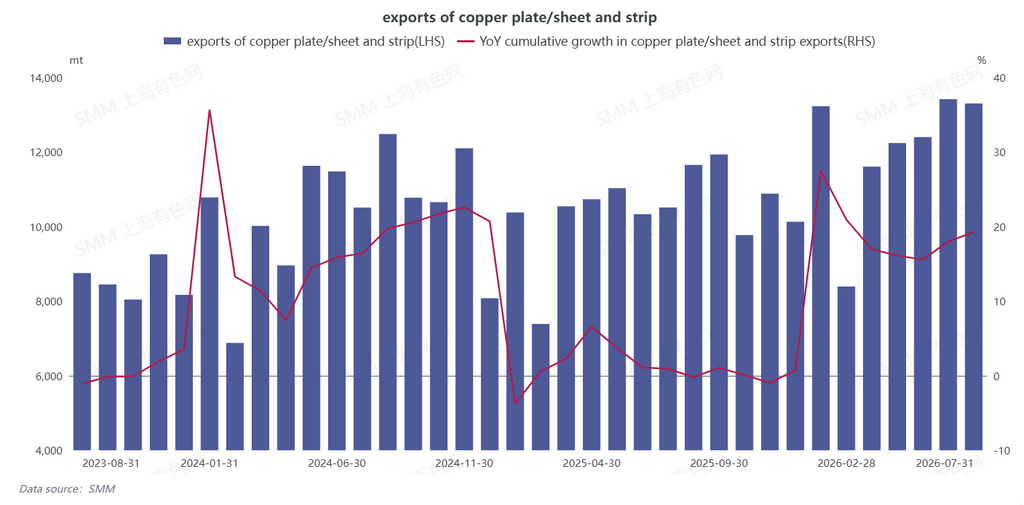
According to data from the General Administration of Customs, China’s copper plate/sheet and strip exports in July 2026 were 13,307.67 mt, down 0.87% MoM and up 26.54% YoY; from January to July, China’s cumulative copper plate/sheet and strip exports totaled 84,624.57 mt, up 19.28% YoY.
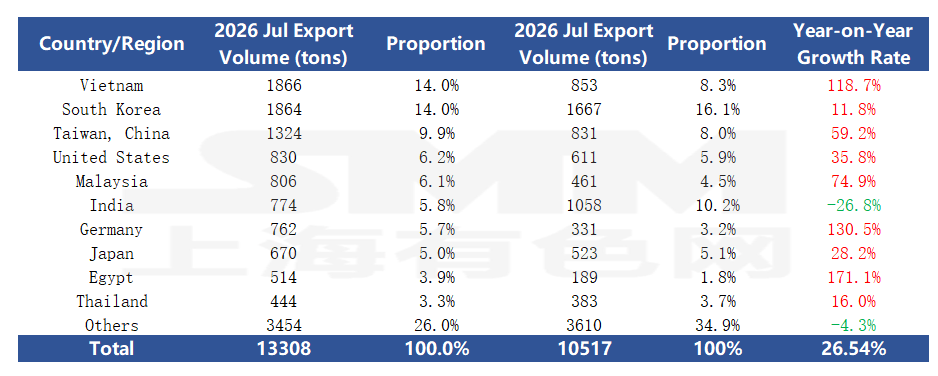
In July 2026, China's copper plate/sheet and strip exports edged down MoM, but maintained a high double-digit YoY growth, with the overall export market continuing to show strong performance. Specifically, in July, Vietnam, South Korea, and Taiwan, China remained the top three export destinations for China's copper plate/sheet and strip, accounting for 38% of total exports, making them the core export markets. Growth rates varied significantly across segments, with Egypt, Germany, and Vietnam surging 171.1%, 130.5%, and 118.7% YoY respectively, demonstrating strong export order release. Taiwan, China and Malaysia also recorded high growth, up 59.2% and 74.9% YoY respectively. South Korea, a traditional key export market, maintained steady growth, rising 11.8% YoY. Mature markets such as the US, Japan, and Thailand saw stable demand, with all exports posting positive growth. Some markets showed weakening demand, with India experiencing the most notable decline, down 26.8% YoY. Exports to other countries and regions edged down 4.3% YoY. Overall, demand diverged significantly across regions outside China, with emerging markets contributing notably to growth, and markets outside China demonstrated sufficient resilience.
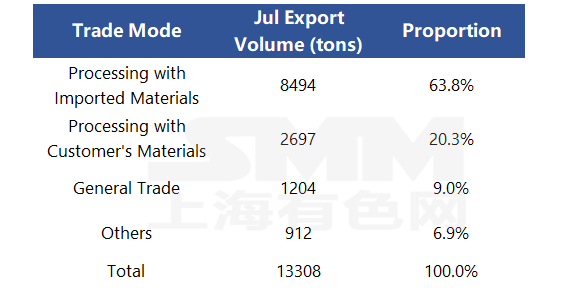
From the perspective of the export trade mode structure, China’s trade structure for copper plate/sheet and strip exports basically maintained its original pattern. According to customs statistics, in July 2026, processing trade with imported materials remained the primary export channel for copper plate/sheet and strip, with exports of 8,494 mt, accounting for 63.8% of total exports; Processing and Assembling ranked second, with exports of 2,697 mt that month, accounting for 20.3%; Ordinary Trade exports were 1,204 mt, accounting for 9.0%; and other trade types totaled 912 mt, accounting for 6.9%. Together, the two processing trade categories—processing trade with imported materials and processing trade with supplied materials—accounted for more than 80% of export share and remained the core component of copper plate/sheet and strip exports.
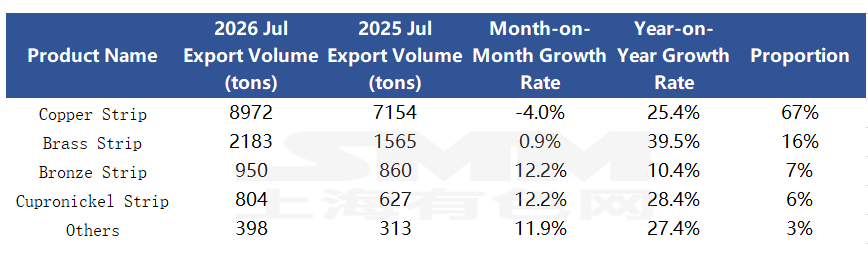
By product category, in July 2026, exports of all copper plate/sheet and strip sub-segments improved YoY, but MoM trends diverged significantly. Copper strip still held the largest export share, with 8,972 mt exported in the month, accounting for 67% of total exports, up 25.4% YoY, but down 4.0% MoM. For brass strip, external demand stood out, with exports of 2,183 mt, representing a 16% share, surging 39.5% YoY and edging up 0.9% MoM. Bronze strip and cupronickel strip both achieved double-digit growth YoY and MoM. Overall, all major categories maintained positive YoY growth. Copper strip remained the core support for exports, though it pulled back slightly MoM. Brass, bronze, and cupronickel strips generally recovered MoM, and export orders showed relatively greater resilience.
(HS code74091110,74091190,74091900,74092100,74092900,74093100,74093900,74094000,74099000)