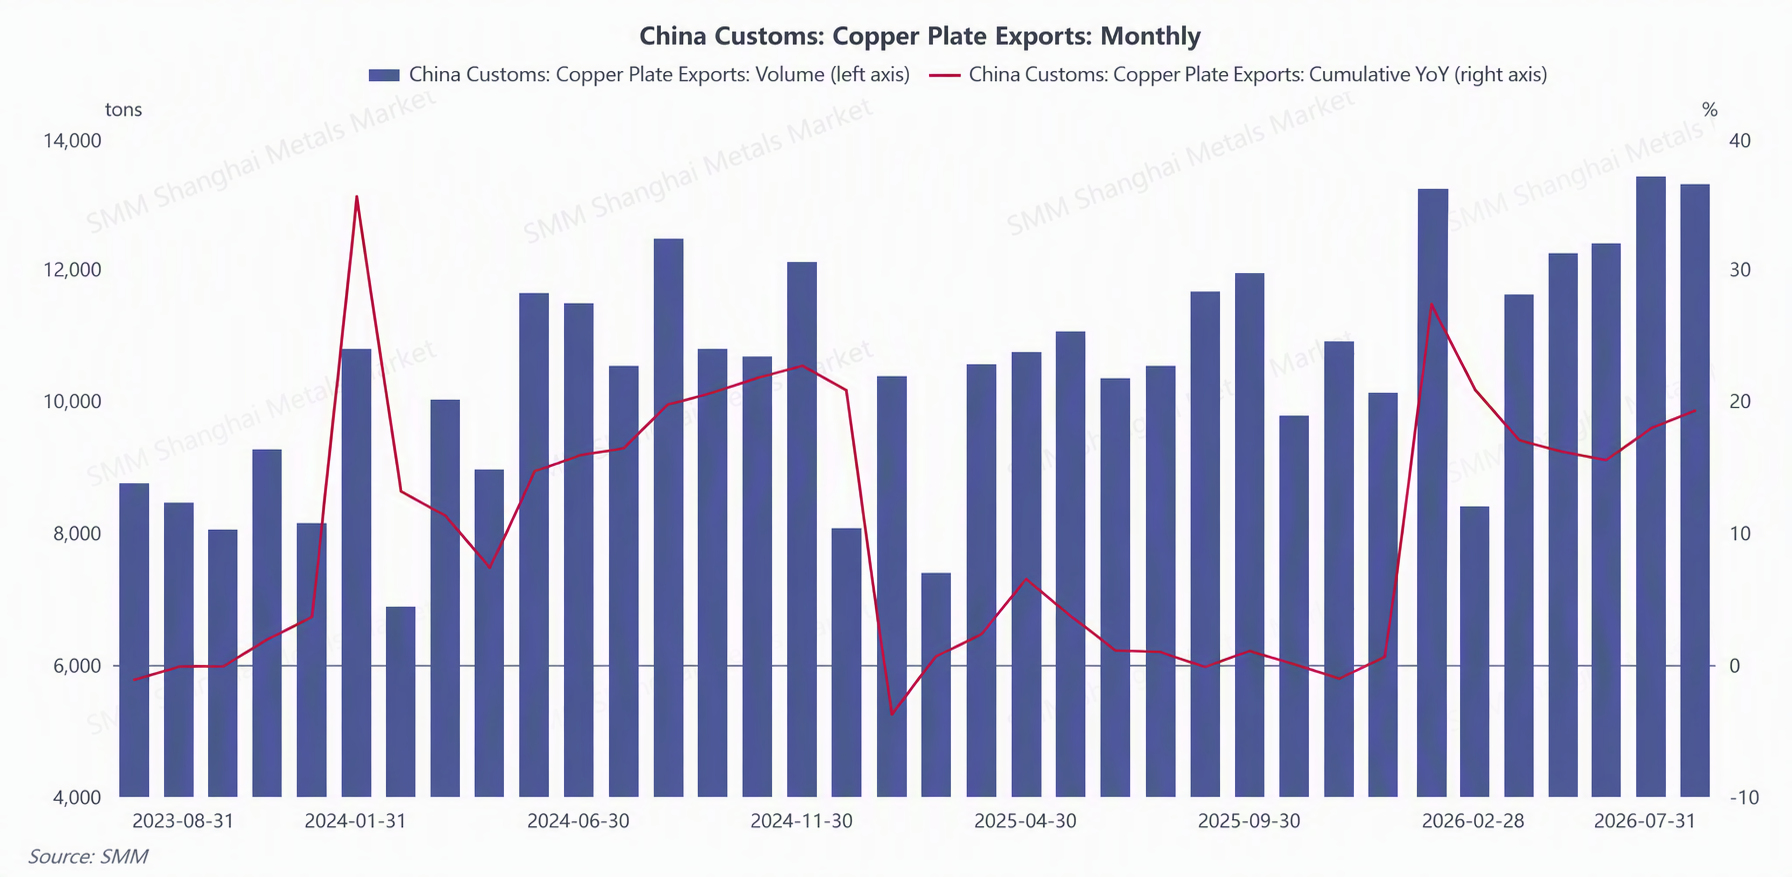
According to data from the General Administration of Customs,in July 2026, China’s exports of copper plate/sheet and strip totaled 13,307.67 mt, down 0.87% MoM and up 26.54% YoY; from January to July, China’s cumulative exports of copper plate/sheet and strip reached 84,624.57 mt, up 19.28% YoY on a cumulative basis.
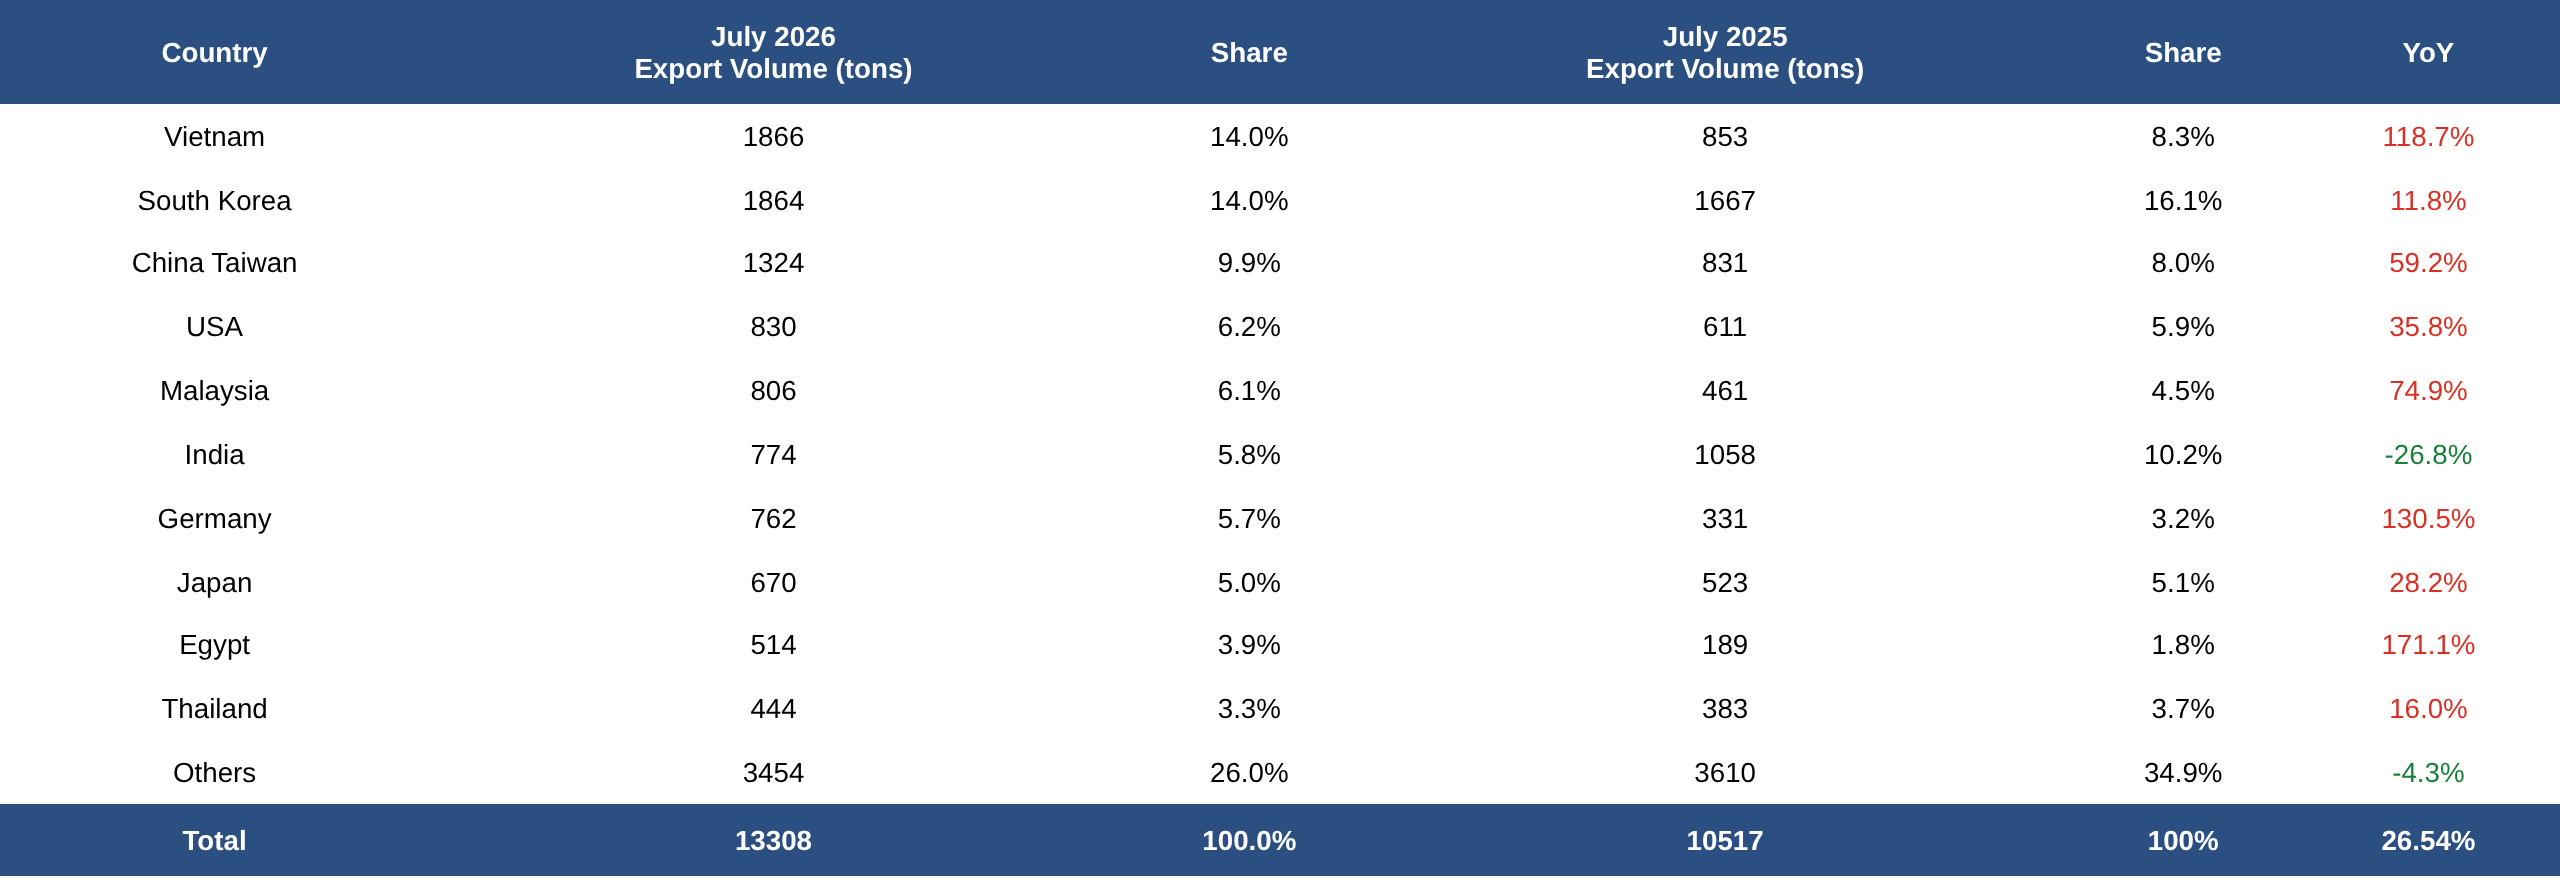
In July 2026, China’s exports of copper plate/sheet and strip pulled back MoM, but maintained double-digit high growth YoY. Overall, export markets remained strong. Specifically,Vietnam, South Korea, and Taiwan, China still ranked as the top three export destinations for China’s copper plate/sheet and strip in July, with a combined share of 38%, serving as the most core export markets for China’s copper plate/sheet and strip. Growth varied significantly across segmented markets.Egypt, Germany, and Vietnam rose 171.1%, 130.5%, and 118.7% YoY, respectively,delivering standout performance as export orders were released strongly. Taiwan, China and Malaysia also posted relatively high increases, up 59.2% and 74.9% YoY, respectively. As a traditional key export market, South Korea maintained steady export growth, up 11.8% YoY. Demand in mature markets outside China such as the US, Japan, and Thailand was stable, with exports all sustaining positive growth. Some markets, however, showed weakening demand, with India seeing the most pronounced decline, down 26.8% YoY, while exports to other countries and regions edged down 4.3% YoY. Overall, demand diverged markedly across different regions outside China, with emerging markets making notable contributions to growth, and markets outside China overall showing ample resilience.
Data source: General Administration of Customs
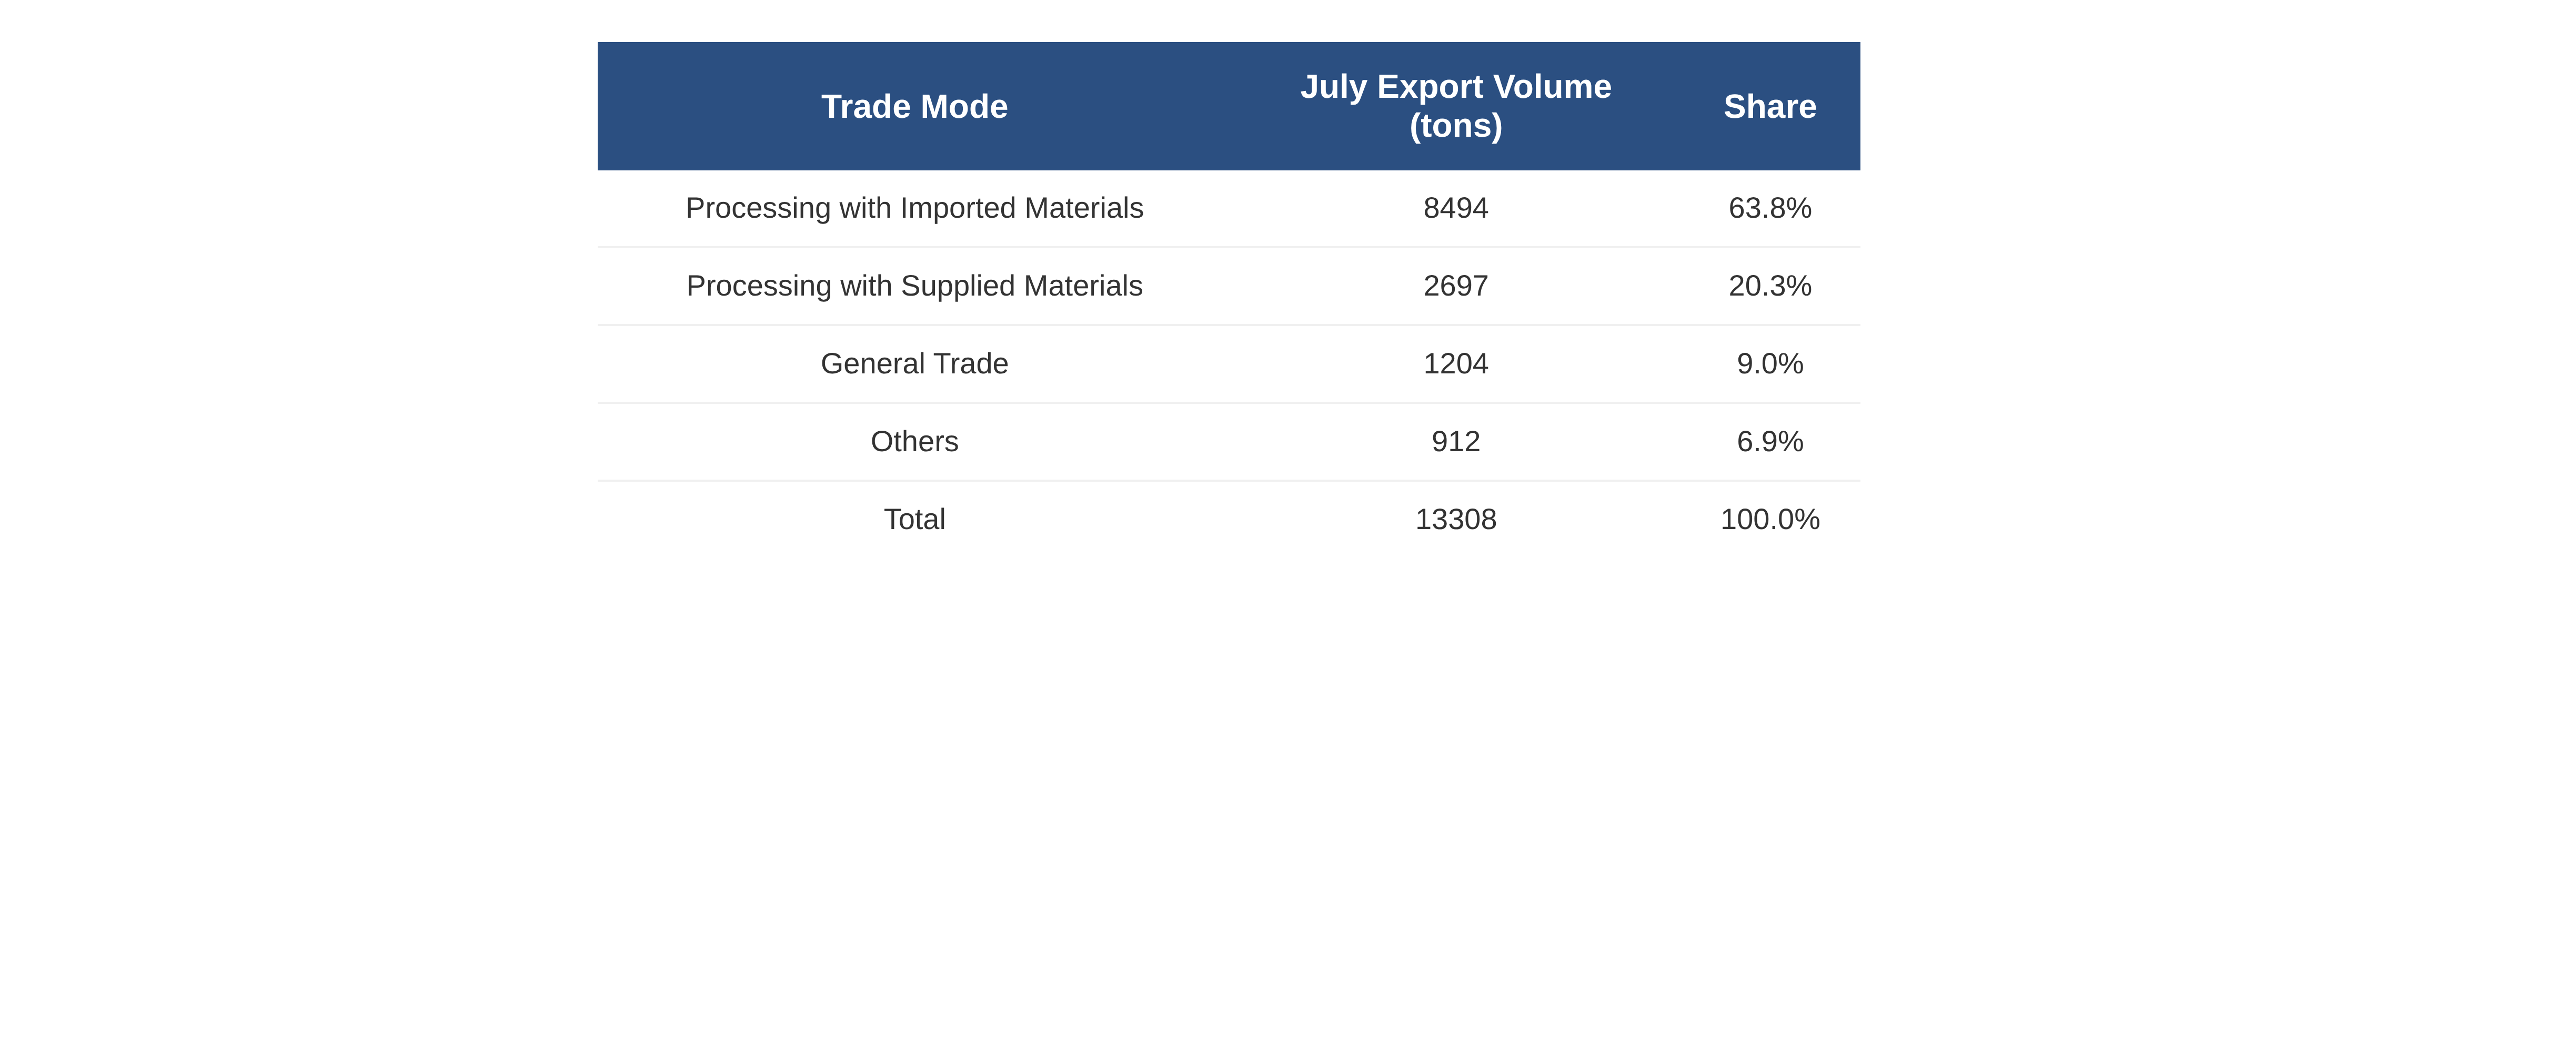
From the perspective of the export trade mode structure, the trade structure of China’s copper plate/sheet and strip exports largely maintained its original pattern. According to customs statistics, in July 2026, processing trade with imported materials remained the primary export channel for copper plate/sheet and strip, with exports of 8,494 mt, accounting for 63.8% of total exports; Processing and Assembling ranked second, with monthly exports of 2,697 mt, accounting for 20.3%; Ordinary Trade exports were 1,204 mt, accounting for 9.0%; other trade types totaled 912 mt, accounting for 6.9%.Processing trade with imported materials and processing trade with supplied materials together accounted for more than 80% of exports, and remained the core components of copper plate/sheet and strip exports.
Data source: General Administration of Customs
By product category, in July 2026, exports of all subcategories of copper plate/sheet and strip improved across the board YoY, but MoM trends diverged significantly. Copper strip continued to account for the largest share of exports, with monthly exports of 8,972 mt, representing 67% of total exports, up 25.4% YoY, but down 4.0% MoM; brass strip saw strong external demand, with exports of 2,183 mt, accounting for 16%, up 39.5% YoY, and edging up 0.9% MoM; bronze strip and cupronickel strip both achieved double-digit growth on both a YoY and MoM basis. Overall,major categories all maintained positive YoY growth. Copper strip remained the core support for exports, but weakened MoM, while brass, bronze, and cupronickel generally recovered MoM, with export orders showing relatively stronger resilience.

Data source: General Administration of Customs
(HS code 74091110, 74091190, 74091900, 74092100, 74092900, 74093100, 74093900, 74094000, 74099000)