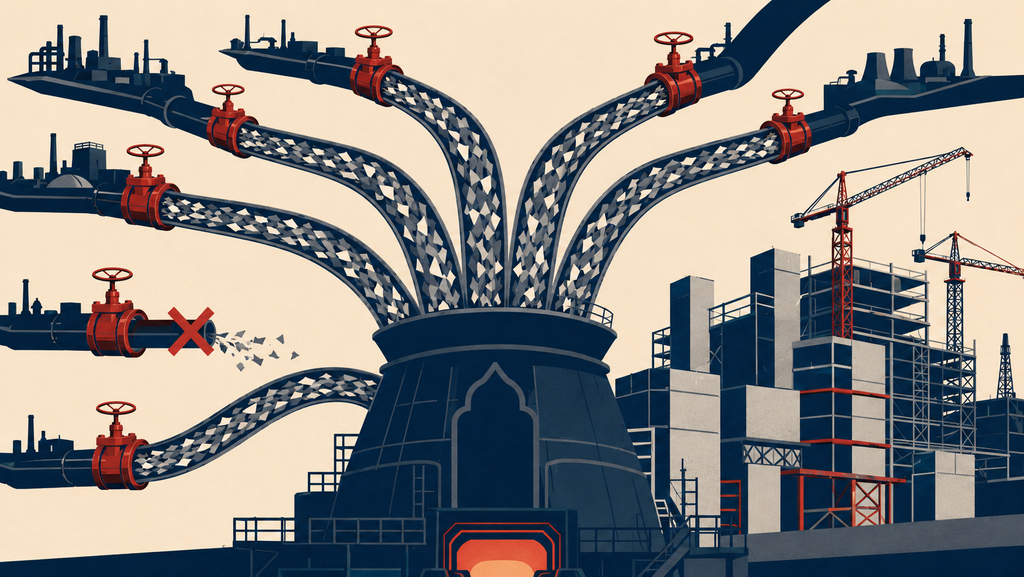
India is the world's largest importer of stainless steel scrap, and it has spent four years buying more of it at steadily lower prices. Yet in March 2026 the Indian Stainless Steel Development Association (ISSDA), the country's main industry body, asked New Delhi to permanently scrap import duties on scrap and ferroalloys and to designate chromium a critical mineral. The gap between what the trade data shows and what the industry is asking for says a great deal about how India sees the next decade.
Four years of rising volume and falling price
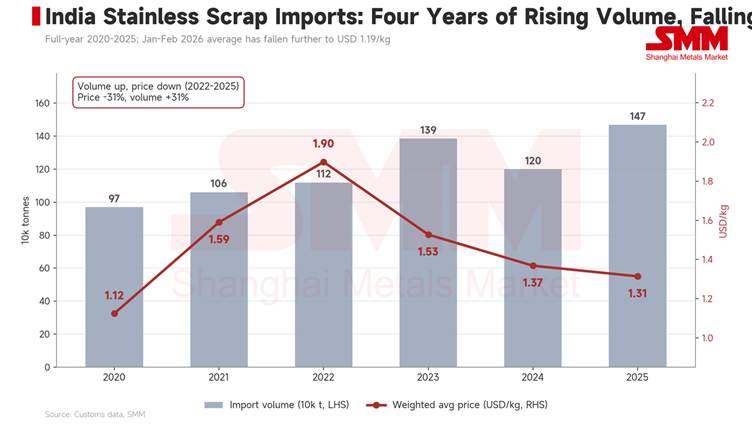
India has imported roughly 7.4 million mt of stainless scrap worth USD 10.8 billion since 2020. Over the rolling 12 months to February 2026 it took 1.42 million mt worth USD 1.82 billion: volume up 11.4% year on year, price down 6.6%. The weighted average has fallen from USD 1,898/mt in 2022 to USD 1,192/mt in early 2026, a 37% decline, while annual volume rose 31% over the same span.
The number of Indian companies importing scrap grew from 530 to 780 across the period, and the origin count has held steady at around 120 countries. This is not a market running short of supply.
Concentrated buyers, fragmented sellers
The clearest structural fact in the data is the asymmetry between the two sides of the trade. Over the past 12 months, India's top five buyers accounted for 47.1% of import volume and the top ten for 60.3%. On the supply side, the top five overseas sellers accounted for just 14.4%, and the top twenty only 35.2%.
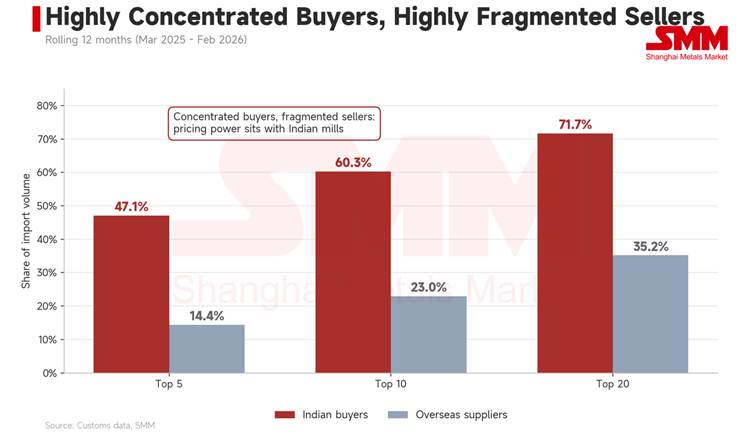
India's largest buyer sourced 274,000 mt from 115 different suppliers; the second-largest took 225,000 mt from 88. For mills of that size, no single overseas scrap merchant is difficult to replace. A softer nickel benchmark explains part of the four-year price slide. The rest is simply what a buyer's market looks like.
The anxiety is about tonnes, not dollars
On the surface, a buyer enjoying four consecutive years of falling prices asking for import protection looks contradictory. Placed inside India's capacity cycle, the two are the same thing. ISSDA is not worried about this year's price. It is worried about next decade's tonnes, and about who controls them.
India plans to lift stainless capacity from 7 million mt to 11 million mt. On a 300-series-weighted product mix, that increment implies at least another million-plus tonnes a year of scrap and alloy consumption. India currently meets only 15% to 18% of its own nickel demand; the position in chromium is comparable. Scrap is the only input in the chain that carries both nickel and chromium and can go straight into the furnace. Its role is not merely to lower cost but to substitute for resources India does not have.
Put differently, India is not buying scrap. It is buying nickel and chromium that someone else has already recovered.
The ownership of that recovered metal sits offshore, and the import mix confirms it. The grade structure has barely moved in six years: 304 at 52.7%, 400-series at 11.4%, 316 at 10.1%, and shredder-derived material steady near 24%. Stable structure means rigid demand, and it also means India's domestic collection system has not begun to take over. The only meaningful shifts are at the margins: 200-series has risen from 5.9% to 7.8%, a direct response to cost pressure, while 17-4PH precipitation-hardening scrap has climbed from 14,000 mt to 55,000 mt, tracking real expansion in Indian specialty steel, pump, valve and fastener capacity. Both are increments that must be met by imports.
A quarter of the "stainless scrap" is not really stainless
The 24% shredder-derived share deserves separate treatment, because it is not scrap in the conventional sense. It comes off automotive and appliance shredding lines: whole units are shredded, magnets pull out the iron, and sensor sorting then separates a nonferrous concentrate rich in stainless. Alongside stainless, that stream carries copper, brass, insulated copper wire, aluminium and zinc. The stainless content ranges anywhere from 40% to 90%, and the material carries no AISI grade at all.
Its Indian buyers are recyclers, not mills. They buy it to sort it a second time and sell the red metals separately. That explains an otherwise odd price: over the past 12 months this material averaged USD 1,372/mt against USD 1,321/mt for solid 304 melting scrap. A mixed stream roughly half stainless trades above pure 304 because its price anchor is copper, not nickel.
Roughly a quarter of India's 7.4 million mt, in other words, is not a purchase of stainless steel. It is a purchase of someone else's pre-sorted urban mine.
Two buying strategies, two different bets
India's two largest buyers approach the market in almost opposite ways, and the contrast carries more information than the headline volumes.
The largest bought 274,000 mt over the past 12 months, up 45.1% year on year and the single biggest volume move in the market. It pays an average USD 1,400/mt, buys mainly European and American material, and sources from Thailand, the Netherlands, the United States and Italy. It has formed a de facto exclusive relationship with one European scrap merchant that supplies through four separate legal entities in different jurisdictions, together 114,000 mt. Four corporate names serving one buyer is a structure built for a long-term supply relationship.
The second-largest took 225,000 mt, up 13.1%, at an average USD 1,110/mt — fully 26% below the first. It runs an Asian low-cost strategy sourced from Thailand, Vietnam, South Korea and Turkey, and its channel is narrower: a single supplier accounts for 30% of its purchases.
The line worth watching is elsewhere. This mill's own Middle East trading arm supplied nothing in the prior 12-month period and 19,100 mt in the latest one. A mill that starts building its own scrap trading entity usually has one reason: it no longer wants to leave the channel margin with a third party. If that curve keeps rising, the 30% exclusive position is likely to be broken up.
One buyer is locking suppliers in. The other is prising them apart. Same market, two responses, two different bets.
Origins are being reshuffled
The regional picture is undergoing the largest shift of this cycle. Comparing the latest 12 months with the prior 12, the Middle East went from 11.8% to 15.6% of India's imports. Turkey rose 91% year on year, Bahrain 209%, the Netherlands 79% and Saudi Arabia 33%. Southeast Asia fell from 32.2% to 28.1%, with Malaysia down 30%, the UAE down 22%, Singapore down 16% and South Korea down 10%.
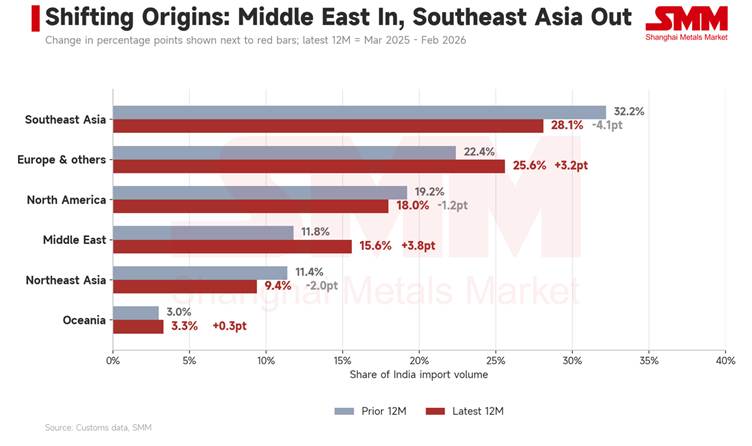
One origin has not moved at all. The United States supplied 192,300 mt in the latest 12 months against 191,700 mt in the prior period, up 0.3%. It also dominates the shredder-derived segment, supplying 109,000 mt or 37% of India's intake of that material, with the UK, Germany, Canada and Australia contributing another third between them. That origin list is essentially a list of developed economies, for an obvious reason: only countries with large end-of-life vehicle volumes and the capital to run shredding and sensor-sorting lines can produce the material at all.
There is also a measurement trap worth flagging. Among the 113,000-odd shipments where both the exporter's country of registration and the cargo's country of origin can be compared, exactly half do not match. The most common intermediary jurisdictions are the UAE and Singapore, followed by the United States, Hong Kong and the Netherlands. Ranking India's scrap origins by exporter location produces badly distorted results. A passport and a birthplace are not the same thing.
Malaysia shows what supply risk actually looks like
Malaysia is the one decline in the data with a clear, identifiable cause, and it is the most instructive story in this dataset.
Malaysia raised its scrap export tax from zero to 15% in March 2021, with the stated aim of securing raw material for domestic steel mills. In the four years that followed, India's imports of Malaysian stainless scrap rose rather than fell, from 51,000 mt to 101,000 mt in 2024. The curve tells its own story: the tax raised costs without closing the door. Misdeclaring scrap as machinery or as other untaxed metal categories remained a workable route around it.
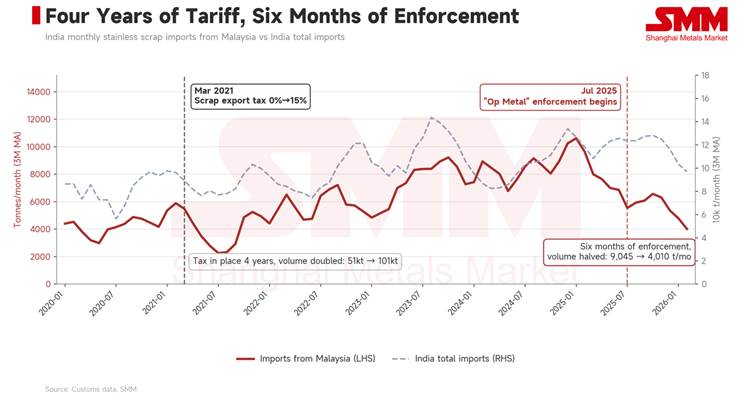
The turning point came in July 2025, when the Malaysian Anti-Corruption Commission launched a multi-agency operation codenamed "Op Metal" targeting exactly those misdeclaration networks. Officials put six years of lost tax revenue above RM 950 million (approximately USD 233 million) and said assets exceeding RM 332 million (approximately USD 82 million) had been frozen or seized.
The trade data changed immediately. India imported 49,800 mt from Malaysia in the first half of 2025 and 36,700 mt in the second, a 26% decline. By January and February 2026 the monthly average was barely 4,000 mt, half the 2024 second-half rate. Over the same period India's total imports were still rising, with 745,000 mt in the second half of 2025 against 724,000 mt in the first.
The contraction was origin-specific and policy-driven. Indian demand was not the problem.
The real information sits in the timing gap. The tariff stood for four years and export volumes doubled; enforcement ran for six months and volumes halved. For any country dependent on imported scrap, that is an uncomfortable reminder: an upstream government's tax schedule means very little, while its willingness to enforce means a great deal. The second variable has never been within the buyer's control.
Open upstream, walled downstream
One figure deserves to be read on its own. Over the past 12 months, India imported 100 mt of stainless scrap from mainland China and nothing at all from Hong Kong or Taiwan. In a market spanning 152 origins and 7.4 million mt, China is effectively absent.
In finished products the position is inverted. The other half of ISSDA's submission asks the government to strengthen defences against low-priced Chinese material and warns about Chinese product entering India transshipped through Vietnam and other third countries. India's stainless imports passed 100,000 mt in April 2026, up 65% year on year, with Chinese shipments to India doubling from a year earlier.
That is the real shape of Indian stainless policy: open on raw materials, walled on finished goods. It is not policy drift but standard industrial cultivation — loosen upstream, build downstream, and buy time for domestic capacity to climb the ramp.
The difficulty is that this logic is highly sensitive to the time window. India's Quality Control Order exemption for stainless has been extended to 31 March 2027, and mandatory certification for flat products has been pushed back repeatedly. Each extension has been justified on the same ground: domestic supply of 200-series and 300-series flat products still falls short and local capacity has not taken over.
The wall is half built. The mills behind it are not finished.
Outlook
Cheap has never meant secure. India genuinely holds the pricing power here — two mills facing a hundred substitutable suppliers each, with prices down 37% in four years. But pricing power and resource control are different things. Every tonne India buys is nickel and chromium produced by someone else's recovery system: someone else's dismantling yards, sorting lines and logistics networks. The more smoothly India buys, the more it confirms that it has not yet built that system itself.
Malaysia has already run the demonstration. When an exporting country genuinely decides to keep its scrap at home, India's supply drops by a third and there is little India can do about it. This time the Middle East and Europe filled the gap. Next time they may not.
Removing duties can secure a channel and designating chromium a critical mineral can raise its priority, but neither changes the underlying fact: a country's raw material security is not determined by whether it can buy cheaply, but by what it still has when others stop selling.
For an industry preparing to push capacity to 11 million mt, the number to watch may not be the tariff schedule at all. It is when India's own scrap recovery rate starts to rise. That figure is not yet visible.
Written by Bruce Chew
Nickel & Stainless Steel Analyst, Shanghai Metals Market
Email: bruce.chew@metal.com
Tel: +601167087088
![[SMM Stainless Steel Market Flash] Outokumpu: Freight and Fuel Costs Are Eating the Gains From EU Trade Measures](https://imgqn.smm.cn/usercenter/KFwsY20251217171734.jpg)
![[SMM Stainless Steel Market Flash] India's Jindal Stainless Wins Three Quality Awards at TQM Convention 2026](https://imgqn.smm.cn/usercenter/CjEnN20251217171733.jpg)
![[SMM Stainless Steel Market Flash] Aperam Says European Margins Were €75/t Before EU Trade Measures](https://imgqn.smm.cn/usercenter/biBGl20251217171733.jpg)