July 23, 2026
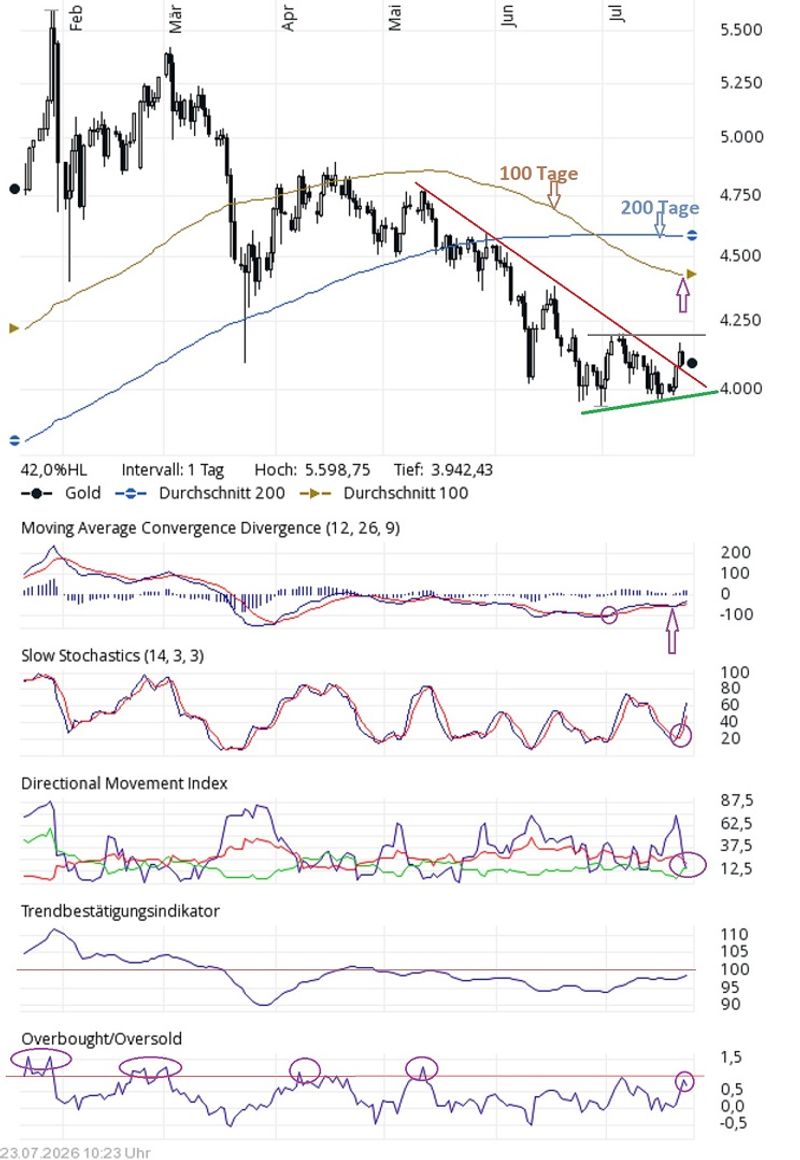
From a technical perspective, the gold price is showing early signs of stabilization. After once again finding strong support at the US$4,000 level, several chart signals now suggest that the correction which began in May may be losing momentum. A growing number of technical indicators are pointing toward the possibility of a trend reversal.
Gold Breaks Above Key Downtrend Line
One of the most encouraging developments is gold's breakout above the downtrend line that had capped prices since May. At the same time, the series of progressively lower lows came to an end in late June. Instead, the chart has started to establish a modest upward trendline, indicating that the technical picture is gradually improving.
The next key resistance level is located near US$4,200, corresponding to the previous swing high. A sustained move above this level would provide further confirmation that the broader uptrend is reasserting itself.
The moving averages also suggest that downside momentum is fading. The 200-day moving average has been trading almost flat for the past two months, reflecting a neutral long-term trend. Meanwhile, the 100-day moving average, which had declined steadily since mid-May, has also flattened during the past few trading sessions, indicating that the recent downward move may have run its course.
Momentum Indicators Continue to Improve
The MACD generated a buy signal earlier this month when its signal line crossed to the upside. Despite a brief period of weakness, the indicator remains in bullish territory. The Stochastic Oscillator has also produced a fresh buy signal in recent days.
A similar pattern can be observed in the Directional Movement Index (DMI). While the sell signal generated in April technically remains in place, the positive DMI line has now moved close to crossing above the negative line. At the same time, the strength of the previous downtrend has weakened significantly, suggesting that selling pressure is continuing to fade.
The trend confirmation indicator has also turned higher and is approaching the neutral 100-point level. A move above that threshold would constitute another technical buy signal.
The only indicator that still warrants close attention is the Overbought/Oversold Indicator. Although the market is formally considered overbought only above a reading of 2.0, gold has repeatedly entered corrective phases over the past six months after readings moved above 1.0. At present, however, there is little reason for concern, as the indicator has remained below the 1.0 threshold and has recently begun to ease again.
Overall, the technical picture increasingly suggests that the recent correction is approaching its end rather than signaling the beginning of another significant downward move.