I.China monthly sulfur imports (2025–2026, Jan–Jun)
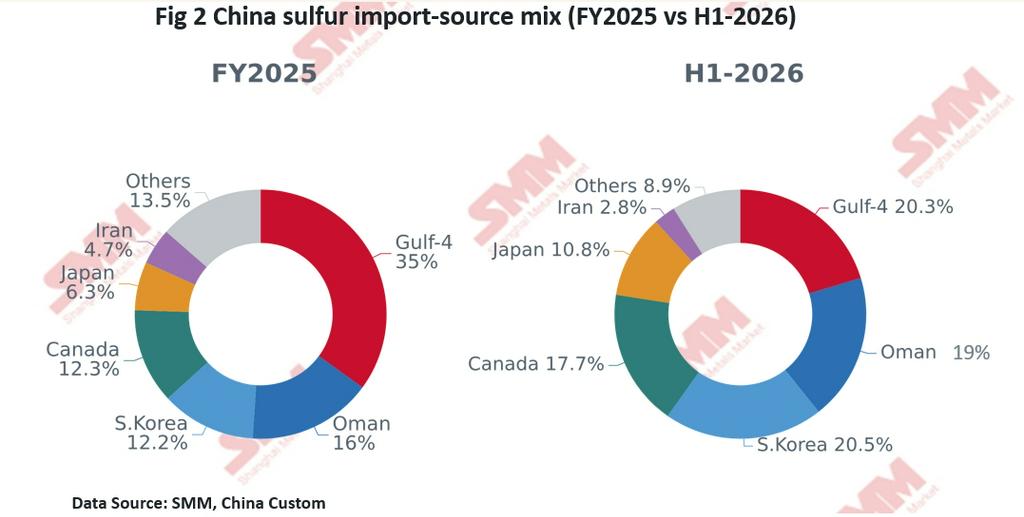
In H1-2026 China's sulfur imports accelerated their contraction. Cumulative Jan–Jun imports were ~2.26 Mt, down 57.7% from ~5.34 Mt a year earlier; the monthly average fell from ~0.80 Mt in 2025 to ~0.38 Mt.
Monthly, Jan–Mar held around 0.50 Mt (0.50 / 0.54 / 0.52 Mt); a cliff set in from April — 0.30 Mt in April, 0.27 in May, and just 0.147 Mt in June (−85.1% YoY), under one-fifth of the year-earlier level.
Full-year 2025 imports were ~9.61 Mt (avg ~0.80 Mt/mo), and June's 0.147 Mt is a multi-year low. If the geopolitical conflict and Kazakhstan's export ban persist, H2 imports may weaken further — full-year 2026 is on track for only ~40% of 2025.
II.China sulfur import-source mix (FY2025 vs H1-2026)
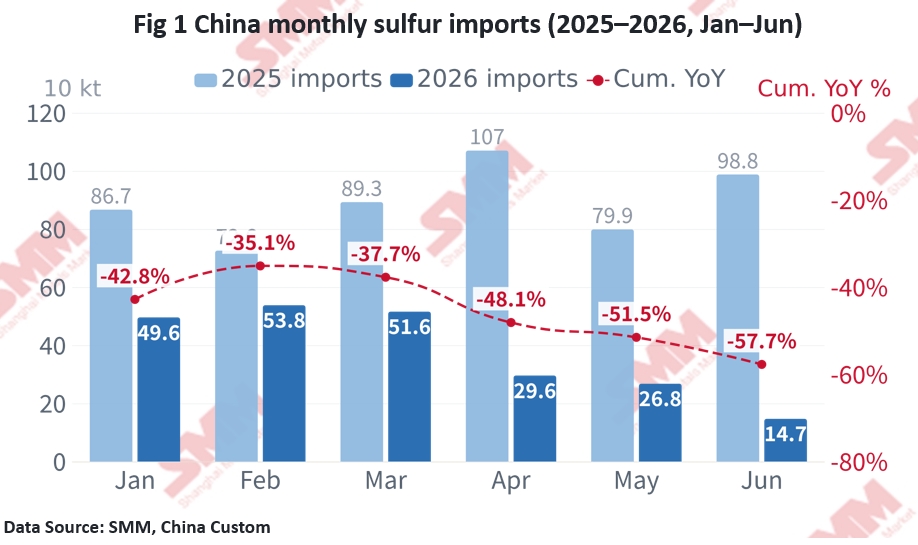
China's sulfur import-source mix was fundamentally reshaped in H1-2026. In 2025 total imports were ~9.61 Mt, highly concentrated in the Middle East — Saudi Arabia, UAE, Qatar and Kuwait together ~35% (Oman another ~16%); sanctioned Iran was only ~4.7%, in sporadic cargoes.
In H1-2026 the Gulf-4 share halved to ~20%. South Korea jumped to #1 at ~0.46 Mt (20.5%), Oman ~0.43 Mt (19.0%) and Canada ~0.40 Mt (17.7%) — together ~58% — becoming the core alternative suppliers, with Japan (10.8%) close behind. Notably, Iran shipped ~62 kt directly in April (via Hainan), its first large direct arrival since the conflict, showing some cargoes have transited the Strait.
Behind this is the double shock of the Hormuz closure and Kazakhstan's export ban. The halving of the Middle-East share passively narrows China's geopolitical exposure, but the stability, price and durability of alternative sources remain to be seen.
III.China monthly sulfuric-acid exports & the export ban (2025–2026, Jan–Jun)
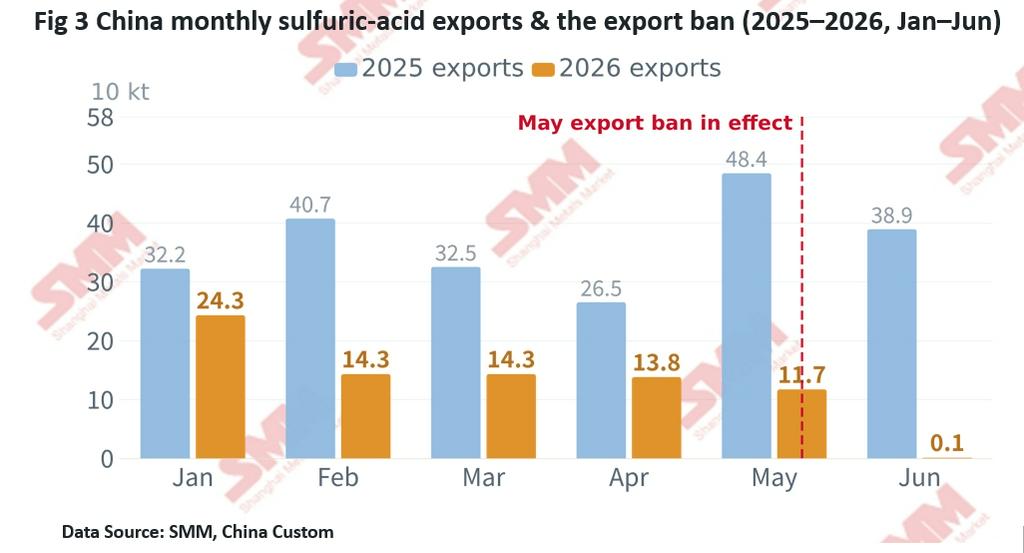
China's sulfuric-acid exports show a gradual decline then a June cliff to zero. Cumulative H1-2026 exports were ~0.78 Mt, down 64.2% from ~2.19 Mt a year earlier.
2026 exports weakened month by month: 0.24 Mt in January, easing to 0.11–0.14 Mt over Feb–May, then collapsing to ~980 t (0.001 Mt) in June — −99.7% YoY, ~−99% MoM, as export controls / quota cuts took hold and acid "stayed domestic".
Versus 2025 (full-year ~4.65 Mt, avg ~0.39 Mt/mo, peaking at 0.525 Mt in December), H1-2026 was only ~36% of the year-earlier level, and June (0.001 Mt) was under 0.3% of June-2025 (0.389 Mt).
Destinations reshaped too: 2025 was led by Chile (32.4%), Indonesia (14.7%), Morocco / Saudi (~12% each); in H1-2026 Indonesia (HPAL nickel) jumped to #1 (28.0%), Chile fell to 18.4%, Saudi / India ~13% each. Buyers highly dependent on Chinese acid (e.g. Chile, ~one-fifth of its copper output uses acid) face direct supply-chain pressure, reshaping global acid trade.
IV.Core Conclusion:
- Sulfur imports: Volume cliff, source reshuffle — H1-2026 imports ~2.26 Mt (−57.7% YoY; June −85%); the Gulf-4 share halved (~35% → ~20%), replaced by S.Korea / Oman / Canada (~58% combined).
- Acid exports: Ban to zero — H1-2026 exports ~0.78 Mt (−64% YoY); June only ~980 t (−99.7% YoY), a cliff exit; Indonesia becomes the top destination.
- Common logic: Geopolitical conflict + export controls together — China shifts from a "global sulfur hub" to "self-protective contraction".
![[SMM Analysis]"China Introduces New Consumption Tax on Batteries, Exempting Sodium-Ion and Solid-State Tech"](https://imgqn.smm.cn/usercenter/JMINH20251217171728.jpg)