1 July, 2026
Executive summary
In one of the most dramatic starts to any year, gold soared to record highs in January, crossing above US$5,500/oz intraday before dipping below US$4,000/oz in late June. Down roughly 7% year-to-date, gold nonetheless ranks among the top performers over the past year, as other assets play catch-up. The first half of 2026 showed that gold remains sensitive to heightened geopolitical concerns and abrupt shifts in investor sentiment. It also showcased the growing relevance of Asian markets in gold price discovery.
At current levels, gold’s price is broadly in line with a global backdrop of moderate growth, cooling but still elevated inflation, and expectations of further – but limited – central bank tightening. Under these conditions, gold will likely stay relatively rangebound (±5%). But the stage is set for a possible breakout. On the upside, clear catalysts – a worsening economy or renewed geopolitical shock, a shift towards lower interest-rate expectations, or a wave of dip buying – could reignite gold’s momentum and lift it back towards US$4,500/oz or above. If the signals are strong, gold could push even higher. Conversely, an environment of resilient growth, rising yields, and calmer markets could see gold slip further – though a fall of more than 10% from current levels may be tempered by bargain-hunting demand.
Meanwhile, enduring central bank demand and policy shifts in key markets like India are additional wildcards that could subtly influence gold’s path in the second half.
Chart 1: Gold’s current price is in line with macro consensus expectations but deviations from this environment can resume gold’s upward trend or bring price consolidation
H2 2026 implied gold performance based on hypothetical macroeconomic scenarios*
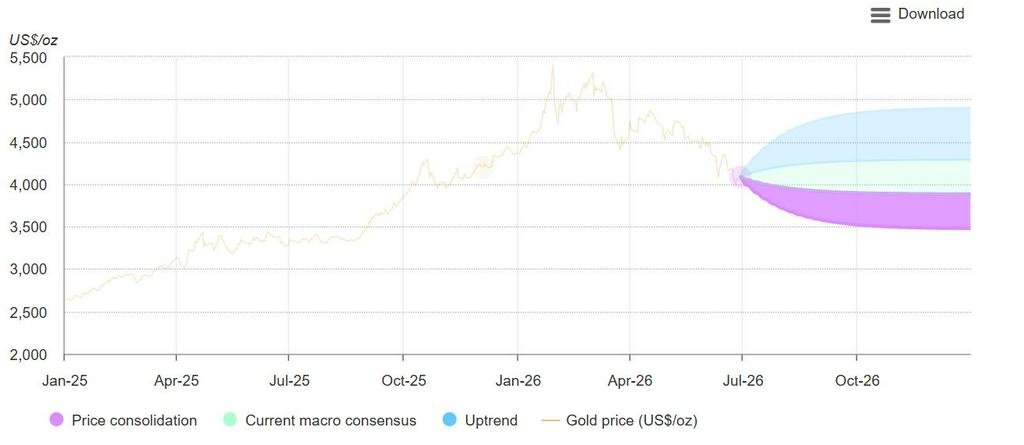
Sources: Bloomberg, ICE Benchmark Administration, Oxford Economics, World Gold Council; Disclaimer
*Historical data based on the LBMA Gold Price PM in USD as of 26 June 2026. Ranges are not price forecasts but hypothetical illustrations of the potential scenario outcomes based on our Gold Valuation Framework. ‘Macro consensus’ implies a range between -5% and 5%; ‘Uptrend’ implies 5% to 20% upside; ‘Price consolidation’ implies 5% to 15% downside. The reference point is the average LBMA Gold Price for the week ending 26 June 2026. For more details, see Table 3.
Login or register to keep reading...
Login or register to read the text, view charts and download the files..
Registration is free, quick and easy. It gives you access to all downloads on this website.
source:https://www.gold.org/goldhub/research/gold-mid-year-outlook-2026