SMM June 24 News:
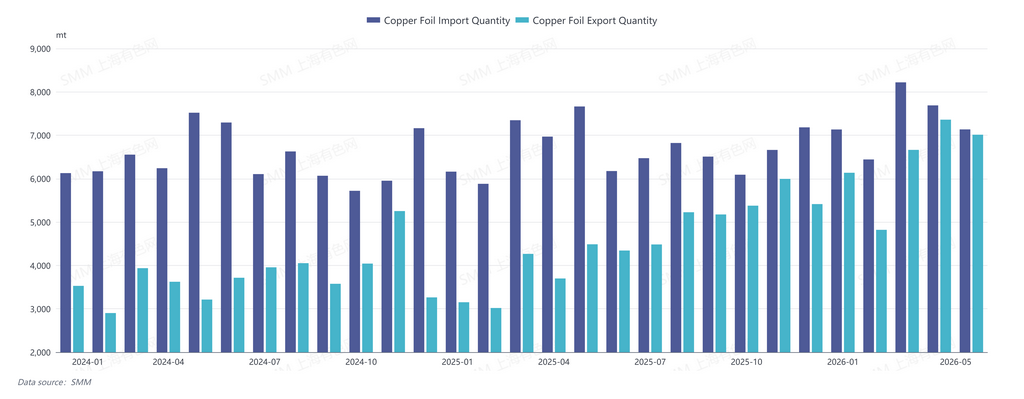
According to data from the General Administration of Customs, China's copper foil (HS codes: 74101100, 74102190) imports 7,135.43 mt in May 2026, down 6.90% YoY and down 7.20% MoM. From January to May 2026, cumulative copper foil imports reached 36,620.91 mt, up 7.63% YoY.
China's copper foil exports totaled 7,013.31 mt in May 2026, up 56.29% YoY and down 4.71% MoM. From January to May 2026, cumulative copper foil exports reached 31,993.17 mt, up 71.79% YoY.
China's copper foil import value amounted to $159.1572 million in May 2026, up 19.07% YoY and down 3.71% MoM. From January to May 2026, cumulative copper foil import value reached $772.4931 million, up 32.03% YoY.
China's copper foil export value totaled $113.2580 million in May 2026, up 93.40% YoY and down 4.46% MoM. From January to May 2026, cumulative copper foil export value reached $512.2296 million, up 114.78% YoY.
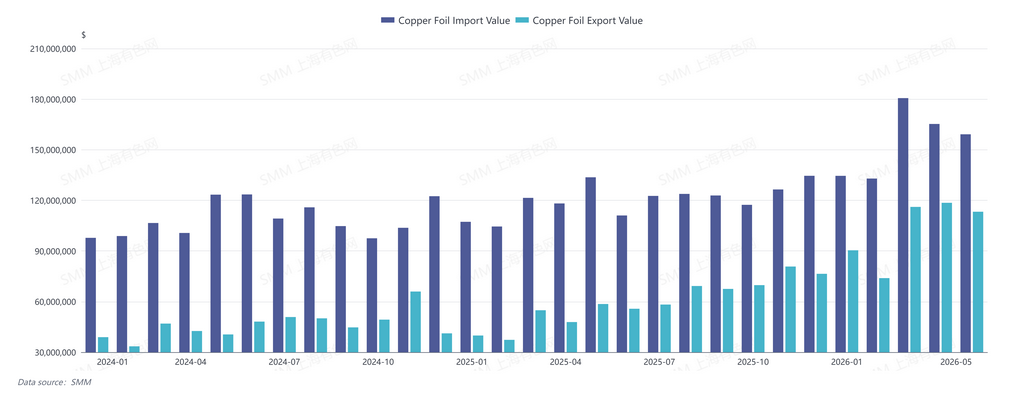
In May 2026, China's copper foil trade deficit was approximately $45.9 million, narrowing by about $830,000 MoM from $46.73 million in April 2026.
By trade mode, China's copper foil imports via Ordinary Trade were 5,306.49 mt; processing trade with supplied materials, 120.96 mt; processing trade with imported materials, 856.33 mt; and other trade modes, 851.65 mt in May 2026.
China's copper foil exports via Ordinary Trade were 1,333.29 mt; processing trade with supplied materials, 1,573.08 mt; processing trade with imported materials, 3,674.83 mt; and other trade modes, 432.11 mt in May 2026.
By country/region, the top copper foil import sources for China in May 2026 were Taiwan, China, Malaysia, and Indonesia, with import volumes of 4,160.08 mt, 910.03 mt, and 827.56 mt, respectively.
The top copper foil export destinations for China in May 2026 were Thailand, South Korea, and Malaysia, with export volumes of 1,580.88 mt, 852.93 mt, and 643.14 mt, respectively.
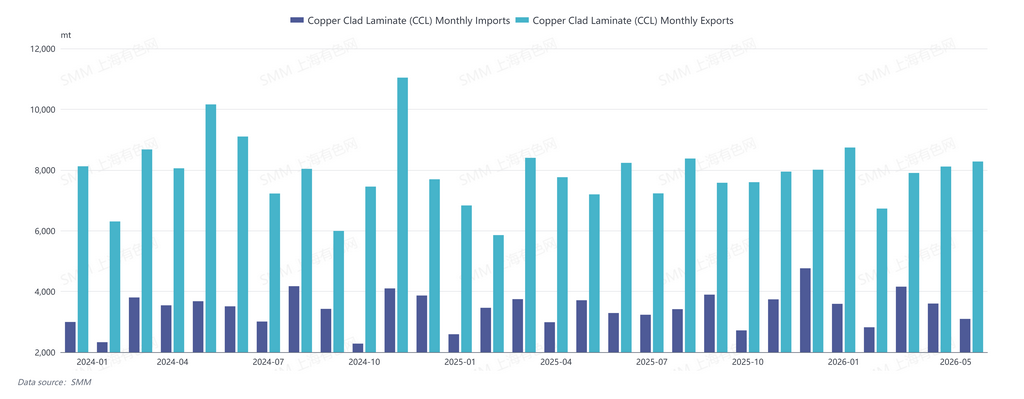
China's copper clad laminate (CCL) (HS code: 74102110) imports stood at 3,096.38 mt in May 2026, down 16.56% YoY and down 14.03% MoM. From January to May 2026, cumulative CCL imports reached 17,269.55 mt, up 4.67% YoY.
China's CCL exports totaled 8,279.04 mt in May 2026, up 15.03% YoY and up 2.05% MoM. From January to May 2026, cumulative CCL exports reached 39,764.00 mt, up 10.31% YoY.
In May 2026, China's copper foil imports continued to shrink, and exports pulled back somewhat, with both imports and exports declining MoM, while the trade deficit continued to narrow. On the import side, the SMM copper foil operating rate stood at 90.31% in May. As the capacity utilization rate and shipments of Chinese copper foil enterprises kept climbing, the import landscape showed that import demand for low and mid-end copper foil kept shrinking, while insufficient self-sufficiency in high-end products still created rigid demand.
On the export side, although exports slowed seasonally in May, they remained at a high level, and the YoY increase in January-May 2026 was significant. After a concentrated surge in AI-related orders, Japanese, Taiwanese, and other enterprises shifted their capacity toward high-end electronic circuit copper foil, creating a supply gap in traditional electronic copper foil and offering export opportunities for Chinese enterprises.
![The sharp pullback in copper futures boosts end-user procurement, buying and selling sentiment heats up, and the spot discount narrows [SMM North China Spot Copper].](https://imgqn.smm.cn/usercenter/pJSbE20251217171713.jpeg)
![Night Session SHFE/LME Price Ratio Improves, Morning Yangshan Copper Premiums Rise [SMM Yangshan Spot Copper]](https://imgqn.smm.cn/usercenter/Fxolk20251217171712.jpg)
![Copper prices continued to decline, suppliers began to hold prices firm and sell, and spot premiums bottomed out. [SMM South China Copper Spot]](https://imgqn.smm.cn/usercenter/jlrsy20251217171711.jpg)