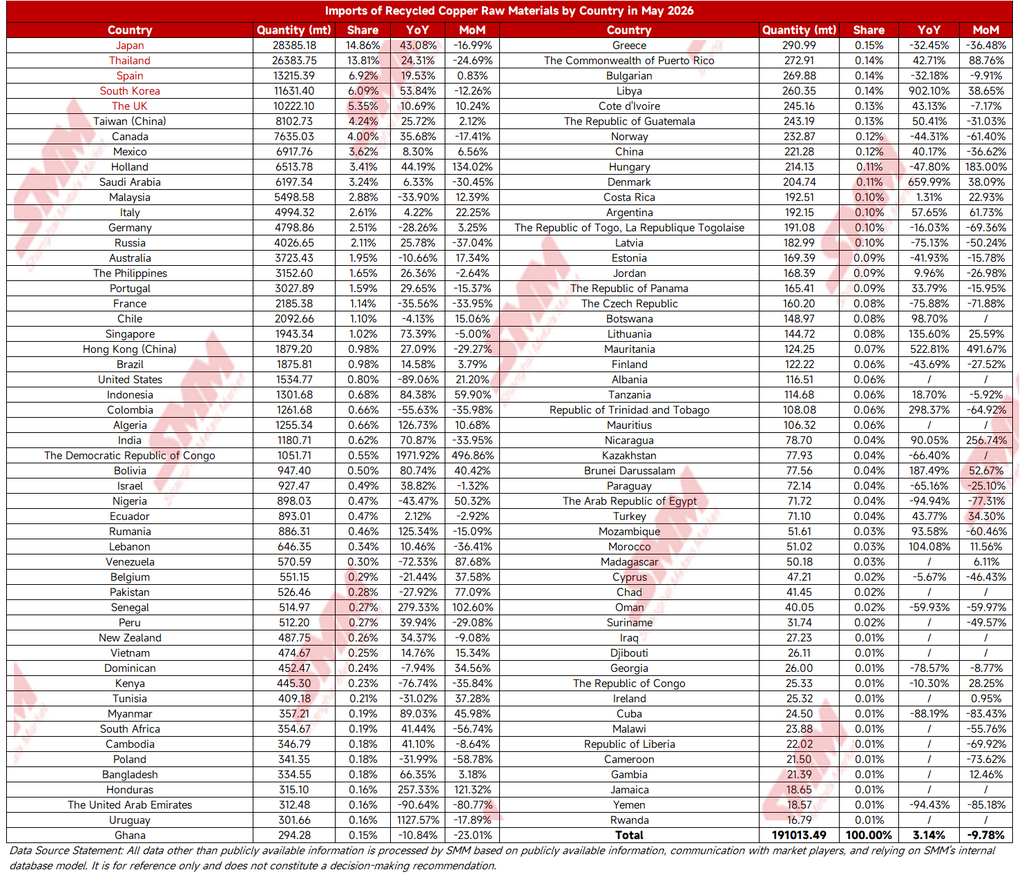
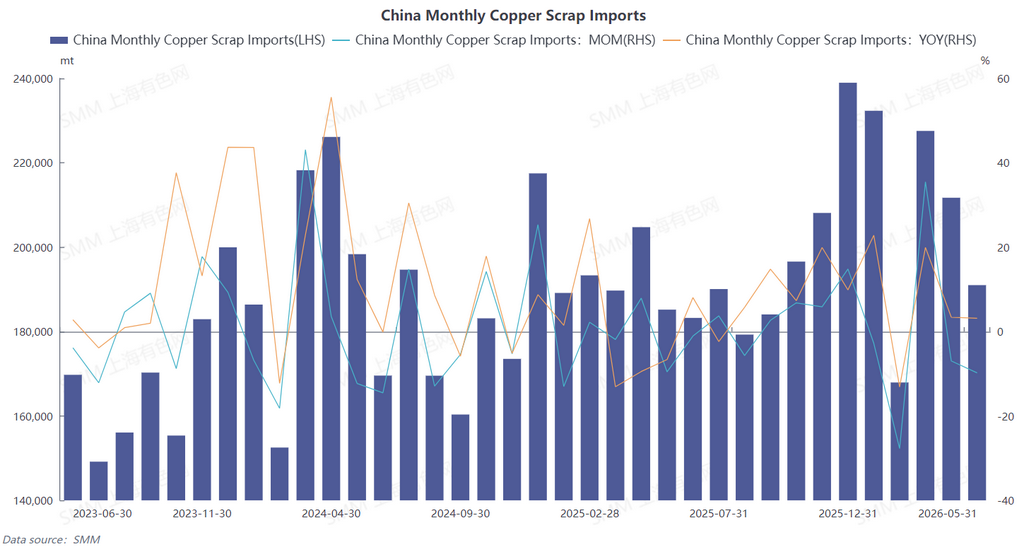
In May 2026, China imported 191,000 mt in physical content of copper scrap and shredded copper scrap, down 9.78% MoM but up 3.14% YoY. Cumulative imports from January to May reached 1.0306 million mt in physical content, up 7.11% YoY. (HS code: 74040000)
1. Shipments from top suppliers pulled back across the board; tightening overseas spot supply was the core driver of the decline
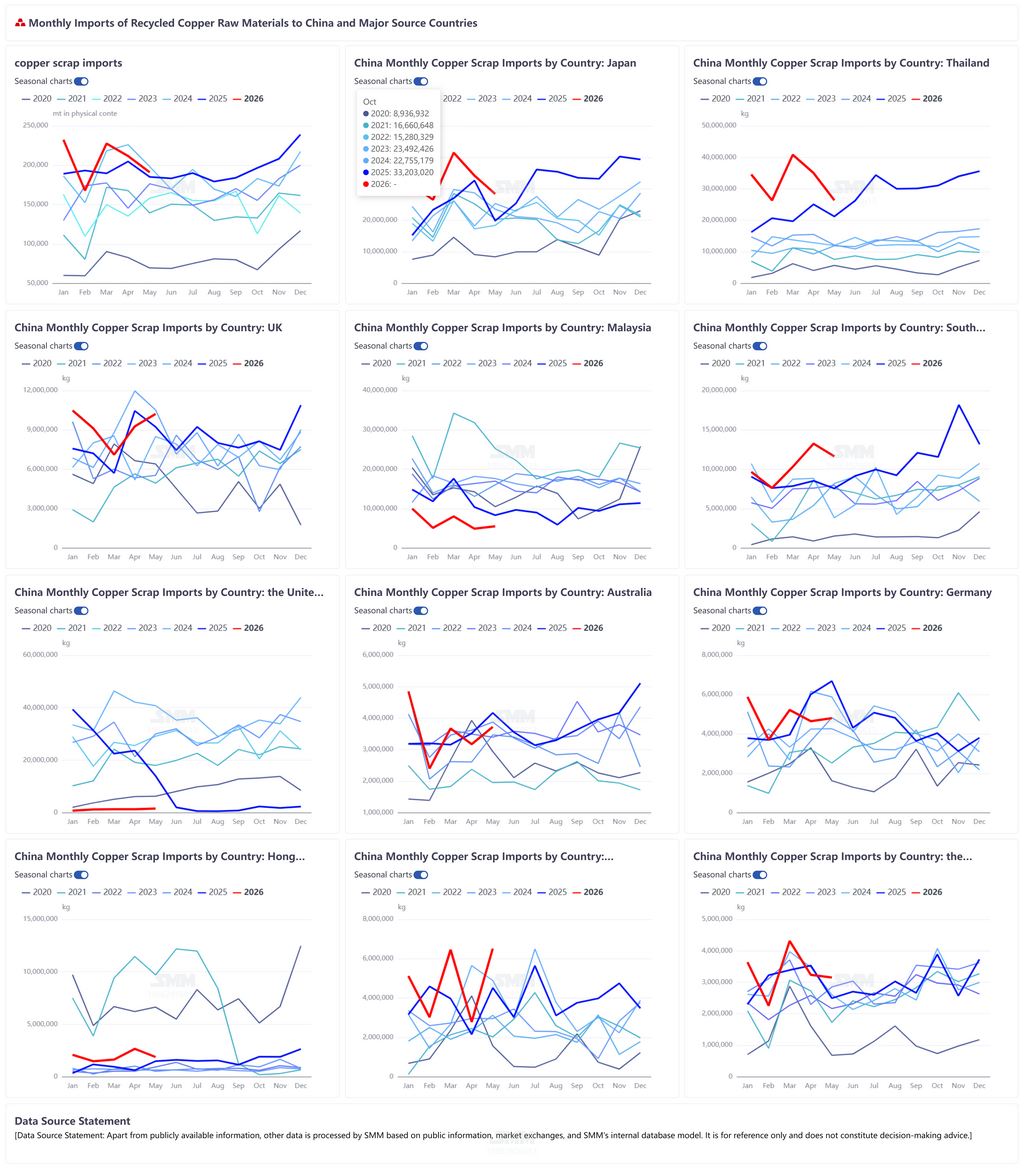
The tier structure of import source countries remained unchanged in May. Japan and Thailand stayed China’s largest and second-largest import sources, but shipments from both core suppliers to China dropped sharply MoM. Reduced exportable overseas supply was the fundamental reason behind the overall import decline:
Japan: Supplied 28,400 mt in physical content to China in May, accounting for 14.86%, up 43.08% YoY, down 16.99% MoM. Domestic copper scrap collection entered the off-season in Japan, output from dismantling enterprises fell, and smelters there diverted exportable supply for their own use. The volume of spot cargo available for shipment to China shrank notably, leading to a significant MoM pullback in shipments to China.
Thailand: Exported 26,400 mt to China in May, accounting for 13.81%, up 24.31% YoY, down 24.69% MoM. Demand for copper scrap in Southeast Asia diverted supply, seasonal declines in collection-side output compounded the situation, and traders slowed their procurement pace. Shipments to China weakened MoM for the second consecutive month.
Spain: The third-largest supplier delivered 13,200 mt, accounting for 6.92%, up 19.53% YoY, up only 0.83% MoM.
Traditional major sources such as South Korea, Canada, Saudi Arabia, and Russia all saw MoM declines in arrivals, with supply tightening simultaneously across multiple countries. While niche suppliers such as Libya, Denmark, and Mauritania posted substantial YoY and MoM volume increases, their individual volumes were measured in only the hundreds of metric tons, accounting for less than 0.2% of the total. These incremental volumes were far too small to offset the decline caused by supply tightening from mainstream countries.
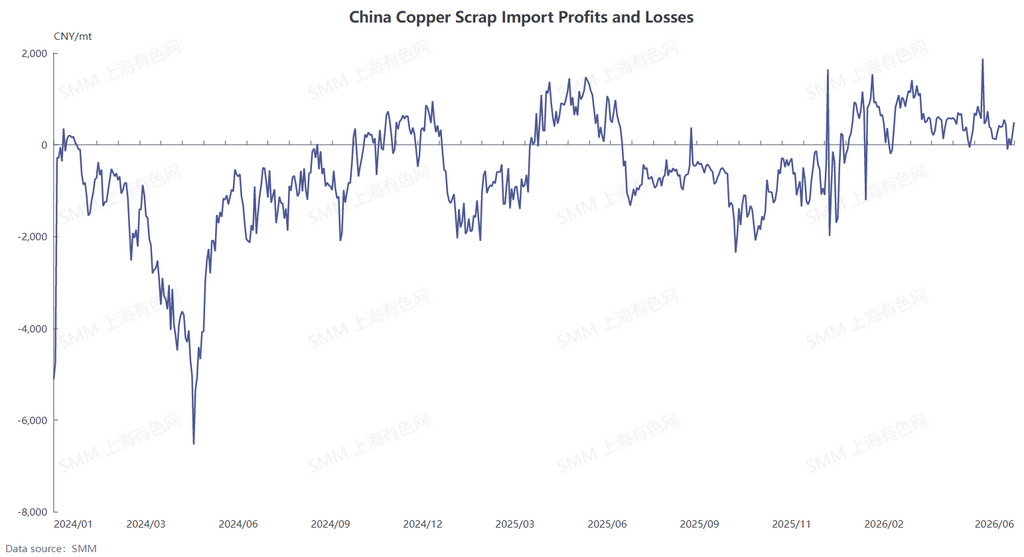
2. Import profit margins narrowed marginally, traders proactively slowed procurement pace
The SMM China copper scrap import profit margin curve shows that, although the import window remained profitable overall during April-May, profit margins compressed, weakening traders’ willingness to lock in cargoes proactively:
LME copper prices continued to fluctuate at highs, overseas suppliers were strongly inclined to hold prices firm, bare bright copper quotation coefficients stayed high, and overseas procurement costs rose. Compared with import profits seen in February-March, April-May offered only limited profitability. Traders proactively reduced forward overseas booking and cargo-locking volumes, slowed the pace of arrivals, and further amplified the MoM decline in imports for the month.
3. Structural shortage in China’s tax-inclusive copper scrap provided a floor, keeping import growth positive YoY
Imports in May still edged up 3.14% YoY. The core support came from China’s persistent shortage of compliant copper scrap: difficulties with documentation for circulating domestic copper scrap have yet to see material improvement, and the circulation volume of domestically traded copper scrap with proper documentation remained persistently tight, keeping tax-inclusive domestic trade prices high. Downstream copper processing enterprises, requiring both production stability and tax compliance, maintained solid rigid demand for overseas copper scrap with complete import customs documentation. Even as import profit margins thinned, enterprises still needed to maintain baseline import stockpiling, which is why imports did not turn negative on a YoY basis.
Two factors weighing on imports in the short term are likely to persist: first, supply-side collection activity in mainstream overseas supply countries is in the off-season, and exportable supply is unlikely to see significant incremental growth in the near term; second, import profit margins are expected to remain in thin-profit territory, and traders’ willingness to procure at scale proactively remains weak. Copper scrap imports are expected to remain in the doldrums in June. However, China’s shortage of tax-inclusive copper scrap supply is unlikely to ease in the short term, and emerging niche sources such as Libya and Tanzania continue to release incremental volumes. As a result, the probability of a sharp plunge in total imports is low, with the overall picture hovering at lows. (See below for a breakdown of May copper scrap imports by country)