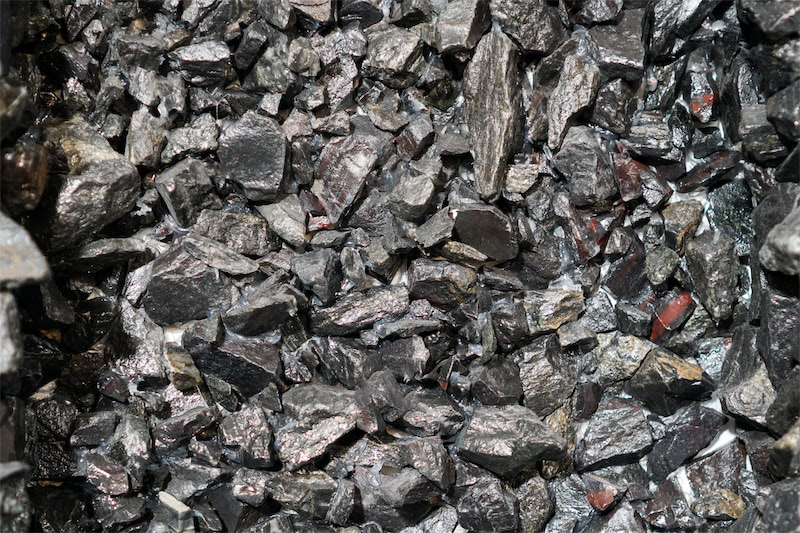
According to the latest release by the General Administration of Customs, SMM statistics show that China's total manganese ore imports in May 2026 stood at 2.7278 million mt, down 3.06% MoM and down 7.32% YoY. Total manganese ore imports for January-May 2026 reached approximately 14.4745 million mt, an increase of 2.699 million mt, or up 22.92% YoY (compared to approximately 11.7755 million mt imported in January-May 2025). Specifically, Australian ore was 489,500 mt, up 42.79% MoM; South African ore was 1.5865 million mt, up 3.15% MoM; Gabonese ore was 276,800 mt, up 36.8% MoM; Ghanaian ore was 171,800 mt, down 61.57% MoM; Brazilian ore was 132,900 mt, up 21.3% MoM; and Myanmar ore was 57,400 mt, down 0.68% MoM.
China's manganese ore imports in May 2026 fell on both a MoM and YoY basis, primarily due to the combined effects of weak demand, high port inventories, and cost and structural divergence. Downstream market, the domestic SiMn, high-carbon ferromanganese (FeMn), and other manganese alloy industries operated weakly overall in May. The end-user steel industry saw steady operating rates but sluggish just-in-time procurement, with steel mills pushing for lower prices and reducing purchase volumes for manganese alloys, leading to a buildup of finished product inventories and persistent profit compression at alloy enterprises. As a result, most domestic manganese alloy producers actively reduced their production operating rates, and overall willingness to stockpile raw materials cooled significantly, with small-lot, as-needed procurement becoming the mainstream, directly weakening the essential demand support for manganese ore imports.
Meanwhile, earlier manganese ore inventories at China's ports remained high, with the overall pace of destocking across the industry being slow. Both traders and producers mainly worked through existing inventories, avoiding the risk of restocking at high prices, and reduced forward and monthly import vessel bookings and arrival plans, further weighing on the total import volume in May. Looking at the structure of import sources, Ghanaian ore fell sharply by 61.57% MoM, while Australian, Gabonese, Brazilian, and South African ores, though showing MoM increases, saw limited gains that were insufficient to offset the decline brought by the overall demand weakness, ultimately causing May import volumes to pull back both MoM and YoY.
Total manganese ore imports in January-May 2026 were approximately 14.4745 million mt, a significant YoY increase of 22.92%, with the cumulative strong growth in stark contrast to the weak pullback in May. Thanks to rising ore prices early in the year, mines maintained high shipment levels, and coupled with concentrated restocking after the Chinese New Year in China, this drove a significant increase in imports over the first five months.
Furthermore, the Middle East situation drove up ocean freight rates, raising the CIF costs for Australian and South African ores, which also affected enterprises' short-term procurement pace and exacerbated monthly import fluctuations. Overall, manganese ore imports presented a pattern of "cumulative strength, monthly weakness," and the short-term outlook continued to depend on the strength of the recovery in downstream alloy demand and the pace of port inventory digestion.
![[SMM Hot-Rolled Arrivals] Arrivals in Both Markets Pulled Back This Period](https://imgqn.smm.cn/usercenter/UqlZJ20251217171717.jpg)
![[SMM Analysis] Electric Furnace Operating Rate Down 1.96% This Period](https://imgqn.smm.cn/usercenter/rBCZR20251217171716.jpg)