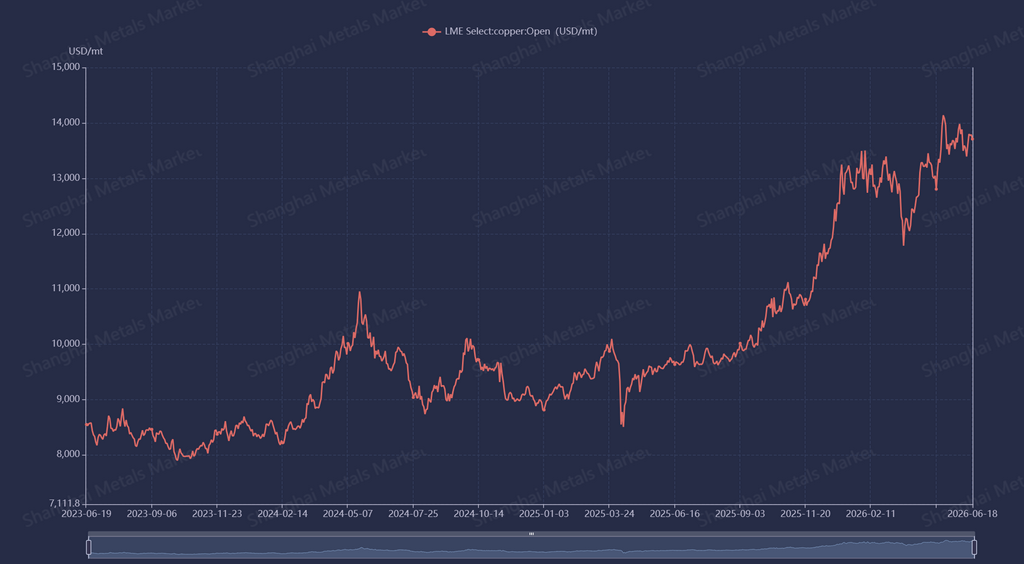
This week, LME copper prices fluctuated at high levels, briefly surging to a peak of $13,893.5/mt before retracing slightly, posting a weekly decline of approximately 0.6%. Despite elevated copper prices, overseas recycled copper offers remained firm. Quotations for bare bright copper held high at 98.5%–99% payability, while the payability range for No. 1 copper material scrap(Berry/Candy) was concentrated between 97%–98%. In contrast, offers for No. 2 ccopper material scrap(Birch/Cliff) showed distinct divergence. Driven by sustained high precious metal prices, smelters demonstrated a significantly higher tolerance for high-gold/silver content No. 2 copper, pushing its payability to 97.5%–98% even flipping to surpass No. 1 copper material scrap price. This specific high precious metal No. 2 scrap mainly originates from the Americas, making overall American No. 2 copper offers notably higher than those from other regions. Conversely, No. 2 copper from Japan, South Korea, and Southeast Asia faced relative pressure due to generally lower gold and silver content, with price ranges primarily clustered around 95%–96%.
From a fundamental perspective, the global recycled raw material market currently exhibits a gridlock defined by "weak supply and demand." On the demand side, skewed by low operating rates among Chinese recycled copper rod manufacturers and resistance to high prices, market liquidity for bare bright copper appeared slightly more sluggish compared to No. 1 and No. 2 scrap. On the supply side, scrap yards, traders, and downstream enterprises universally reported increasing difficulties in raw material procurement. One overseas scrap yard even noted that the delivery cycle post-ordering has stretched to nearly a month. Furthermore, macroeconomic headwinds have further dragged down the market. Traders in Japan and South Korea—major consumption markets for recycled copper raw materials, reported that the continuous depreciation of local currencies against the US dollar has driven up overseas procurement costs, prompting them to remain highly cautious. Meanwhile, the Japanese market is approaching its June 30 fiscal year-end settlement window, leading some companies to halt scrap intake ahead of schedule. Overall, this weak supply-demand dynamics is expected to persist in the short term.
Additionally, domestic copper scrap transaction prices in Japan and South Korea are heavily distorted by wild exchange rate fluctuations. Paradoxically, when domestic transaction prices in these two nations are converted into the LME payability (coefficients), the resulting percentages appear conspicuously low.
Taking the South Korean market as an example, domestic procurement for bare bright copper currently translates to a payability of mostly around 95.5%–96.5% for No. 2 copper, 96.5% for No. 1 copper, and only about 98.5% for bare bright copper.
This "low payability" phenomenon is fundamentally a pricing illusion triggered by currency depreciation. This can be deduced through the following reverse-engineering formula:

As the Korean Won or Japanese Yen depreciates against the US dollar, the denominator in the formula (LME Copper Price $$\time$$ Exchange Rate) expands passively and rapidly. Although the numerator—domestic procurement prices driven by inflation expectations and local smelter consumption has also edged higher, its absolute growth magnitude and speed simply cannot catch up with the pace at which the denominator is amplified by the exchange rate multiplier. Because the numerator's growth lags behind the denominator, the mathematically converted payability appears lower. Therefore, what seemingly looks like "cheaper scrap" is actually a stark reflection of domestic local-currency procurement costs being pushed to prohibitive levels, resulting in a severe price dislocation between the domestic and international markets.

![Downstream Bearish on Copper Prices, Intraday Purchase Willingness Flat [SMM Secondary Copper Daily Review]](https://imgqn.smm.cn/usercenter/KtfdC20251217171713.jpeg)