The core logic of the South American steel market is that end-user demand drives everything. Consumption demand is the starting point, filled jointly by local production and imports; imports act as a regulating valve rather than a driving force. However, data since 2023 has revealed an alarming structural deviation: low-priced Chinese capacity has continuously spilled over, actively seizing existing market share from local producers through price advantages. This has led to a distorted situation where consumption is growing, yet local production has stagnated or even slightly contracted, causing the profitability of local steel enterprises to deteriorate.
This distorted scenario is the direct root cause of the intensive anti-dumping measures introduced by South American countries. In February 2026, Brazil officially implemented an anti-dumping duty (ADD) on Chinese cold-rolled coil (CRC) and coated steel of up to 709 USD/tonne. Regional imports are expected to plunge to 16.4 million tonnes (a year-on-year decrease of 10.9%). Under the existing demand scale, local producers are reclaiming the market share previously occupied by imports, and local production is expected to rebound to 44.5 million tonnes. The effect of this policy has been fully validated on the pricing front: South America's Hot-Rolled Coil (HRC) export FOB price has cumulatively rebounded from a low of 480 USD/tonne in July 2025 to 630 USD/tonne on April 24, 2026. The 2026 year-to-date average of 600 USD/tonne is up approximately 10.3% compared to the 2025 full-year average of 544 USD/tonne, making it the market with the second-highest year-on-year price increase among global mainstream HRC markets, trailing only the United States.
Macro Fundamentals: Real Demand Potential, but Friction in Growth
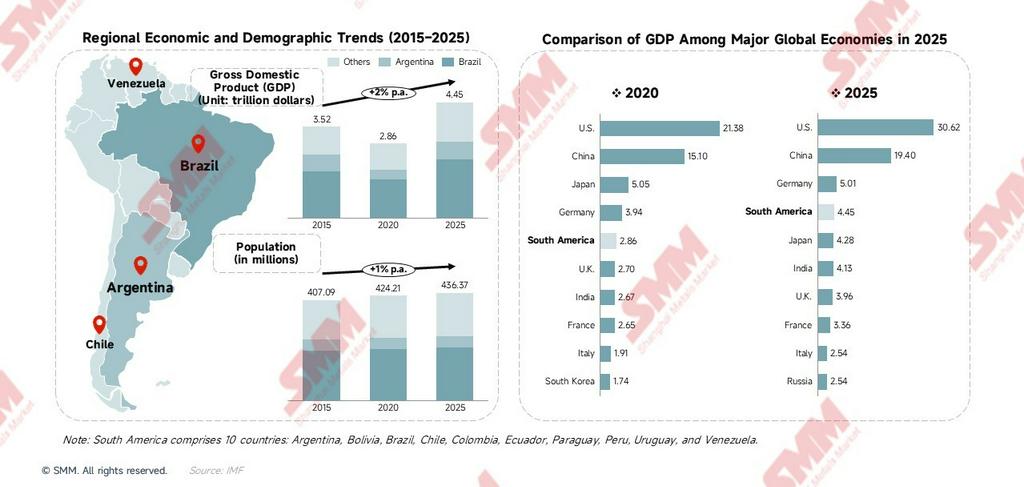
Over the past decade, South America's total GDP has grown from 3.52 trillion dollars in 2015 to 4.45 trillion dollars in 2025, with a compound annual growth rate (CAGR) of +2%. A population of 436 million provides a massive and stable foundation for steel demand. From a global perspective, the combined GDP of the ten South American nations is 4.45 trillion dollars, equivalent to the world's fourth-largest economy, surpassing Japan's single-country scale (4.28 trillion dollars)—note that this is a ten-country aggregate, provided merely as a scale reference.
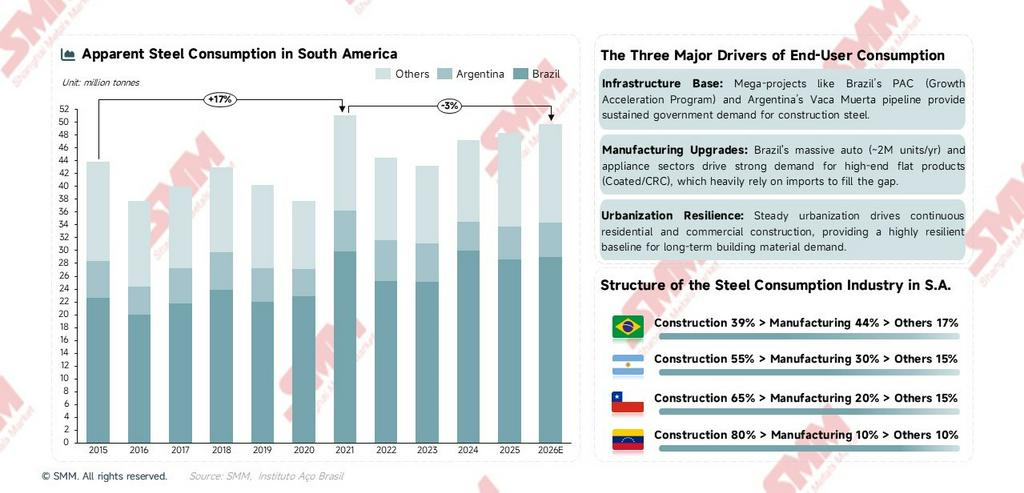
How does macroeconomic growth transmit to steel demand? The mechanism is not simply linear. Taking 2016 as an example, Argentina's deep economic crisis dragged down regional GDP, and steel consumption that year plummeted to 37.8 million tonnes (down 13.9% YoY), hitting a cyclical trough. In 2021, concentrated fiscal stimulus across various countries pushed consumption to a historical peak of 51.1 million tonnes (up 35.2% YoY). South American steel demand is highly sensitive to macroeconomic policies—government investment cycles are far better predictors of short-term consumption trends than the GDP growth rate itself.
The gap in per capita consumption reflects long-term potential. Brazil's per capita steel consumption is about 110 kg, while the global average is around 215 kg—a gap of nearly double. With advancing urbanization and manufacturing upgrades, South American consumption has structural upside potential to approach 180–200 kg per capita. Calculating based on Brazil's population of 213 million, every 10 kg/person increase equates to approximately 2.1 million tonnes of new annual demand, indicating significant long-term growth space.
Among these, Brazil's GDP of 2.26 trillion dollars (accounting for 51% of the South American total) dominates the regional economy and is the core engine of steel demand. Argentina is gradually stabilizing under the Milei administration's liberalization reforms (GDP recovering to 0.68 trillion dollars in 2025), with the massive development of the Vaca Muerta shale gas field driving demand for energy steel such as pipeline steel and Oil Country Tubular Goods (OCTG). Colombia, Chile, and Peru provide a stable base for steel consumption in the mining and infrastructure sectors.
Supply Side: The Battle for Operating Rates After Capacity Peaks
Capacity: The Ceiling Has Arrived, Locking in a Stagnant Landscape
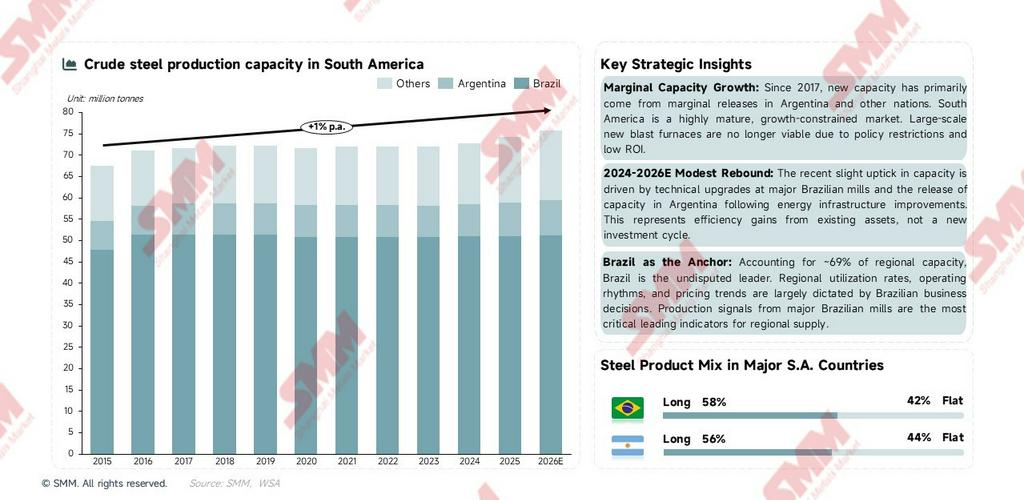
Total crude steel capacity in South America has crawled upward slowly from 2015 to 2026, with a CAGR of only +1%, signaling that substantive expansion has ended. Brazil's capacity has remained almost completely static for nine years since hitting 51.4 million tonnes in 2017. Accounting for 69% of the region's total capacity, Brazil is the absolute leader—the region's capacity utilization rate, operating rhythms, and steel price trends are almost entirely dictated by Brazil's business decisions. Production cut or expansion signals from major Brazilian steel mills are the most critical leading indicators for judging regional supply tightness. Incremental capacity growth comes almost entirely from marginal releases in Argentina and other nations, with Argentina contributing roughly half of the region's marginal increments. The capacity curve has seen a slight uptick since 2024; however, the driving force is merely technical upgrades of existing assets and the reactivation of idle lines, rather than the commissioning of large-scale new capacity.
The inertia of blast furnace (BF) assets is key to understanding production fluctuations. In the region, BF-BOF (Basic Oxygen Furnace) accounts for 60% of capacity, while Electric Arc Furnaces (EAF) account for 40%. Blast furnaces have a depreciation period of 20–30 years. Building large-scale new blast furnaces is no longer viable under the dual constraints of policy blockades (EAF is the only supported process for new additions) and low return on investment. This also means that even when market prices are suppressed by import competition, local production lines cannot quickly exit the market; they merely endure the pressure silently through declining capacity utilization rates. This is the underlying structural reason for the phenomenon observed from 2023–2025: "consumption is rising, but local production has stagnated."
There is an inherent mismatch between the product structure and the demand side. All South American countries are dominated by long products, whereas the coated sheets and cold-rolled sheets required by manufacturing industries (such as automotive, home appliances, and packaging) are flat products. Insufficient local supply dictates that there will be a long-term, rigid structural demand for flat product imports. This mismatch will not be altered by tariff policies; fundamentally resolving it would require billions of dollars in production line upgrade investments.
Production: Fluctuating with Demand, Suppressed by Price Competition in Recent Years
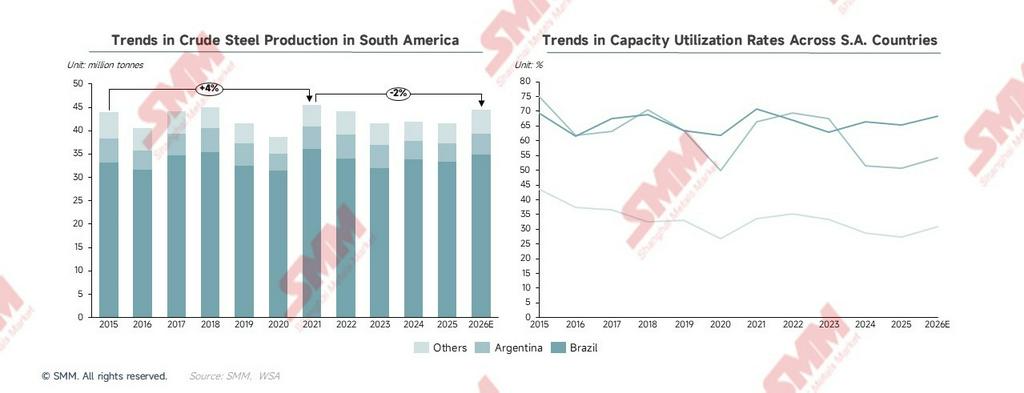
South America's crude steel production has experienced wide fluctuations over the long term. The key variable is not capacity changes, but the ebb and flow of capacity utilization rates—which, in turn, are directly dictated by the degree of suppression from import competition.
Crude steel production in South America has fluctuated since 2015, declining continuously after the post-pandemic stimulus peak in 2021. By 2025, production was approximately 41.5 million tonnes, down about 9% from the peak. In terms of capacity utilization, Brazil dropped from about 69% in 2015 to roughly 65% in 2025; Argentina plummeted from about 75% in 2015 to a historic low in 2020 (about 27%), and after a brief rebound in 2023, faced renewed pressure in 2024–2025, falling to around 51%. The capacity utilization rates of other countries remain generally low, primarily dragged down by massive idle capacity in nations like Venezuela.
Brazil's production has long accounted for about 80% of the regional total, making it the sole core variable influencing regional production trends. Brazil's production consolidated at low levels in 2024–2025, primarily due to cheap Chinese imports continuously eating into market share (Brazil's imports increased by +26% YoY in 2025), suppressing the capacity utilization rate to 65%. This indicates that low-priced Chinese imports are no longer just filling demand gaps; they have actively substituted a portion of local capacity in the existing market through price advantages, depressing local steel prices and reducing producers' willingness to operate. This is the data-driven root cause behind South America's intensive implementation of anti-dumping measures, not merely a blind impulse toward trade protectionism.
2026 Outlook: Policies Alter the Competitive Landscape, Production Rebounds as Market Share Returns. Anti-dumping measures have handed market space previously occupied by Chinese products back to local producers. Production is expected to rebound to 44.5 million tonnes (an increase of 7.2% YoY), marking the strongest rebound in five years. It is crucial to note that this rebound is not a natural recovery in demand; it is driven by increased operating rates on local production lines after Brazil's intensive anti-dumping measures compressed imports, allowing locals to reclaim lost market share. The intensity of policy execution and the speed at which alternative import sources fill the void will determine the sustainability and magnitude of this rebound.
New Capacity: Marginal Increments
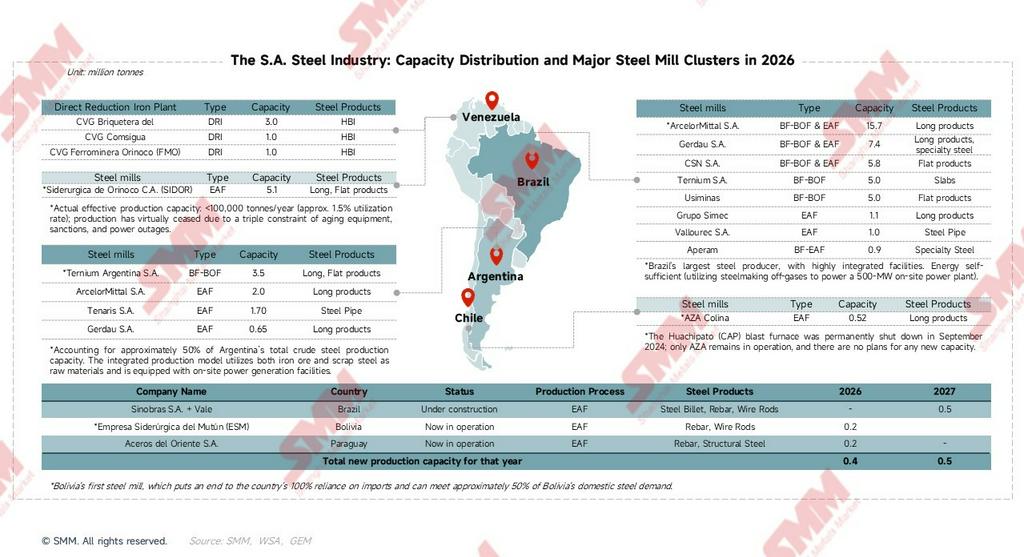
ESM is the first steel plant in Bolivia's history. It completed all testing in November 2025 and officially entered commercial operation in early 2026, ending the country's history of 100% reliance on imports and satisfying about 50% of Bolivia's local steel demand. The three new capacity projects completely utilize EAF technology, with zero new blast furnaces built. The total addition of about 0.9 million tonnes/year is less than 1.2% of existing capacity, having almost no substantive impact on the regional supply-demand landscape. However, the symbolic significance is profound: it verifies that the pathway for new capacity in the region has completely shifted to EAF, making the direction of green transition irreversible.
Four-Nation Policies: Diverging Landscapes, Green Transition Locks in Future Capacity Paths
Policy is the key exogenous variable for understanding South America's supply-side trajectory. It not only determines who can expand, who can merely survive, and who will exit, but it is also the core driving factor for price and production trends in 2026.
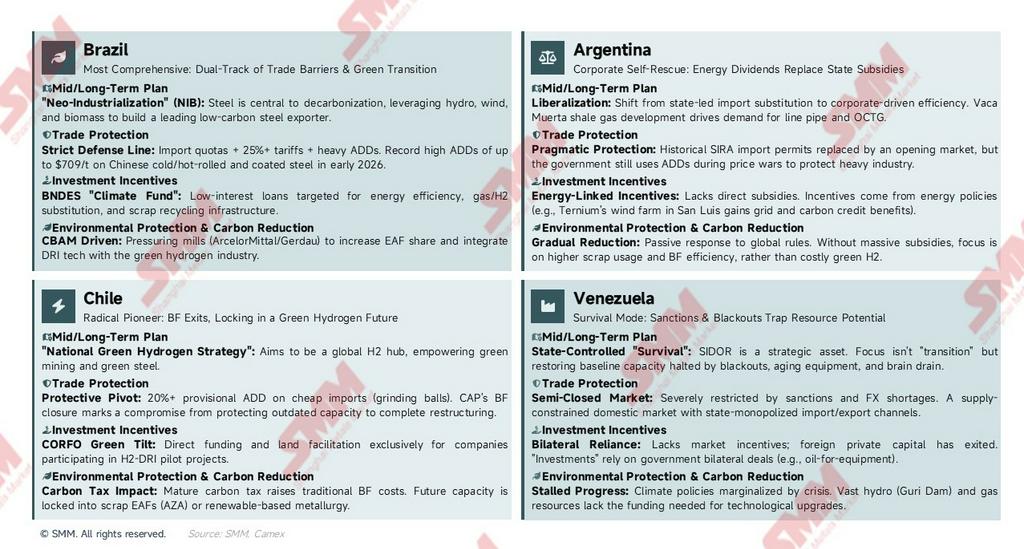
Brazil — Most Complete Policy: Dual-Track of Trade Barriers and Green Transition
In terms of trade defense, Brazil has the strictest trade defense line in South America: import quotas + over-quota tariffs of 25%+ + intensive anti-dumping measures targeting cold-rolled/hot-rolled/coated steel. In early 2026, the ADD on Chinese CRC/coated/HRC reached up to 709 USD/tonne, the highest level in regional history. Regarding the green transition, the "Neo-Industrialization" (NIB) strategy designates steel as the core of decarbonization, utilizing hydro, wind, and biomass energy to build a world-leading low-carbon steel exporter. The BNDES "Climate Fund" provides low-interest loans specifically for energy efficiency upgrades, natural gas/hydrogen replacing coal, and scrap recycling infrastructure. Driven by the pressure of Europe's Carbon Border Adjustment Mechanism (CBAM), policies are forcing enterprises (like ArcelorMittal and Gerdau) to increase their EAF share and encouraging the integration of Direct Reduced Iron (DRI) technology with the green hydrogen industry. The policy logic is clear: first, stabilize profits using trade barriers, then drive the transition using climate funds—both advancing synchronously.
Argentina — Corporate Self-Rescue Led: Energy Dividends Replace State Subsidies
The Milei administration is pushing economic liberalization reforms, shifting from "state-led import substitution" to "corporate-driven cost reduction and efficiency enhancement." Regarding trade protection, Argentina historically utilized the SIRA import licensing system extensively to restrict steel imports; while the trade environment is trending toward openness, the government will still deploy anti-dumping tools when faced with price wars. In terms of investment incentives, there is a lack of direct national-level subsidies, but energy policy dividends are significant. Enterprises like Ternium have built supporting large-scale wind farms in San Luis province, receiving preferential treatment for national grid access and carbon credits. On carbon emission reduction, the response to international market rules is passive. Lacking massive subsidies, they are adopting a "gradual" reduction path: increasing scrap utilization and optimizing BF efficiency, rather than directly launching high-cost green hydrogen projects. Direct data reflection: During the early stages of Milei's reforms, government spending was compressed. Argentina's steel consumption plummeted from 6.0 million tonnes in 2023 to 4.6 million tonnes in 2024, and capacity utilization subsequently fell from 68% to 51%, the lowest point in a decade. The massive development of the Vaca Muerta shale gas field is one of the few real sources of incremental steel consumption in Argentina, and its pull on pipeline steel and OCTG will gradually become evident post-2026.
Chile — Radical Transition Pioneer: BF Exits Lock in a Green Hydrogen Future
The future of the steel industry is completely bound to the "National Green Hydrogen Strategy." The government aims to build Chile into a global green hydrogen production hub, empowering green mining and green steel. In terms of trade protection, a provisional anti-dumping duty (over 20%) was levied to counter cheap imported steel (mainly used for copper grinding balls). However, the permanent closure of Compañía Siderúrgica Huachipato's (CAP) blast furnace signals a policy compromise, shifting from "protecting outdated capacity" to "thorough transition and restructuring." CORFO funds are entirely tilted toward the "green transition," providing direct funding and land facilitation for companies participating in H2-DRI pilot projects. Mature carbon tax policies have further driven up the operating costs of traditional blast furnaces; future new capacity is almost entirely locked by policy into scrap EAFs (AZA) or new metallurgical projects based on renewable energy.
Venezuela — Survival Mode for Existing Assets: Sanctions and Blackouts Trap Resource Endowments
The steel industry, with Siderúrgica del Orinoco (SIDOR) at its absolute core, is viewed as a national strategic resource, fully state-controlled. The current plan is not a "transition" but rather "survival"—prioritizing the restoration of baseline capacity halted by massive blackouts, aging equipment, and brain drain. Heavily impacted by international sanctions and extreme foreign exchange shortages, the market is essentially semi-closed; it is difficult to import steel on a large scale, resulting in a completely supply-constrained domestic market where the state monopolizes import and export channels. Lacking effective market-based investment incentives, foreign private capital has largely exited. Current "investment" relies primarily on bilateral intergovernmental agreements (such as oil-for-equipment and technical maintenance). Under the backdrop of a survival crisis, environmental protection and carbon reduction policies are almost entirely stalled or marginalized. Despite possessing the Guri Dam's hydropower and natural gas resources (which could develop low-carbon DRI), the lack of capital for technological upgrades means these resource endowments cannot be translated into actual production capacity.
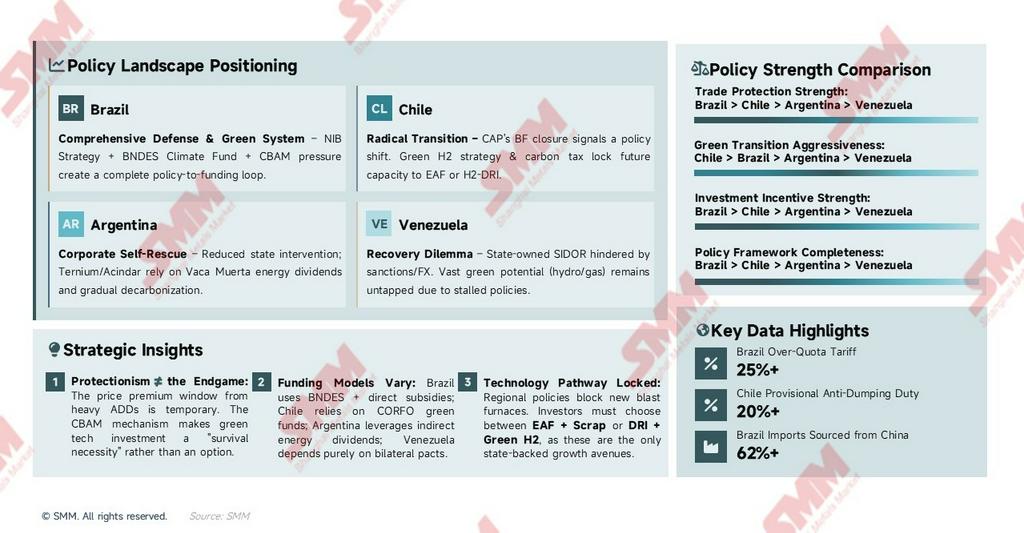
The policies of the four countries have formed a clear tiered division: Brazil dominates the regional landscape with the most complete policy tools and the strongest trade protection; Chile bets on the green hydrogen track with the most radical transition posture; Argentina relies on energy dividends to subsidize corporate competitiveness; and Venezuela's primary goal remains "maintaining operations" amid sanctions and power crises. This divided landscape will further solidify in the coming years.
Demand Side: Mild Consumption Recovery; The "Quality Gap" is an Unsolvable Structural Constraint
Consumption Trends: Demand is the Starting Point, Imports are the Regulating Valve
The consumption change curve exhibits a clear "policy-pulse" characteristic. It is worth noting that the 2021 peak of 51.1 million tonnes was not a sustainable demand baseline, but the result of a one-time push from fiscal stimulus; the subsequent decline is merely a return to the long-term trend line, not a collapse in demand. The mild recovery from 2024–2026 represents the true trend line reflecting actual end-user demand. Regarding the sectoral structure of consumption in each country, Brazil is the only major market where manufacturing accounts for a larger share than construction. In Chile, reliance on construction steel further increased after the Huachipato closure. Venezuela's industrial base is extremely weak, with consumption consisting almost entirely of construction steel.
Three core consumption drivers support the demand base:
- Infrastructure Support: Brazil's PAC "Growth Acceleration Program" (totaling 340 billion dollars over five years) and Argentina's Vaca Muerta pipeline expansion provide a stable government procurement base for construction materials.
- Manufacturing Upgrades: Brazil's automotive industry (producing about 2 million vehicles annually) and its appliance industry (ranking top ten globally in scale) continue to drive strong demand for high-end flat products, relying on imports to fill the gap.
- Urbanization Resilience: Continuously rising urbanization rates in South America (about 87% in Brazil) provide a long-term demand anchor for construction steel, equipping regional construction steel consumption with strong downside resilience.
The Quality Gap: Structural Supply-Demand Mismatch and the Source of Rigid Imports
The most core structural contradiction in South American steel is the coexistence of a "long product supply surplus" and a "severe flat product shortage." This contradiction directly determines the product composition and irreplaceability of imports.
Imports must be distinguished into two categories based on their nature:
- Rigid Imports: Products for which there is no local production capacity, primarily flat products (coated/HRC/CRC, totaling about 54.5% of South American imports). These imports must occur regardless of how high tariffs are.
- Competitive Substitute Imports: Products where local production capacity exists, but Chinese products are priced lower, leading buyers to choose imports over local procurement. These are primarily long products (rebar/wire rod/billet, totaling about 25%).
Anti-dumping duties primarily target the latter—competitive substitute imports. For rigid flat product imports, ADDs can only change the source country of imports (shifting from China to Vietnam/South Korea) but cannot eliminate the import demand itself. This is the fundamental reason why South America's imports are expected to drop sharply by 10.9% in 2026, yet will still maintain an import scale of 16.4 million tonnes—the structural demand gap remains very real.
Trade Flows: Dynamic Landscapes, Product Logic, and Deep Analysis of Flow Maps
Total Imports: A Structural Shift from "Filling Demand Gaps" to "Competitive Market Substitution"
The evolutionary trajectory of South America's total steel imports is by no means a simple upward curve; it reflects two entirely different historical phases. The underlying logic driving import growth fundamentally shifted around 2023.
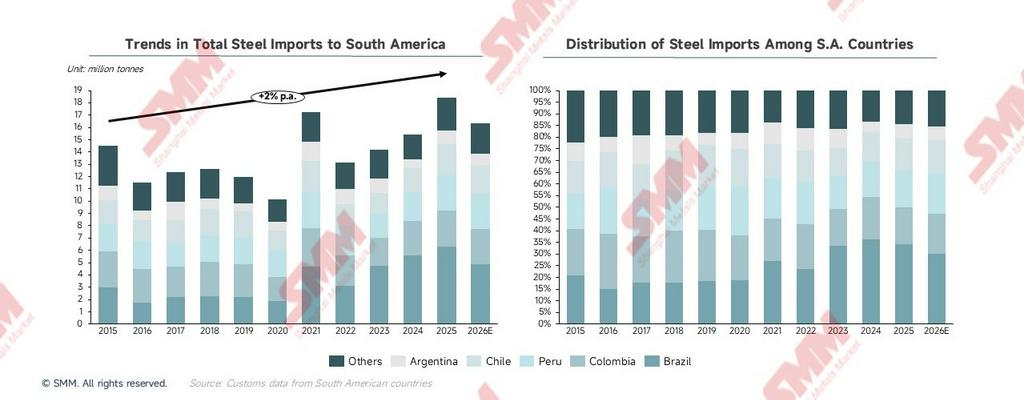
- 2015–2022: Imports Primarily Filled Real Demand Gaps Import volumes rose and fell alongside consumption demand, displaying a significant demand-linked characteristic. In 2020, consumption plummeted to a historical low due to the pandemic, and imports similarly plunged to 10.1 million tonnes. In 2021, fiscal stimulus pushed consumption to a historical peak, and imports correspondingly surged to 17.2 million tonnes. The nature of imports in this phase was passive gap-filling: even operating at full throttle, local production could not meet the instant surge in demand. Imports were the result, not the cause.
- From 2023 Onward: Imports Actively Seize Existing Market Share, a Fundamental Shift in Nature
- 2023: Consumption declined only slightly, yet imports steadily rose. Imports expanding while demand is weak indicates that imports are competing for share in the existing market, rather than filling a new demand gap.
- 2024: Consumption rebounded by about 9.3%, and imports rose synchronously by about 8.5%, while local production increased by only 0.9%. When consumption rises but local producers fail to benefit, the incremental market is being captured by imports.
- 2025: Consumption continued its mild growth, but imports surged to 18.4 million tonnes, hitting a ten-year high, while local production actually fell during the same period. This is the most glaring signal: low-priced Chinese imports are no longer just filling gaps; they are systematically substituting local capacity in the existing market via price advantages, depressing local prices, reducing producers' willingness to operate, and causing capacity utilization rates to drop.
The watershed moment was the systemic downward shift of China's FOB export prices. Since 2023, China's export FOB has fluctuated in a long-term low-price range, significantly narrowing the price spread with local South American prices. The price advantage of imported Chinese steel was sufficient to actively substitute local products, even under conditions of limited consumption growth. This transformed imports from mere "gap fillers" into "competitive substitutes" vying for the existing market with local producers. This shift in nature is the true root cause behind the intensive implementation of anti-dumping measures by regional countries in 2025, rather than a simple impulse for trade protectionism.
Looking ahead to 2026, regional imports are expected to fall back to 16.4 million tonnes. This is not due to shrinking demand, but rather policies reshaping the competitive landscape. Brazil's implementation of an ADD of up to 709 USD/tonne on Chinese CRC/coated products has directly severed the price advantage of cheap Chinese steel in South America, removing the foundation for a massive volume of competitive substitute imports. However, rigid flat product imports (which lack local capacity) are not compressed by ADDs and will maintain a significant scale. This explains why, despite a sharp 10.6% drop, imports will not hit zero; the 16.4 million tonne import baseline reflects the region's true structural gap.
Looking at the historical changes in import dependence across different countries, Brazil has seen the most dramatic rise since 2024—surging from 27% in 2021 to 33% in 2025. This reflects that the shock of Chinese imports has been most concentrated on suppressing Brazil's local producers, consequently making Brazil the country with the strongest anti-dumping policy response.
Import Product Profiles by Country: Nationality Determines Product, Product Reveals Industrial Structure
The structure of imported products is the most direct window into understanding the development stage and capacity gaps of the steel industry in each country. Below is a country-by-country breakdown of import products and their underlying industrial logic.
Brazil — Largest Scale, Flat Products Dominate, Hiding a "Re-export Arbitrage" Logic
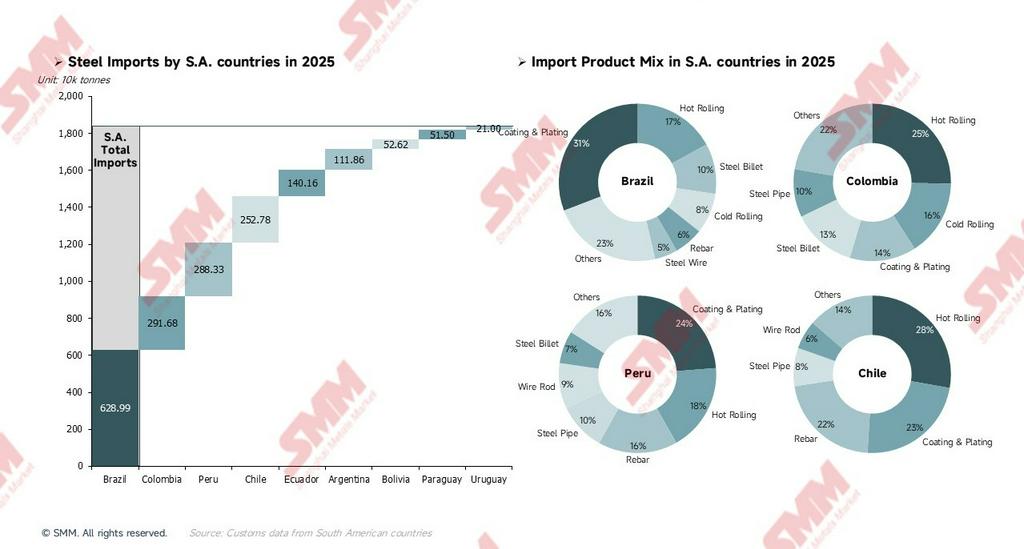
Brazil's total imports amount to 6.289 million tonnes, making it the largest importing nation in the region. Extra-regional sources account for 99%, relying almost entirely on imports from outside the continent—because Brazil itself is the supply hub within the region. Flat products (coated, HRC, and CRC) combined account for about 56%, forming the absolute core of Brazil's imports. Behind this is Brazil's automotive industry, producing about 2 million vehicles annually, and its appliance industry, which ranks in the global top ten. These two massive industries have robust demand for flat products, and while local giants like CSN and Usiminas have flat product lines, they cannot entirely substitute imports in terms of quality and supply stability. Even after anti-dumping tariffs are applied, these imports will merely shift from China to other alternative countries; they will not disappear. What merits deeper investigation is billet imports. Brazil itself is South America's largest billet exporter (exporting a staggering 8.68 million tonnes of billet in 2025), yet simultaneously imports billet on a significant scale. This is not a contradiction; rather, local rolling mills import low-priced billets (usually from China or Egypt) to roll directly into finished products, which offers more flexibility and lower costs than purchasing billets from local integrated steel mills. This arbitrage logic will be severely impacted as ADDs tighten, potentially forcing rolling mills to increase their proportion of local billet procurement, indirectly boosting the operating rates of large domestic steel mills.
Except for Brazil, the rest of the South American markets have largely lost their full supply chain competitiveness. They barely survive domestically in long products by leveraging regional synergies and logistics barriers, while in the realm of flat products and high-value-added special steels, they have been thoroughly reduced to rigid dumping grounds and tariff battlegrounds for global (especially Asian) exporters.
- Colombia — Geopolitical Transit Hub and Hidden Value Chain: Colombia utilizes globalized imports to feed regionalized processing trade. Its core value lies not in steel production volume, but in the "transit function" granted by its geopolitics—transforming low-priced international flat products into critical materials needed for Venezuela's oil & gas and infrastructure sectors, thereby constructing a hidden value chain in northern South America that is highly immune to sanctions.
- Peru — Coastal Trade Hub: Imports approximately 0.47 million tonnes of Chinese rebar, while local producers also export self-produced rebar to neighboring countries. Two supply chains run parallel but serve different functions: imported Chinese rebar seizes the coastal city construction market via price advantages, while locally exported rebar enters neighboring inland countries utilizing logistics cost advantages and adaptability to high-altitude building codes.
- Chile — Deep External Dependence and Mining Special Steel Exposure: Extra-regional imports account for 95%, making it the market with the highest external dependency in the region. Before the permanent closure of its blast furnace in September 2024, Chile could locally satisfy at least a portion of its rebar demand; since then, rebar has entirely relied on imports, leaving the steel costs of Chile's construction industry completely exposed to international market volatility. Simultaneously, as the world's largest copper producer, Chile's copper grinding operations require massive quantities of steel grinding balls. This demand is highly rigid, which is the direct reason why Chile was the first to levy a 20%+ provisional ADD on steel for copper grinding balls—imports are massive, local substitution is difficult, and the policy's objective is to buy survival space for local producers.
- Argentina — A Classic Sample of Regional Value Chain Synergy: The biggest characteristic of Argentina's imports is that intra-regional trade accounts for 70%, with about 0.76 million tonnes coming from Brazil, making it the country most dependent on intra-regional trade in South America. Billet is Argentina's largest imported product category, primarily sourced from Brazil—this is the most typical manifestation of intra-regional value chain division in South America. Argentine rolling enterprises import billets directly from Brazilian steel mills and complete the rolling process locally, avoiding the duplicate investment required to build a complete blast furnace-to-rolling mill production line.
Total Exports: The Triple Structural Pressures Behind Long-Term Contraction
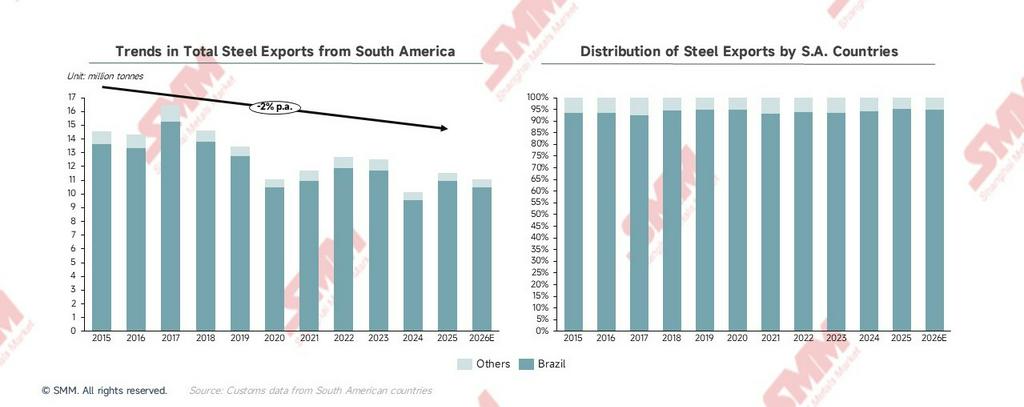
South America's steel exports have been on a continuous downward trajectory since their peak in 2017, touching a ten-year low of 10.1 million tonnes in 2024, before recovering slightly to 11.5 million tonnes in 2025. Steel exports from South America have entered a downward channel and are fluctuating, reflecting continued pressure on South American export competitiveness. Brazil's exports have consistently accounted for about 95% of the region's total in recent years; therefore, the export trend of South America is practically equivalent to the export trend of Brazil. Studying South American exports essentially means studying Brazil's export dynamics.
The triple structural pressures causing long-term export contraction:
- Billet exports account for about 79% of Brazil's total exports: Billet is the lowest-value-added semi-finished product in the steel value chain. This keeps the region permanently relegated to the raw materials end of global steel trade, with prices completely dictated by global billet market fluctuations, leaving them with zero pricing power.
- Exports to the US account for about 59% of Brazil's total exports: In 2025, the 25% tariff under US Section 232 continued to exert pressure. Coupled with Brazil's exports being so highly concentrated in a single market, any US policy change directly shocks the region's overall export performance, a shock that is almost impossible to offset via other markets in the short term.
- Export diversification progresses slowly: Structural diversification is more important than quantitative diversification. Brazil is intensifying export efforts to Europe and intra-regional Latin American markets, but these markets have limited capacity to absorb billets and possess weak price negotiation power. The true breakthrough lies in shifting from "selling billets" to "selling green, low-carbon billets." Under the CBAM framework, the low-carbon production advantage of companies like Gerdau (carbon emission intensity of about 0.91 tonnes CO₂/tonne of steel, only 50% of the global average) will create a differentiated competitive advantage beyond price. This is the core pathway for export strategic upgrading.
Export Product Profiles by Country: A Precise Depiction of Value Chain Positioning
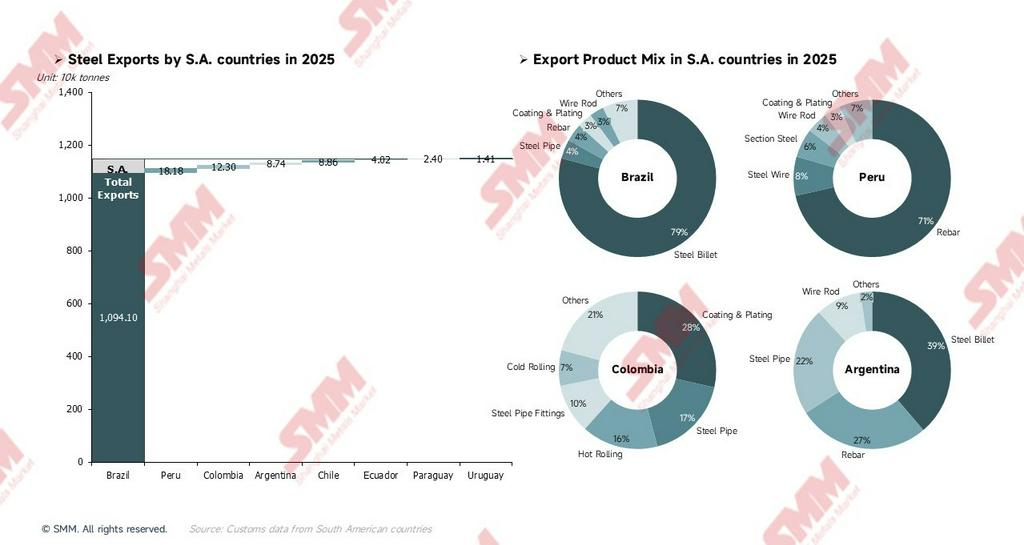
Brazil — Billet Dominated, Highly Concentrated Market
Steel pipe exports are primarily undertaken by Tenaris (the global market leader in OCTG seamless pipes), with products covering OCTG, line pipe, mechanical pipe, and automotive pipe. This is one of the highest value-added categories in Brazil's export portfolio. This implies that while Brazil dominates export volumes with low-priced billets (79%), the high-end steel pipe business contributes export value far exceeding its volume proportion, acting as the true "value anchor" of Brazil's steel exports. Simultaneously, exports to Europe (8.7%) consist mainly of billets; this specific export volume is the core testing ground for the future green premium strategy. Under the CBAM framework, low-carbon billets produced in Brazil using hydropower + biomass charcoal + scrap will hold a significant advantage in the carbon cost accounting of European buyers, potentially shifting competition from pure pricing to a green premium.
Lacking absolute scale and global cost advantages, South American steel exports (excluding Brazil) have devolved into a "battle for niche survival." Peru and Colombia have achieved localized monopolies and value-added arbitrage by constructing formidable physical and geopolitical barriers (e.g., the Andean inland logistics network and the stealth supply chain to Venezuela). Conversely, Argentina's "primary product lock-in" and Chile's "overseas wandering" of capacity reveal a harsher industrial reality: when facing the indiscriminate impact of low-priced global resources, local steel industries lacking a complete supply chain moat are plummeting into the abyss of passive market marginalization.
- Peru — Differentiated Competition: Logistics Barriers and the "Two-Way Mining Steel" Corridor: In Peru's export breakdown by product, rebar establishes its positioning as a regional building material supplier at a staggering 71.4%, with 89% of exports flowing to neighboring countries like Bolivia, Chile, Colombia, and Ecuador. Among these, Bolivia accounts for a massive 44%—because it is a landlocked, high-altitude country, Peru possesses obvious logistics advantages. Notably, while Peru imports steel wire for copper grinding balls, local steel mills like Aceros Arequipa also produce a small amount of steel wire, some of which enters the intra-regional market, forming a unique pattern of "parallel import and export of mining steel." Against the backdrop of continued copper mining expansion, this pathway could become a potential direction for diversifying Peru's export products.
- Colombia — A Hidden Supply Chain Shaped by Geopolitics: Colombia exported about 0.123 million tonnes of steel in 2025, with roughly 0.078 million tonnes flowing to Venezuela. Under the blockade of international sanctions, this special trade corridor is Venezuela's most vital overland channel for acquiring industrial steel. Steel pipes and pipe fittings together account for 27% of flows to Venezuela, highly likely directly linked to maintenance and localized repair demands for Venezuela's oil and gas infrastructure. This is a hidden supply chain shaped by geopolitics, exhibiting high stability as long as the sanctions framework on Venezuela remains unchanged. Furthermore, coated steel is Colombia's highest value-added export product; a portion of this may stem from a value-added trade model where Colombia imports Chinese raw materials (HRC/CRC), processes them into coated steel locally, and then re-exports them. This model allows Colombia to act as a light processing center within the region.
- Argentina & Chile — Primary Lock-in and "Passive Marginalization": Argentina's export structure remains dominated by primary and semi-finished products, with billets and rebar combining for 66%. Although steel pipe exports have risen to 22%, fundamentally altering Argentina's value chain positioning in exports will require further capacity expansion and product upgrading. It is worth noting that after the closure of Huachipato, Chile's remaining production is primarily used for export rather than domestic sales—because local demand for rebar and other building materials has been satisfied by Chinese imports wielding price advantages. Unable to compete in the local market, producers are forced to redirect products to the Dominican Republic, other Caribbean markets, and neighboring countries to find an outlet. This is the practical price paid for a radical transition route: capacity is retained, but market positioning is forcibly marginalized.
2025 Global Trade Flow Map: Bipolar Concentration, The Diversification Gap is Glaringly Obvious
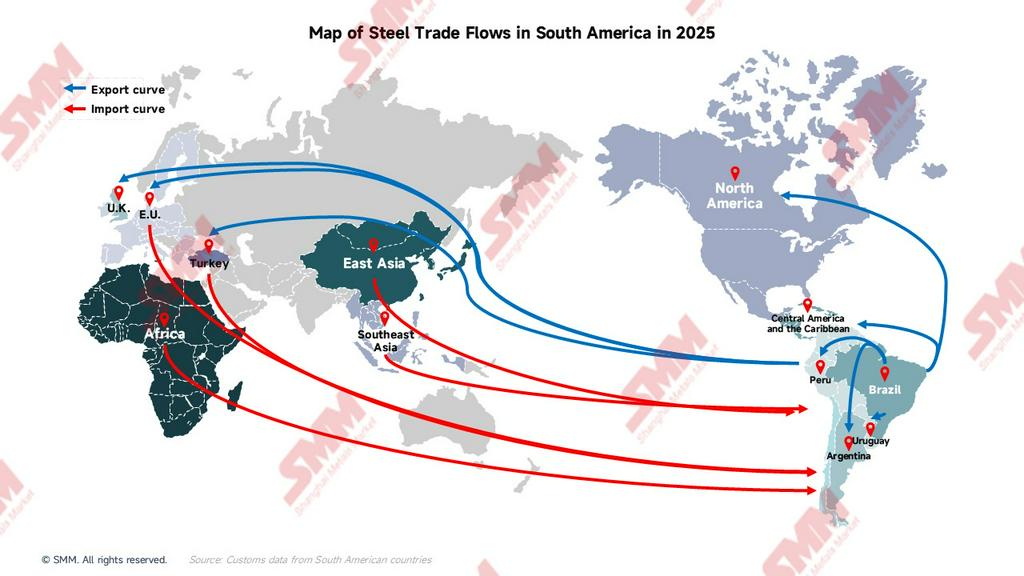
Import Sources: East Asia (72.9%) vs. Rest of the World (27.1%)
South America's import sources are extremely concentrated in a single region, with the remaining regions highly dispersed and each holding very small volumes. This structure dictates that should East Asia's (China's) export policies change, South America will suffer systemic shocks to both price and supply, as other sources cannot effectively fill the void in the short term.
-
East Asia: 13.41 million tonnes — East Asia (China, Japan, South Korea) dominates South America's import sources with an absolute share of 73%. This clearly demonstrates that South America's steel supply security is almost entirely exposed to changes in export policies from East Asia, particularly China. China's continuous expansion of exports to South America in 2025 was the direct driver pushing South American imports to a historical peak of 18.4 million tonnes. The rollout of anti-dumping policies is essentially South America's policy correction against East Asia's excessive dominance.
-
Southeast Asia: 0.61 million tonnes — Although the volume is small, its strategic significance is rising. Vietnam is the primary source and currently the fastest-growing source location for South American imports. As anti-dumping tariffs against China take effect in Brazil and other nations, importers are rapidly shifting procurement sources from China to lower-tariff alternative suppliers like Vietnam and South Korea—a trend expected to increase significantly in 2026. The rise of Southeast Asia is a direct structural response to massive East Asian exports to South America.
-
Africa: 0.36 million tonnes — Primarily from Egypt, with products mainly comprising billets and building materials, acting as an important source for Brazil's billet imports. Leveraging low billet production costs and strategic layout in the South American market, Egypt holds a stable share of Brazil's billet imports. Unaffected directly by South America's anti-dumping tariffs (which target mainly China), this volume could further expand in 2026.
-
EU & Turkey: 0.96 million tonnes — Turkey primarily supplies rebar and building material products, mainly serving the Chilean and Peruvian markets. As ADDs squeeze Chinese products out, Turkey's role as an alternative source will become more prominent. Simultaneously, products from EU countries like Germany and Spain are primarily high-end special steels, cold-rolled sheets, and silicon steel—rigid import categories with extremely low substitutability. These imports are largely unaffected by ADDs and mainly fulfill the special specification demands of Brazil's automotive and energy industries.
Export Destinations: North America (61.8%) vs. Rest of the World (38.2%)
-
North America: 7.1 million tonnes — The United States accounts for the vast majority of this, with Mexico and Canada providing supplements. It is almost accurate to say that South America's exports are Brazil's exports, and Brazil's exports are exports to the US. The risk of high dependence on a single market is the biggest warning sign on this map—the 25% tariff under US Section 232 continues to exert pressure, and this massive export volume can hardly find an absorber of comparable scale in other markets.
-
EU: 0.92 million tonnes — The EU is the export direction with the greatest potential for South America, with billets dominating the export product mix; it is the core battleground for the green premium strategy. As the CBAM framework gradually rolls out, European buyers' carbon cost accounting will extend to imported steel, allowing Brazil to form a differentiated competitive advantage beyond price. This arc represents the most strategically valuable direction for upgrading South America's exports, but the current volume pales in comparison to North America.
-
Central America & the Caribbean: 0.47 million tonnes — Primarily flowing to the Dominican Republic, Costa Rica, Guatemala, etc. This market is a rapidly growing emerging direction for South American exports, dominated by long products like rebar and building materials. The intensity of competition is lower than in Europe or the US, making it a highly cost-effective source of marginal incremental growth for export diversification.
-
Intra-Regional Trade: Brazil is the Sole "Regional Supply Hub" — As the only tier-one hub, Brazil supplies intra-regional nations with a total of about 1.835 million tonnes. Peru acts as a tier-two node, converting some imports into re-exports to landlocked countries like Bolivia and Chile. Colombia plays the special role of being the only overland steel corridor to Venezuela. This hierarchical structure is highly stable but simultaneously highly fragile—any major production changes or export policy adjustments in Brazil will create a domino effect transmitting through the entire intra-regional trade network, with Argentina (68.3% of its imports coming from Brazil) bearing the brunt.
Global Pricing Landscape: Bifurcation Between the Low East and High West; South America Sits in the Protected Middle
According to SMM's tracking data of global hot-rolled coil (HRC) import and export quotes, as of April 24, 2026, the current market landscape is as follows:
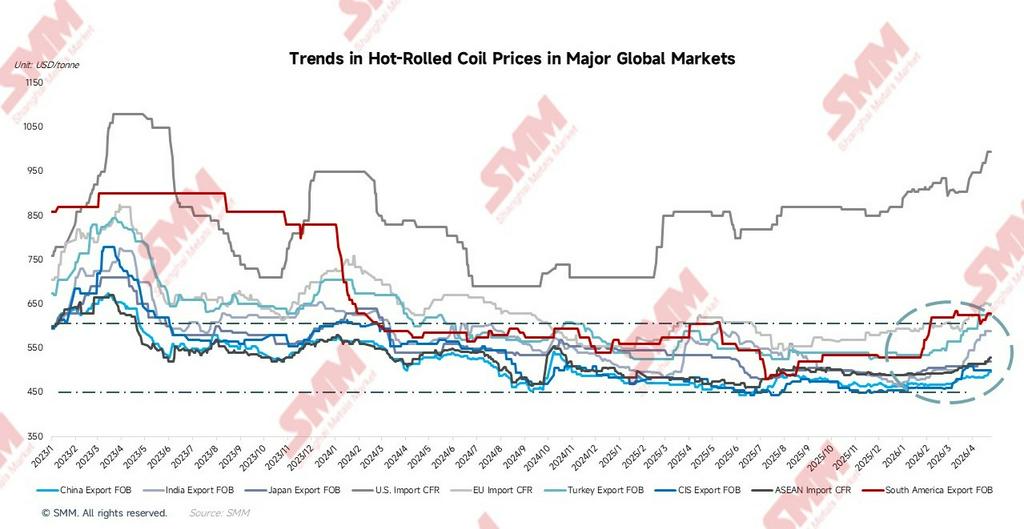
The two markets with the most stellar year-on-year performance in 2026 are the US (+14.5%) and South America (+10.3%), whereas China, Japan, and the CIS are all near zero or even negative growth, further intensifying the bifurcation of the global pricing landscape.
The two horizontal dashed lines in the chart are crucial references for interpreting the pricing landscape: the upper line at around 600 USD/tonne represents South America's local price support line (the floor of tariff protection), and the lower line at around 450 USD/tonne represents the East Asian export price floor (the global pricing anchor). The latest South American HRC export FOB quote in 2026 has already broken through the upper dashed line, indicating that the premium effect of protectionist policies has exceeded expectations. Meanwhile, China's HRC export FOB price lingers near the lower dashed line long-term, forming the bottom of global prices.
South America FOB: From a Trough of 480 USD/tonne to 630 USD/tonne, a Cumulative Rebound of +31.2%
The trajectory of South America's export FOB is one of the most dramatic curves in global steel price charts over the past 16 months:
-
Jan–May 2025: Policy Expectations Boost Quotes. South America's HRC export FOB trended mildly upward, reaching its annual peak in April 2025. This period coincided with announcements from Brazil and others pushing a new round of anti-dumping measures. Expectations of import compression drove export quotes up early, though policies had not officially landed.
-
Jun–Jul 2025: Expectations Fall Through, Coupled with Chinese Low-Price Shocks, Triggering a Rapid and Deep Correction. Within just two months, prices plunged to the annual low in July 2025. Concurrently, China's HRC export FOB was also at a low. The spread between South America and China HRC export FOB narrowed to a historical extreme low of just 17 USD/tonne. South American export products almost entirely lost their relative competitive premium against Chinese products, forcing exporters to slash margins significantly.
-
Aug 2025–Jan 2026: Bottom Stabilization and Sideways Trading for ~6 Months. Prices gradually repaired from the low and entered a narrow consolidation phase for about half a year. During this stage, the timetable for Brazil's anti-dumping tariffs gradually became clearer, and the market began to re-price.
-
Feb 2026 to Present: Official Implementation of Anti-Dumping Policies Drives a Strong Rally. The largest single-month increase occurred in February 2026. Prices were pushed further to a phase high of 635 USD/tonne in March, and then entered high-level consolidation in April. As of April 24, the latest quote is 630 USD/tonne.
The East Asian Anchoring Effect: China's HRC Export FOB is the Structural Ceiling for Global Steel Prices
China's HRC export FOB (2025 full-year average 469 USD/tonne) has fluctuated long-term in the 445–497 USD/tonne range. The 2026 year-to-date average is 476 USD/tonne, a cumulative drop of about 43% from the 2021 peak (average 842 USD/tonne). The current massive spread of 498 USD/tonne between China's HRC export FOB and the US HRC import CFR serves as the best "mirror" for observing the global steel trade landscape—it perfectly reflects the degree of price fracturing created by trade barriers in the global steel market. Southeast Asia's HRC import CFR (2026 year-to-date average 502 USD/tonne) has consistently maintained a stable spread of about 30 USD/tonne with China's HRC export FOB (roughly equivalent to ocean freight), reflecting that Chinese products have achieved full penetration of the Southeast Asian market, linking the two substantively.
Quarterly Evolution of the Spread Between South America and China HRC Export FOB: Policy Effects Clearly Visible
The spread between South America and China HRC export FOB has expanded to the current +134 USD/tonne, recovering over three quarters from the extreme low of +30 USD/tonne in Q3 2025. This trajectory clearly corroborates the substantive restorative effect of anti-dumping policies on local steel pricing power.
EU Market: A 20 USD/tonne Spread is a Window of Opportunity for Green Exports
The EU HRC import CFR (2026 year-to-date average 616 USD/tonne, latest 650 USD/tonne) has recovered mildly from its December 2024 low. The April average of 640 USD/tonne has narrowed the spread with South America HRC export FOB to -20 USD/tonne. The current price level means the competitiveness of South American billet exports to Europe sits at the breakeven margin. If EU prices continue to rise or CBAM carbon cost advantages are fully priced in, this window will open significantly. Leading South American enterprises like Gerdau have a carbon emission intensity of about 0.91 tonnes CO₂/tonne of steel, only 50% of the global average (1.85 tonnes). Under the CBAM framework, high-carbon imported steel must pay additional carbon border taxes. Consequently, South American low-carbon billets possess a significant structural cost advantage and are poised to win out in competition and capture the green premium.
US HRC Import CFR Nears 1,000 USD/tonne: The Most Lucrative Profit Pool and the Most Highly Concentrated Risk
The US HRC import CFR (latest 995 USD/tonne) is the only major market globally where prices have strengthened significantly, an environment artificially constructed entirely by the 232 clause 25% tariff. For Brazil, the implied profit margins of exporting to the US are immense. However, with exports to the US representing a highly concentrated 59% of Brazil's total exports, any tightening of market access will cause systemic losses that are hard to recoup.
2026 Outlook: Reshaping the Competitive Landscape Drives Supply-Demand Rebalancing
According to the SMM Global Supply and Demand Balance Sheet, South America in 2026 is one of the few regions globally to simultaneously present a "triple positive" landscape: "Output up, Imports down, Consumption up."
Three Sources of Profit Improvement for Local Producers
In 2026, profit improvement for local South American producers comes from three mutually compounding sources, in order of importance:
- Market Share Return: Anti-dumping duties shrink imports by about 2 million tonnes. This demand shifts from importers back to local producers. This is a pure alteration of the competitive landscape; local producers can increase operating rates without needing new demand growth, making it the most direct source of profit repair.
- Demand Growth: Consumption grows mildly by 1.4 million tonnes, providing new market space that local producers can effectively absorb in a looser competitive environment.
- Price Repair: Reduced competitive imports lead to the restoration of local price premiums, while unit margins improve. The rise in South America HRC export FOB fully reflects this.
The combination of these three sources is expected to lift Brazil's capacity utilization from 65% back to 68%, and Argentina's from 51% back to 54%, representing the loosest profit repair window in the past five years.
Three Major Trends and Their Interconnectedness
- Anti-dumping policy is the prerequisite for all other improvements. Without trade protection restructuring the competitive landscape, there would be no production rebound, no price repair, and no capital expenditure capacity required to initiate the green transition. Trade protection acts as the "cash flow foundation" for the current stage of the green transition, rather than a short-sighted act opposed to it.
- The production rebound is a result of a changed competitive landscape, not a result of demand expansion. In 2026, the year-on-year growth rate of crude steel production is double that of Apparent Steel Consumption. The essence of the difference between the two is that local producers have clawed back a portion of market share from importers. This improvement driven by "return of existing share" carries more certainty than demand growth, because it relies on already implemented policy protection rather than a one-time pulse in demand.
- The green transition is the mid-to-long-term main axis post-2027. The anti-dumping window will last about 12–18 months. Truly sustainable competitiveness must be built through EAF transitions and low-carbon certifications, which require an investment cycle of 3–7 years.
South America from a Global Perspective: A Rare Triple-Positive Region
Looking at the global supply-demand landscape, the overall global steel market continues to face oversupply pressures in 2026. Global crude steel production is expected to decline slightly, and global Apparent Steel Consumption remains similarly pressured. Major steel-producing regions like East Asia and the EU all face production contraction or sluggish consumption. Only a few emerging markets maintain growth momentum. Against this global backdrop, South America is one of the few regions to simultaneously present a "triple positive" landscape of "Output up, Imports down, Consumption up." The rarity of this combination lies in the fact that: production growth does not come from new capacity investments, but from policy-driven repairs to operating rates on existing lines; the decline in imports is not due to shrinking demand, but the manifestation of import substitution effects following the restructuring of the competitive landscape; and consumption growth comes from a genuine recovery in end-user demand, possessing a certain degree of sustainability.
Key Risk Factors
- Import-Side Risks: If inflation rises and construction cost pressures increase in the second half of 2026, the Brazilian government may relax anti-dumping measures. In that scenario, competitive imports will flow back, South America HRC export FOB will face downside risks, and the increase in local production could be heavily discounted. Whether the pricing from alternative source countries remains competitive will also determine if import compression is realized as expected.
- Export-Side Risks: If the US expands the scope of Section 232 tariffs or raises rates, Brazil's exports to the US will face systemic shocks—local excess capacity will drive down domestic prices, creating a reverse shock to profit recovery.
The deeper narrative of the South American steel market is the tension between the long-term potential of end-user demand and the short-term distortion of the competitive landscape. Over the past three years, China's excess capacity systematically substituted local producers' market share in building materials using price advantages, creating a distorted scenario where consumption grew while producer profits decoupled—consumption rose, production fell, and profits deteriorated. In 2026, everything points in one direction: following the intensive rollout of anti-dumping policies, the competitive landscape is being restructured. The triple signals of production, imports, and pricing have mutually corroborated, providing local steel enterprises with the most forgiving window for profit repair in the past five years.
However, this repair window has a time limit of about 12–18 months. Whether they can complete profit repairs, launch green transition investments, and advance export diversification layouts during this period will determine whether the South American steel industry can secure a higher position on the value chain in the next round of global competition. The quality gap, export concentration, and process transition (the exit costs for blast furnaces are extremely high) are three deep fault lines running through the next 5–10 years; meanwhile, iron ore resource endowments (Carajás mining region iron ore grade at 66%), low-carbon production cost advantages (Gerdau's carbon intensity is only 50% of the global average), and the consumption potential of a 436-million population serve as the most solid long-term value anchors for this market.
![[SMM Hot-Rolled Coil Daily Trading Volume] Spot trading volume releases somewhat.](https://imgqn.smm.cn/usercenter/hyiDc20251217171715.jpg)