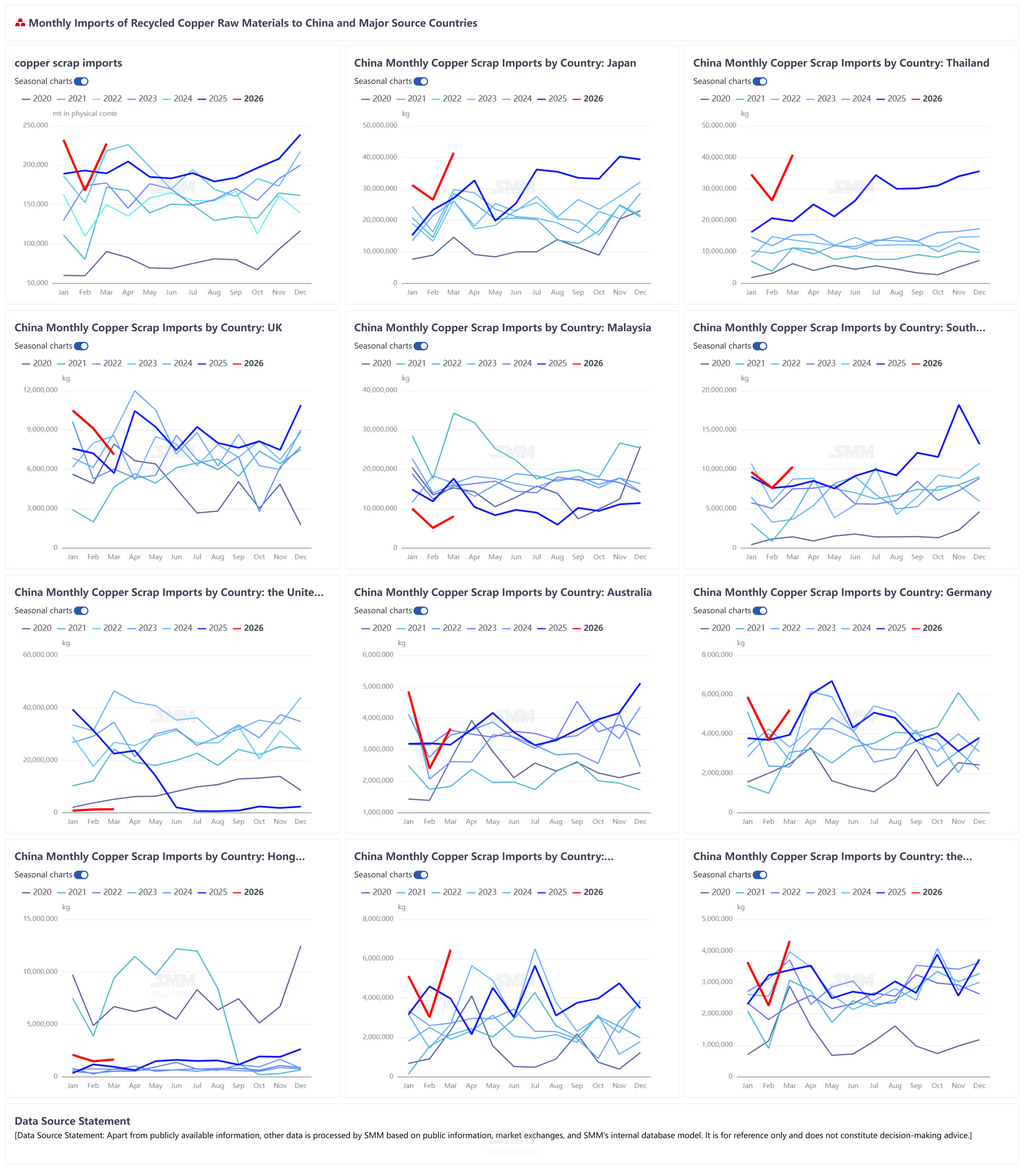
In March 2026, China imported 227,600 mt in physical content of copper scrap and shredded copper scrap, up 35.5% MoM and up 19.94% YoY. Cumulative imports from January to March 2026 reached 627,800 mt in physical content, up 9.72% YoY cumulatively. (HS code: 74040000)
March imports rose significantly, driven by three key factors:
Domestic raw material "undersupply" pushed up import prices: From February to March, domestic tax-inclusive copper scrap supply remained tight. Coupled with tight market bills, domestic trade prices continued to rise. As of April 20, the spot price of imported bare bright copper in Zhejiang was quoted at 102,000-102,100 yuan/mt, with Zhejiang bare bright copper at discounts against futures contract of 800-900 yuan/mt. This "shortage" situation forced downstream enterprises to purchase tax-inclusive copper scrap to meet production needs, even in the face of high absolute prices for tax-inclusive copper scrap and a narrowing price difference between copper cathode and copper scrap. Additionally, from February to March, a phased pullback in copper prices further fueled the sentiment of ex-China suppliers to hold prices firm. Ex-China secondary copper traders maintained a firm quoting stance on bare bright copper, with the corresponding LME pricing coefficient once surging to a high range of 99%-99.5%.
Import profit margins existed: From February to March, the profit and loss on imported copper scrap was mostly positive, meaning the selling price of imported copper scrap upon arrival could cover procurement and logistics costs, providing commercial feasibility for importers.
Concentrated volume release from key supplying countries: Japan and Thailand together contributed 36.19% of total March imports, with MoM increases both exceeding 50%, directly supporting the import surge. Specifically, Japan exported 41,500 mt to China in March, accounting for 18.24%, up 53.61% YoY and up 56.28% MoM; Thailand exported 40,800 mt to China in March, accounting for 17.95%, up 107.33% YoY and up 54.97% MoM; Spain exported 10,900 mt to China in March, accounting for 4.8%, up 94.51% YoY and up 14.87% MoM.
From late March to April, the center of copper prices rebounded compared to February-March, sustaining the sentiment among ex-China secondary copper traders to hold prices firm. The quotation coefficient of bare bright copper against LME stayed in a high range above 99%. Meanwhile, domestic downstream processing enterprises had limited acceptance of high-priced copper scrap and showed a strong willingness to push for lower prices. As a result, the profit margin for imported copper scrap narrowed significantly compared to February-March. However, April is traditionally a peak consumption season in China, and copper processing enterprises maintained high operating rates. More critically, China's copper scrap market still faced two major structural constraints:
The invoice issue has not been fully resolved: The circulation volume of tax-inclusive copper scrap (invoiced sources) in China remains tight, and domestic trade prices stay high. Downstream compliant enterprises have rigid demand for imported invoiced copper scrap to meet production and tax requirements.
The reverse implication of the narrowing price difference between copper cathode and copper scrap: The current narrowing of the price difference between copper cathode and copper scrap is not due to a surplus of copper scrap, but rather due to a large supply gap of copper scrap in China and firm domestic trade prices. This price signal precisely confirms the reality of undersupply of copper scrap in China, and imported sources remain an important channel to bridge the gap.
Therefore, despite the narrowing profit margin, under the pressure of having "no rice to cook," downstream enterprises will still maintain a certain level of import procurement volume. SMM expects that copper scrap imports in April will continue to fluctuate at highs.
![Month-End Covering Demand Provides Support, Center of Shanghai Spot Copper Premiums Moves Slightly Higher [SMM Shanghai Spot Copper]](https://imgqn.smm.cn/usercenter/mqFqG20251217171710.jpg)
![Amid signs of inventory decline, suppliers held prices firm while selling, spot premiums edged up. [SMM South China Copper Spot]](https://imgqn.smm.cn/usercenter/fEiiq20251217171711.jpg)
![Entering Month-End, Wait-and-See Sentiment Is Strong, and the Market Is Relatively Quiet [SMM Yangshan Spot Copper]](https://imgqn.smm.cn/usercenter/xKfXl20251217171711.jpg)